. 2023 Nov 27;14(1):7774.
doi: 10.1038/s41467-023-43392-y.

LipIDens: simulation assisted interpretation of lipid densities in cryo-EM structures of membrane proteins

Affiliations

LipIDens: simulation assisted interpretation of lipid densities in cryo-EM structures of membrane proteins

T Bertie Ansell et al. Nat Commun. .

Abstract

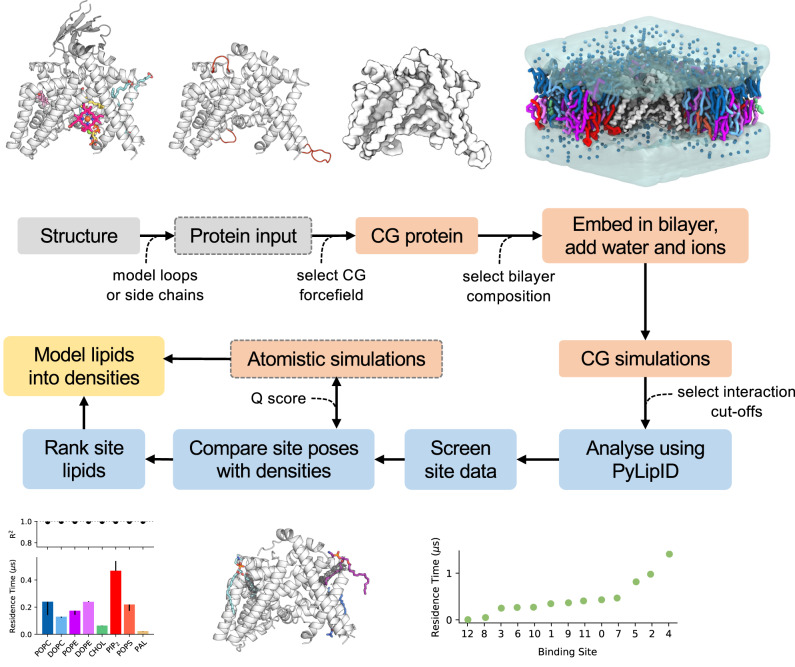
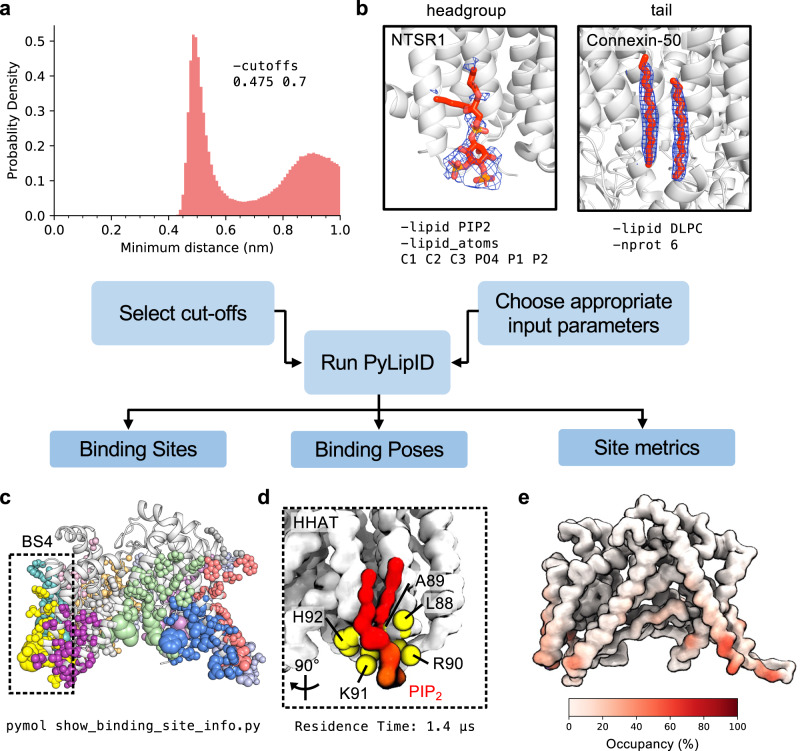
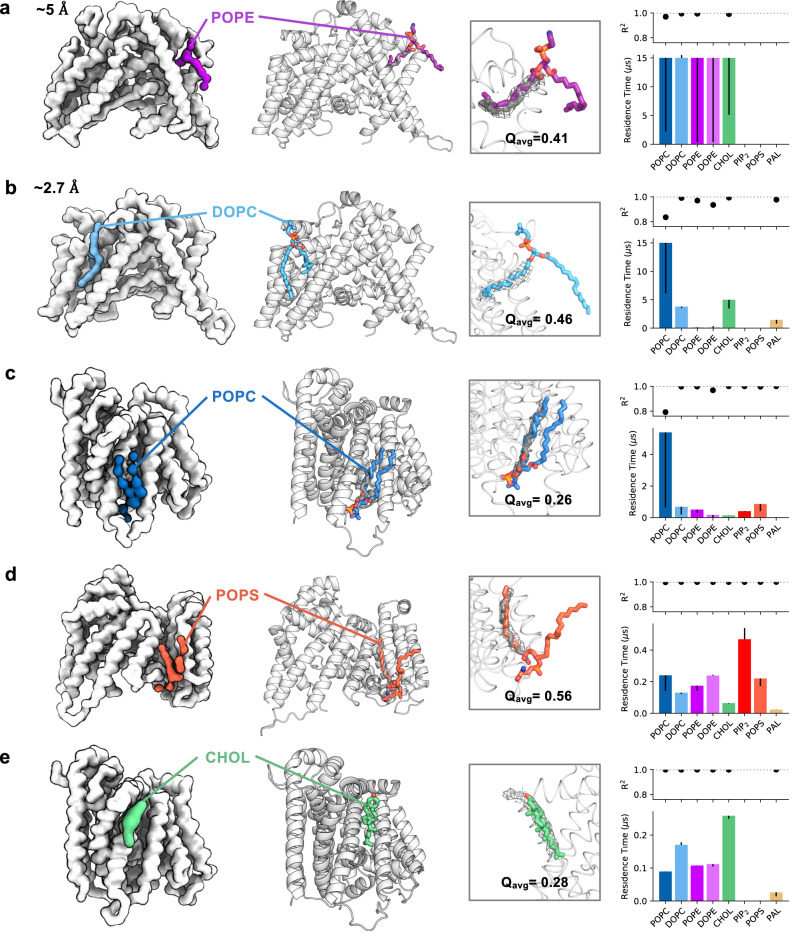
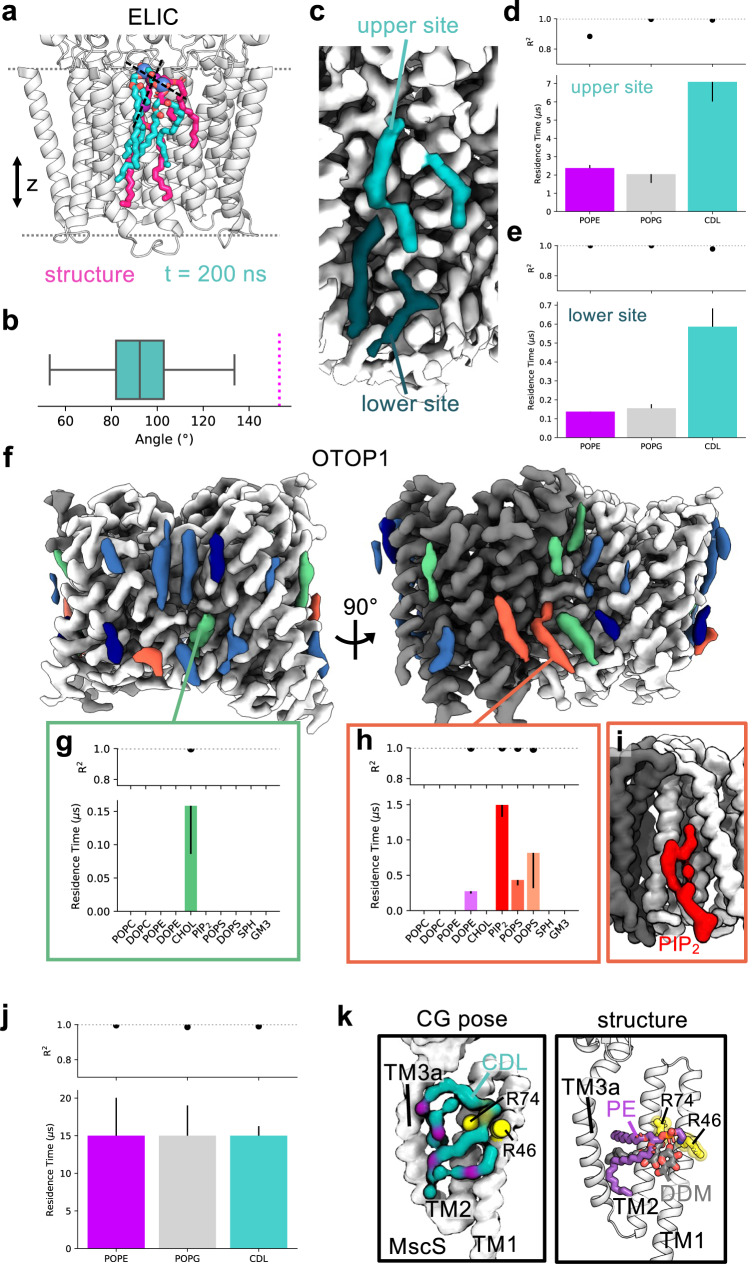
Cryo-electron microscopy (cryo-EM) enables the determination of membrane protein structures in native-like environments. Characterising how membrane proteins interact with the surrounding membrane lipid environment is assisted by resolution of lipid-like densities visible in cryo-EM maps. Nevertheless, establishing the molecular identity of putative lipid and/or detergent densities remains challenging. Here we present LipIDens, a pipeline for molecular dynamics (MD) simulation-assisted interpretation of lipid and lipid-like densities in cryo-EM structures. The pipeline integrates the implementation and analysis of multi-scale MD simulations for identification, ranking and refinement of lipid binding poses which superpose onto cryo-EM map densities. Thus, LipIDens enables direct integration of experimental and computational structural approaches to facilitate the interpretation of lipid-like cryo-EM densities and to reveal the molecular identities of protein-lipid interactions within a bilayer environment. We demonstrate this by application of our open-source LipIDens code to ten diverse membrane protein structures which exhibit lipid-like densities.


Conflict of interest statement

C.S. is a consultant for Dark Blue Therapeutics. The authors declare no other competing interests.

Figures

Fig. 1
Fig. 1. The LipIDens pipeline for characterising lipid densities using simulations.
A workflow for LipIDens assisted interpretation of lipid densities using simulations, applied to Hedgehog acyltransferase (HHAT, PDBid: 7Q1U) enzyme as an example (across n = 10 ×15 μs independent CG simulations). Steps involving structure processing (grey), setup and performing MD simulations (orange), analysis of lipid sites/densities (blue) and modelling (yellow) are indicated. Optional steps are boxed by grey dashed lines. A protein structure is used as input and, if required, missing peptide linkages and/or residue sidechains are amended in the input structure. Superfluous protein components e.g. nanobodies/ligands are removed. The protein is converted to coarse-grained (CG) resolution and embedded in a selected membrane environment which is solvated using water and ions. CG simulations are performed and analysed using the lipid interaction analysis toolkit PyLipID. Lipid binding sites and poses identified by PyLipID are processed, ranked and compared to densities in the cryo-EM map within an interactive PyMOL session to assist interpretation of putative lipid densities in the structure. Illustrative outputs are shown and described in detail in later figures. Bottom right: ranked residence times across all PIP2 binding sites on HHAT. Bottom left: the relative residence times for all lipids binding to a site on HHAT derived from koff values calculated via bi-exponential curve fitting of the interaction survival function. Asymmetric error bars correspond to a second koff value obtained via bootstrapping to the same data.
Fig. 2
Fig. 2. Analysing simulations using PyLipID.
a The upper and lower distance cut-offs used to define lipid contacts with a protein are selected from a probability distribution of the lipid of interest around the protein; exemplified here for PIP2 binding to HHAT. b The user can tune appropriate inputs for the lipid interaction analysis using PyLipID. For example, if only headgroup density is visible the user may limit the selection to lipid headgroup atoms. This is exemplified for a PIP2 (red sticks) binding on the neurotensin receptor (NTSR1, white cartoon). Density modelled as the PIP2 headgroup is shown as blue mesh (PDBid: 6UP7). Alternatively if tail density is visible the user may choose to analyse the whole lipid, as exemplified for densities (blue mesh) visible surrounding the Connexin-50 gap junction channel (PDBid: 7JJP, white cartoon). Analysis can also be averaged over homo-multimeric proteins to enhance sampling of lipid interactions. ce Example outputs from PyLipID analysis of PIP2 binding to HHAT from n = 10 ×15 μs independent CG simulations. A 0.475/0.7 nm dual cut-off was used to analyse interactions with the whole PIP2 lipid. c PIP2 binding sites mapped onto the structure of HHAT. Binding sites are coloured individually and residues comprising each site are shown as spheres, scaled by residence time. The binding site (BS) with the longest residence time (BS4) is boxed. d CG representation of the highest ranked lipid binding pose for PIP2 (red) at BS4. HHAT is shown in white and the top 5 residues with highest residence times within BS4 are shown as yellow spheres. e PIP2 interaction occupancies mapped onto the structure of HHAT, coloured from low (white) to high (red).
Fig. 3
Fig. 3. Screening binding site data.
Metrics for discerning binding site quality during processing of PyLipID outputs. a Comparison of binding site Δkoff values (koff bootstrap—koff curve fit), residence times, site occupancies and surface areas for PIP2 interactions with HHAT (n = 10 ×15 μs independent CG simulations). Binding sites are ranked either from lowest to highest (residence times/occupancies/surface areas) or from worst agreement between calculated site koff values (Δkoff) to best (i.e., closest to 0). Arrows indicate sites corresponding to those in b (green) and c (red). Example binding site plots for PIP2 binding to a (b) well sampled site (BS4) and (c) an infrequently observed site (BS12) on HHAT. In each case a sorted index of interaction durations within the simulations is shown on the left panel. The right plot corresponds to the survival time correlation function of interaction durations (purple dots). koff values are derived either via biexponential curve fitting to the survival time correlation function (red line) or via bootstrapping (grey lines).
Fig. 4
Fig. 4. Comparison of cryo-EM densities with lipid poses from simulations.
Identification of representative bound poses of lipid species to assist interpretation of cryo-EM densities, exemplified for lipid interactions surrounding HHAT. Left: CG binding poses for lipids bound to identified binding sites on HHAT. CG simulations were initiated using a low-resolution structure derived from a preliminary cryo-EM map (a, ~5 Å) or a higher resolution map (be ~2.7 Å) to illustrate how LipIDens can be implemented throughout the model building process. HHAT was simulated for n = 10 ×15 μs in each case. Middle left: selected pose of a lipid bound to HHAT during atomistic simulations initiated by back-mapping from CG simulations. Middle right: comparison of cryo-EM densities (grey mesh) with the atomistic pose. Modelled palmitate moieties in the HHAT structure are shown as grey sticks. Average Q scores for the atomistic lipid tail pose within the cryo-EM density are indicated. Right: binding site residence times and R2 values for each lipid which binds to the site, used to assess preferential binding of a lipid species to specific sites. Residence time is defined as 1/koff whereby koff is obtained by bi-exponential curve fitting to the interaction survival function. Asymmetric residence time error bars report a second koff value calculated via bootstrapping. POPC is coloured dark blue, DOPC light blue, POPE purple, DOPE pink, cholesterol green, PIP2 red, POPS coral and palmitate (PAL) ochre throughout.
Fig. 5
Fig. 5. Application of the pipeline to a range of example proteins.
The LipIDens pipeline applied to assist interpretation of lipid-like densities within structures of ae the Erwinia pentameric ligand-gated ion channel (ELIC, PDBid 7L6Q), fi the proton channel Otopetrin1 (OTOP1, PDBid 6NF4) and j, k the E. coli mechanosensitive ion channel (MscS, PDBid 7ONJ). a Overlay of the structurally modelled cardiolipin (CDL) pose on ELIC (magenta) with the pose at the end (t = 200 ns) of an atomistic simulation (teal) initiated from the top ranked CG CDL binding pose. Phosphate groups of each CDL molecule are shown as spheres connected by a vector indicating the relative lipid tilt angle. b Angle of the vector with respect to z across n = 3 ×200 ns independent atomistic simulations (teal). The magenta line indicates the structurally modelled lipid tilt angle (153°). Box plot divisions for n = 3003 angles measured: lower quartile (82°), median (92°), upper quartile (103°), whiskers excluding outliers (minimum: 53°, maximum: 134°). c Discontinuity between the lipid-like densities within the upper (teal) and lower (dark teal) leaflets across the bilayer midplane. Relative residence times for PE, PG and CDL binding to the identified upper (d) and lower (e) sites (defined as in Fig. 4), across n = 10 ×15 μs independent CG simulations. Asymmetric residence time error bars report the second koff value calculated via bootstrapping (also applies to parts g, h and j). f Lipid-like densities surrounding OTOP1 coloured according to whether bound cholesterol (green) or PIP2/PS (red) were among the highest site residence times. Other lipid densities where sites were identified by PyLipID are shown in blue (see Supplementary Fig. 4) and densities where sites were not identified are dark blue. g Exclusive binding of cholesterol between the OTOP1 N- and C- domains, corresponding to the cholesterol site modelled in the structure. h Preferential binding of anionic lipids at a kinked lipid density at the OTOP1 dimer interface. i Top ranked PIP2 binding pose identified by PyLipID from CG simulations, showing curved tail position which matches the lipid density at this site. j Prolonged interactions of PE, PG and CDL with MscS between TM2 and TM3a. k Comparison of the top ranked CDL binding pose from CG simulations (left) with the modelled PE and DDM molecules in the MscS structure (right) showing tail insertion/stacking between TM2 and TM3a and a tilted lipid binding pose.
Fig. 6
Fig. 6. Interpreting adjacent lipid-like densities surrounding TRPV6.
a Snapshot from the interactive PyMOL session comparing lipid poses with site densities surrounding TRPV6 (PDBid: 7S88). The lipid poses at five binding sites (BS1, BS3, BS4, BS5, BS13) are shown as sticks and partitioned site density maps are shown as mesh. b Relative residence times and c selected top-ranked lipid binding poses for BS1 across n = 10 ×15 μs independent CG simulations. Residence times were derived from koff values obtained via bi-exponential curve fitting of the interaction survival function. Error bars correspond to koff values obtained from bootstrapping to the same data. Lipid poses correspond to those directly backmapped from CG simulations (without refinement using atomistic simulations). Partitioned site densities are shown as mesh while the density of interest and modelled lipids/acyls are shown in grey. d, e As in b/c for BS13. Lipids are coloured as in Fig. 4 throughout. f Lipid-like densities (numbered i-iv) at BS3. Those modelled within the structure are grey. An additional density visible at a higher sigma value is shown in cyan. g Comparison of all lipid poses with densities at BS3, showing conservation of the headgroup position and tail variability. Overlay of h PIP2/POPS/DOPS and i POPC/DOPC/POPE/DOPE poses with densities at BS3. Relative residence time plots for j BS3 and k BS4 (defined as in b). l Overlay of one tail of all lipid poses for BS4 (lilac) with a single tail of densities modelled as POPC (grey). The top-ranked cholesterol pose from the neighbouring binding site (BS5) is shown in green. m Comparison of the BS5 cholesterol pose with the density assigned to the second tail of the modelled POPC (grey).

References

    1. Birch J, et al. Changes in membrane protein structural biology. Biology. 2020;9:1–31. doi: 10.3390/biology9110401. - DOI - PMC - PubMed
    1. Yao X, Fan X, Yan N. Cryo-EM analysis of a membrane protein embedded in the liposome. Proc. Natl Acad. Sci. USA. 2020;117:18497–18503. doi: 10.1073/pnas.2009385117. - DOI - PMC - PubMed
    1. Nakane T, et al. Single-particle cryo-EM at atomic resolution. Nature. 2020;587:152–156. doi: 10.1038/s41586-020-2829-0. - DOI - PMC - PubMed
    1. Nadezhdin KD, et al. Structural mechanism of heat-induced opening of a temperature-sensitive TRP channel. Nat. Struct. Mol. Biol. 2021;28:564–572. doi: 10.1038/s41594-021-00615-4. - DOI - PMC - PubMed
    1. Flores JA, et al. Connexin-46/50 in a dynamic lipid environment resolved by CryoEM at 1.9 Å. Nat. Commun. 2020;11:1–11. doi: 10.1038/s41467-020-18120-5. - DOI - PMC - PubMed

Publication types