. 2023 Nov 27;14(1):7781.
doi: 10.1038/s41467-023-43590-8.

scDREAMER for atlas-level integration of single-cell datasets using deep generative model paired with adversarial classifier

Affiliations

scDREAMER for atlas-level integration of single-cell datasets using deep generative model paired with adversarial classifier

Ajita Shree et al. Nat Commun. .

Abstract

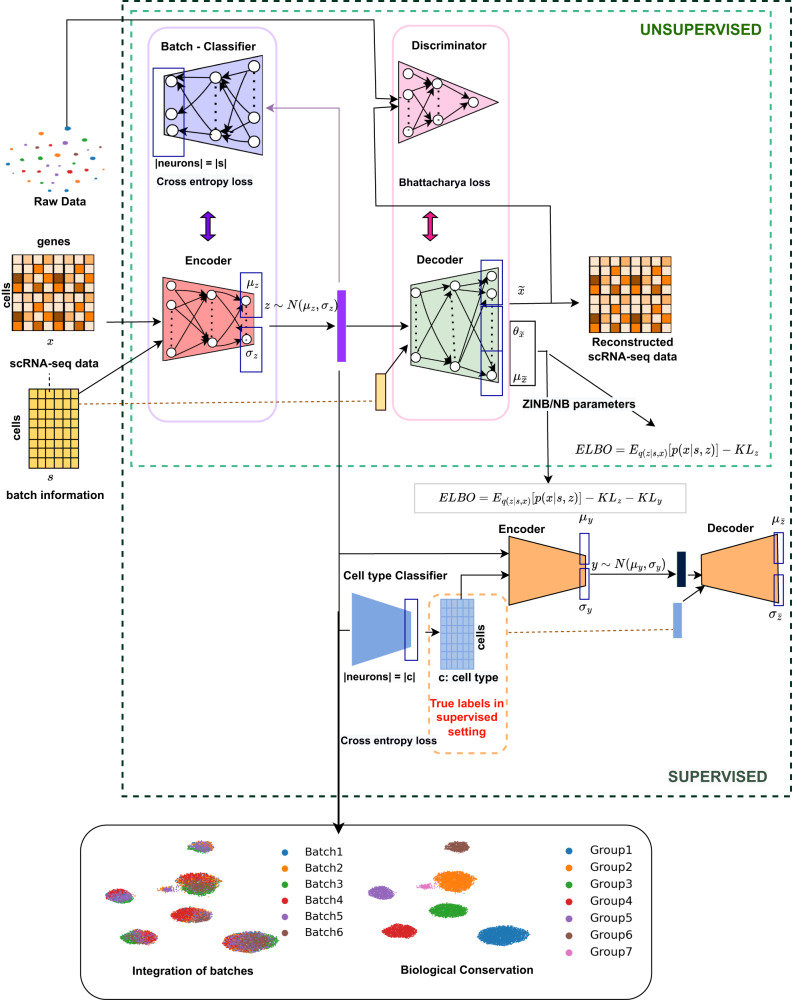
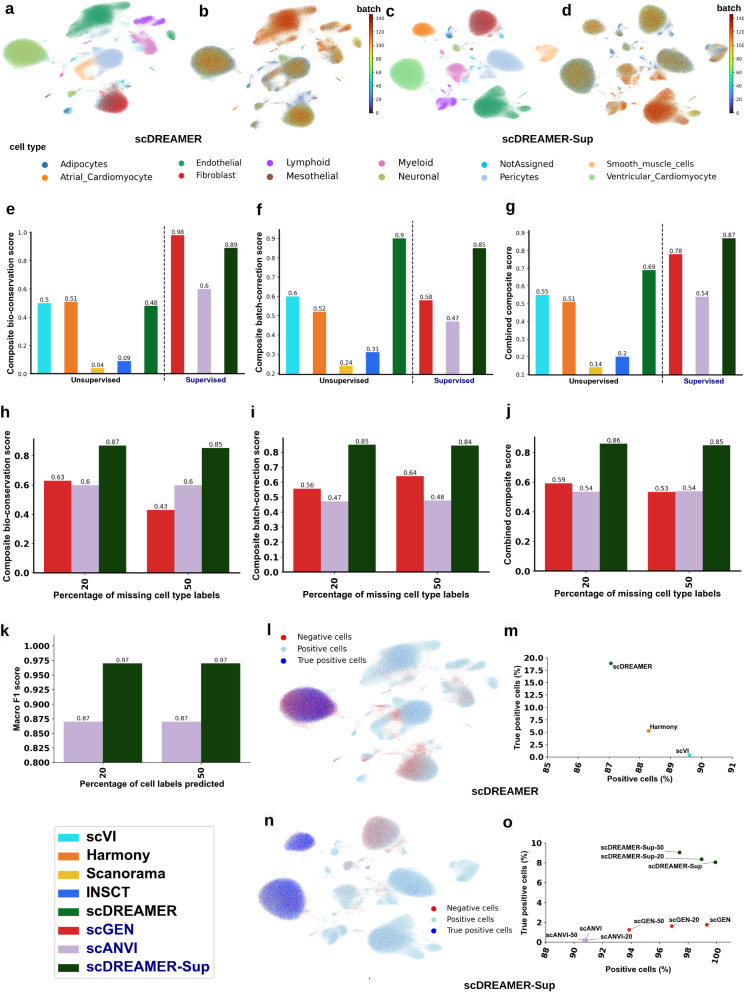
Integration of heterogeneous single-cell sequencing datasets generated across multiple tissue locations, time, and conditions is essential for a comprehensive understanding of the cellular states and expression programs underlying complex biological systems. Here, we present scDREAMER ( https://github.com/Zafar-Lab/scDREAMER ), a data-integration framework that employs deep generative models and adversarial training for both unsupervised and supervised (scDREAMER-Sup) integration of multiple batches. Using six real benchmarking datasets, we demonstrate that scDREAMER can overcome critical challenges including skewed cell type distribution among batches, nested batch-effects, large number of batches and conservation of development trajectory across batches. Our experiments also show that scDREAMER and scDREAMER-Sup outperform state-of-the-art unsupervised and supervised integration methods respectively in batch-correction and conservation of biological variation. Using a 1 million cells dataset, we demonstrate that scDREAMER is scalable and can perform atlas-level cross-species (e.g., human and mouse) integration while being faster than other deep-learning-based methods.


Conflict of interest statement

The authors declare no competing interests.

Figures

Fig. 1
Fig. 1. Overview of scDREAMER and scDREAMER-Sup.
scDREAMER consists of an adversarial variational autoencoder and a batch classifier. The adversarial variational autoencoder comprises of three networks: an encoder, a decoder, and a discriminator, and these networks are trained using ELBO and Bhattacharya loss functions. The batch classifier is adversarially trained along with the encoder using a cross-entropy loss. scDREAMER learns latent cellular embeddings such that the cells from different batches are well-mixed and different cell types are separated leading to the conservation of biological variations. scDREAMER-Sup consists of an additional variational autoencoder and a cell-type classifier in addition to the components in scDREAMER. The hierarchical variational autoencoder is trained using an ELBO loss. The cell type classifier is trained using a cross-entropy loss. scDREAMER-Sup learns latent cellular embeddings such that the cells from different batches are well-mixed with improved conservation of biological variations.
Fig. 2
Fig. 2. Integration of pancreatic islet data.
a Visualization of scDREAMER’s latent space embeddings after integration of pancreatic islet dataset. Different colors denote different pancreatic cell types. b Visualization of scDREAMER’s latent space embeddings, cells are colored based on batch information. Comparison of c composite bio-conservation score, d composite batch-correction score and e combined composite score metrics between scVI, Harmony, Seurat, BBKNN, Scanorama, INSCT, LIGER, iMAP, scDML and scDREAMER. f Comparison of composite isolated label scores to assess how well rare cell types are identified. g Comparison of iLISI and cLISI values. Each box-and-whisker plot summarizes LISI values (n = 8208 cells, ~50% of the cells in the dataset as suggested in ref. ), the box denotes the interquartile range (IQR, the range between the 25th and 75th percentile) with the median value, whiskers indicate the maximum and minimum value within 1.5 times the IQR, outliers are denoted by black circles. h Qualitative assessment of batch-mixing by visualization of scDREAMER’s latent space embeddings, cells are colored based on three categories—positive, negative and true positive. i Quantitative assessment of batch-mixing of scDREAMER against LIGER and Harmony based on the percentage of positive vs true positive cells. Source data are provided as a Source Data file.
Fig. 3
Fig. 3. Integration of lung atlas data.
a Visualization of scDREAMER’s latent space embeddings after integration of lung atlas dataset. Different colors denote different lung cell types. b Visualization of scDREAMER’s latent space embeddings, cells are colored based on the batch information. Comparison of c composite bio-conservation score, d composite batch-correction score and e combined composite score metrics between scVI, Harmony, Seurat, BBKNN, Scanorama, INSCT, LIGER, iMAP, scDML and scDREAMER for the integration of lung atlas data. f Comparison of composite isolated label scores to assess how well rare cell types are identified. g Comparison of iLISI and cLISI values. Each box-and-whisker plot summarizes LISI values (n = 16,274 cells, ~50% of the cells in the dataset as suggested in ref. ), the box denotes the interquartile range (IQR, the range between the 25th and 75th percentile) with the median value, whiskers indicate the maximum and minimum value within 1.5 times the IQR, outliers are denoted by black circles. h Qualitative assessment of batch-mixing by visualization of scDREAMER’s latent space embeddings, cells are colored based on three categories—positive, negative and true positive. i Quantitative assessment of batch-mixing of scDREAMER against scVI and Harmony based on the percentage of positive vs true positive cells. Source data are provided as a Source Data file.
Fig. 4
Fig. 4. Integration of human immune data.
a Visualization of scDREAMER’s latent space embeddings after integration of human immune dataset. Different colors denote different cell types present in the human immune dataset. b Visualization of scDREAMER’s latent space embeddings, cells are colored based on the batch information. Comparison of c composite bio-conservation score, d composite batch-correction score and e combined composite score metrics between scVI, Harmony, Seurat, BBKNN, Scanorama, INSCT, LIGER, iMAP, scDML and scDREAMER for the integration of human immune data. f Comparison of composite isolated label scores to assess how well rare cell types are identified. g Comparison of iLISI and cLISI values. Each box-and-whisker plot summarizes LISI values (n = 16,754 cells, ~50% of the cells in the dataset as suggested in ref. ), the box denotes the interquartile range (IQR, the range between the 25th and 75th percentile) with the median value, whiskers indicate the maximum and minimum value within 1.5 times the IQR, outliers are denoted by black circles. h Qualitative assessment of batch-mixing by visualization of scDREAMER’s latent space embeddings, cells are colored based on three categories—positive, negative and true positive. i Quantitative assessment of batch-mixing of scDREAMER against scVI and Harmony based on the percentage of positive vs true positive cells. Source data are provided as a Source Data file.
Fig. 5
Fig. 5. scDREAMER-Sup utilizes cell type labels to improve bio-conservation.
a Visualization of scDREAMER-Sup’s latent space embeddings after integration of lung atlas dataset. Different colors denote different lung cell types. b Visualization of scDREAMER-Sup’s latent space embeddings, cells are colored based on the batch information. Comparison of c composite bio-conservation score, d composite batch-correction score, e combined composite score metrics, f iLISI and cLISI values between scGEN, scANVI, and scDREAMER-Sup for different percentages of missing cell type labels for lung atlas dataset. g Quantitative assessment of batch-mixing of scDREAMER-Sup against scANVI and scGEN based on the percentage of positive vs true positive cells for lung atlas dataset. h Comparison of cell label prediction accuracy between scDREAMER-Sup and scANVI for different percentages of missing cell type labels for the lung atlas dataset. i Visualization of scDREAMER-Sup’s latent space embeddings after integration of human immune dataset. Different colors denote different lung cell types. j Visualization of scDREAMER-Sup’s latent space embeddings, cells are colored based on the batch information. Comparison of k composite bio-conservation score, l composite batch-correction score, m combined composite score metrics, n iLISI and cLISI values between scGEN, scANVI, and scDREAMER-Sup for different percentages of missing cell type labels for the human immune dataset. o Quantitative assessment of batch-mixing of scDREAMER-Sup against scANVI and scGEN based on the percentage of positive vs true positive cells for the human immune dataset. p Comparison of cell label prediction accuracy between scDREAMER-Sup and scANVI for different percentages of missing cell type labels for the human immune dataset. For (f) and (n), each box-and-whisker plot summarizes LISI values for 50% of the cells in the datasets as suggested in ref. ((f) n = 16,260 cells, (n) n = 16,770 cells), the box denotes the interquartile range (IQR, the range between the 25th and 75th percentile) with the median value, whiskers indicate the maximum and minimum value within 1.5 times the IQR, outliers are denoted by black circles. Source data are provided as a Source Data file.
Fig. 6
Fig. 6. scDREAMER integrates heart atlas cells from a large number (147) of batches.
a Visualization of scDREAMER’s latent space embeddings after the integration of 147 batches. Different colors denote different cell types in this large dataset consisting of ~0.5 million cells. ‘NotAssigned’ represents the cells without any cell type assignment. b Visualization of scDREAMER’s latent space embeddings, cells are colored based on the batch information. c Visualization of scDREAMER-Sup’s latent space embeddings, cells are colored based on cell types. d Visualization of scDREAMER-Sup’s latent space embeddings, cells are colored based on the batch information. Comparison of e composite bio-conservation score, f composite batch-correction score, and g combined composite score metrics between unsupervised (scVI, Harmony, Seurat, Scanorama, INSCT, scDREAMER) and supervised (scGEN, scANVI, and scDREAMER-Sup) methods. Comparison of h composite bio-conservation score, i composite batch-correction score, and j combined composite score metrics between scGEN, scANVI and scDREAMER-Sup for different percentages of missing cell type labels for the heart atlas dataset. k Comparison of cell label prediction accuracy between scDREAMER-Sup and scANVI for different percentages of missing cell type labels for the heart atlas dataset. l Qualitative assessment of batch-mixing by visualization of scDREAMER’s latent space embeddings, cells are colored based on three categories—positive, negative and true positive. m Quantitative assessment of batch-mixing of scDREAMER against that of scVI and Harmony based on the percentage of positive vs. true positive cells. n Qualitative assessment of batch-mixing by visualization of scDREAMER-Sup’s latent space embeddings, cells are colored based on three categories—positive, negative and true positive. o Quantitative assessment of batch-mixing of scDREAMER-Sup against that of scANVI and scGEN based on the percentage of positive vs. true positive cells for the heart atlas dataset. Source data are provided as a Source Data file.
Fig. 7
Fig. 7. scDREAMER enables robust integration of millions of cells across species.
a Visualization of scDREAMER’s latent space embeddings after the integration of human (HCL) and mouse cells (MCA). Different colors denote different cell types in this large dataset consisting of ~1 million cells. b Visualization of scDREAMER’s latent space embeddings, cells are colored based on the batch information. c Visualization of scDREAMER-Sup’s latent space embeddings after the integration of human (HCL) and mouse cells (MCA). Different colors denote different cell types. d Visualization of scDREAMER-Sup’s latent space embeddings, cells are colored based on the batch information. Comparison of e composite bio-conservation score, f composite batch-correction score and g combined composite score metrics between scVI, Harmony, Seurat, BBKNN, Scanorama, INSCT, LIGER, iMAP, scDML, scDREAMER, scGEN, scANVI and scDREAMER-Sup for the integration of HCL and MCA cells. h Quantitative assessment of batch-mixing of scDREAMER against that of scVI, Scanorama and LIGER based on the percentage of positive vs true positive cells. i Quantitative assessment of batch-mixing of scDREAMER-Sup against that of scGEN and scANVI based on the percentage of positive vs true positive cells. j Qualitative assessment of batch-mixing by visualization of scDREAMER’s latent space embeddings, cells are colored based on three categories—positive, negative and true positive. k Qualitative assessment of batch-mixing by visualization of scDREAMER-Sup’s latent space embeddings, cells are colored based on three categories—positive, negative and true positive. l Comparison of scDREAMER runtime against that of scVI and INSCT across four different scRNA datasets consisting of 10k, 100k, 500k, and 1M cells subsampled from the cross-species integration dataset. Source data are provided as a Source Data file.

References

    1. Papalexi E, Satija R. Single-cell RNA sequencing to explore immune cell heterogeneity. Nat. Rev. Immunol. 2018;18:35–45. doi: 10.1038/nri.2017.76. - DOI - PubMed
    1. Pijuan-Sala B, et al. A single-cell molecular map of mouse gastrulation and early organogenesis. Nature. 2019;566:490–495. doi: 10.1038/s41586-019-0933-9. - DOI - PMC - PubMed
    1. Suvà ML, Tirosh I. Single-cell RNA sequencing in cancer: lessons learned and emerging challenges. Mol. Cell. 2019;75:7–12. doi: 10.1016/j.molcel.2019.05.003. - DOI - PubMed
    1. Rozenblatt-Rosen O, Stubbington MJ, Regev A, Teichmann SA. The human cell atlas: from vision to reality. Nature. 2017;550:451–453. doi: 10.1038/550451a. - DOI - PubMed
    1. Snyder MP, et al. The human body at cellular resolution: the NIH human biomolecular atlas program. Nature. 2019;574:187–192. doi: 10.1038/s41586-019-1629-x. - DOI - PMC - PubMed

Publication types