. 2023 Nov 27;14(1):7775.
doi: 10.1038/s41467-023-43005-8.

Fragment-sequencing unveils local tissue microenvironments at single-cell resolution

Affiliations

Fragment-sequencing unveils local tissue microenvironments at single-cell resolution

Kristina Handler et al. Nat Commun. .

Abstract

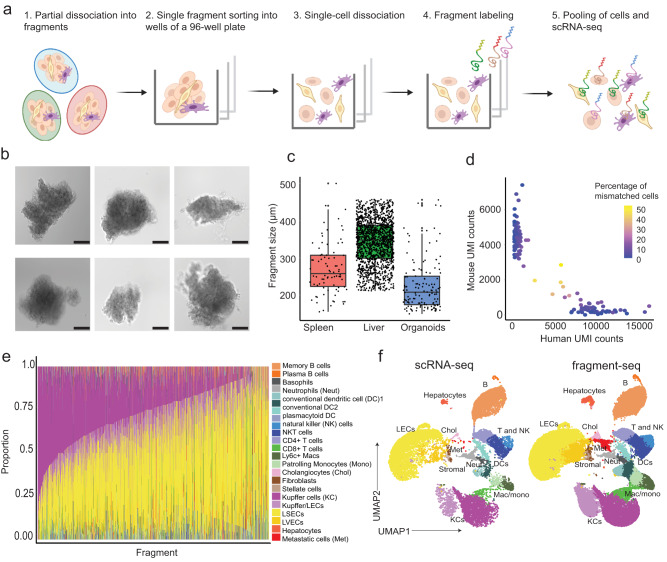
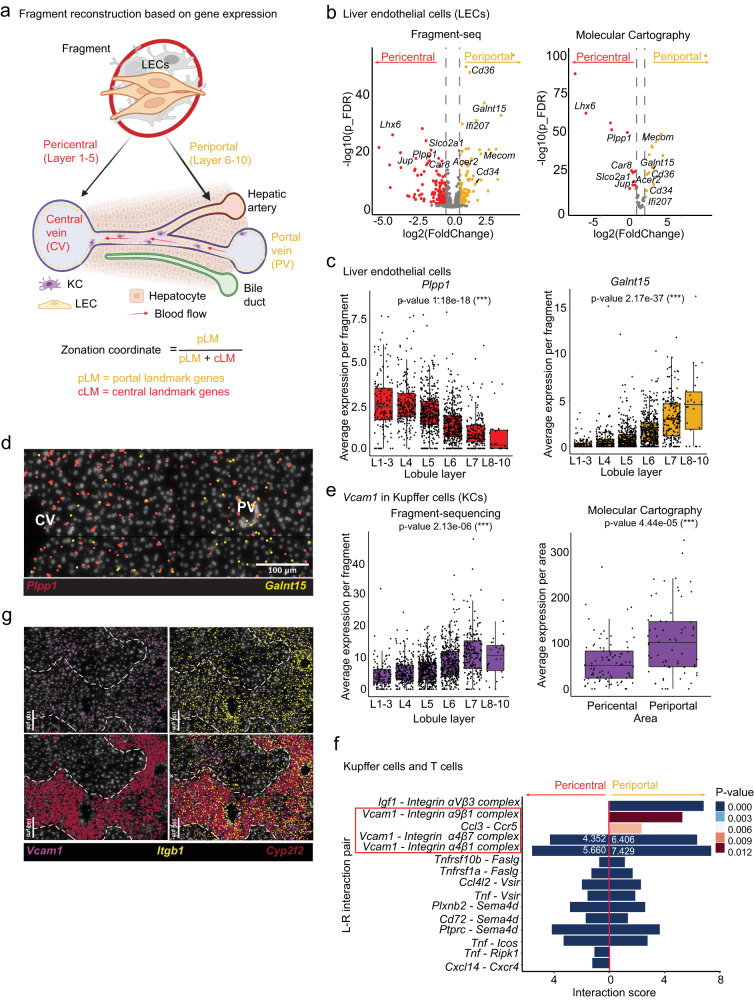
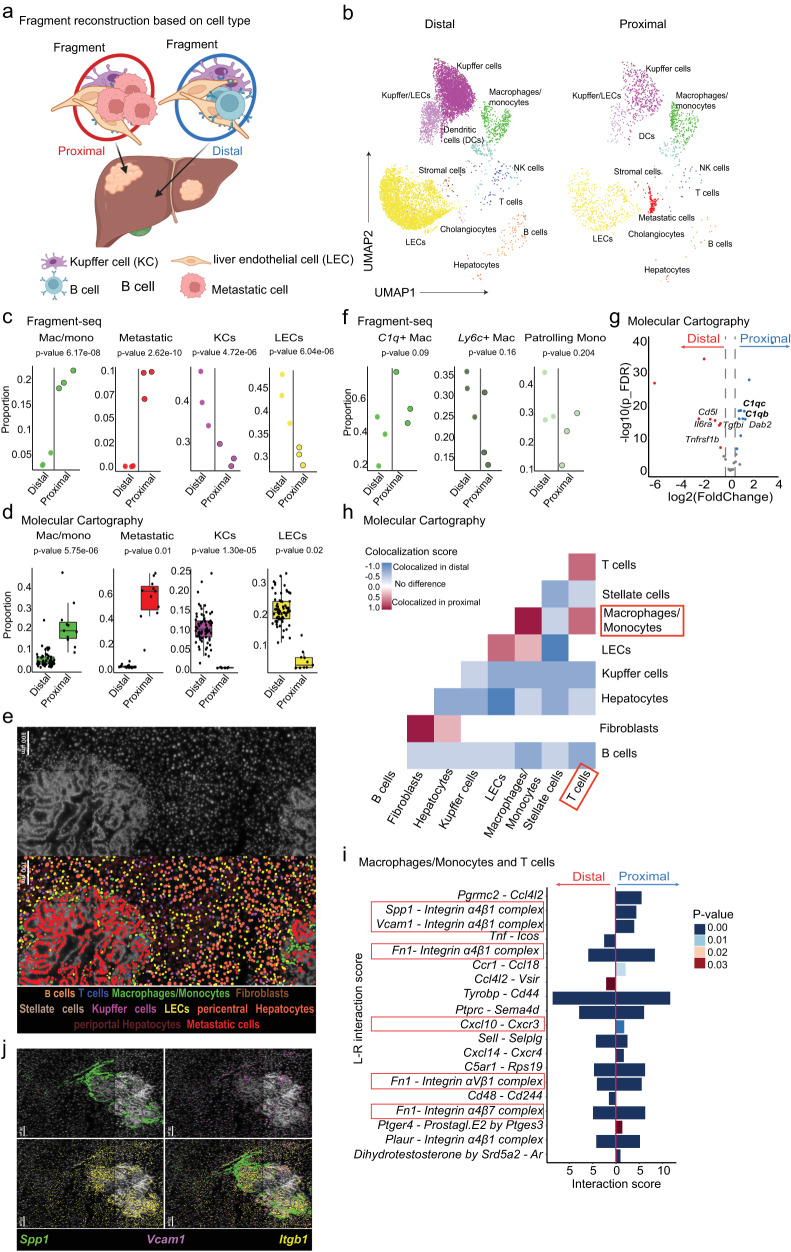
Cells collectively determine biological functions by communicating with each other-both through direct physical contact and secreted factors. Consequently, the local microenvironment of a cell influences its behavior, gene expression, and cellular crosstalk. Disruption of this microenvironment causes reciprocal changes in those features, which can lead to the development and progression of diseases. Hence, assessing the cellular transcriptome while simultaneously capturing the spatial relationships of cells within a tissue provides highly valuable insights into how cells communicate in health and disease. Yet, methods to probe the transcriptome often fail to preserve native spatial relationships, lack single-cell resolution, or are highly limited in throughput, i.e. lack the capacity to assess multiple environments simultaneously. Here, we introduce fragment-sequencing (fragment-seq), a method that enables the characterization of single-cell transcriptomes within multiple spatially distinct tissue microenvironments. We apply fragment-seq to a murine model of the metastatic liver to study liver zonation and the metastatic niche. This analysis reveals zonated genes and ligand-receptor interactions enriched in specific hepatic microenvironments. Finally, we apply fragment-seq to other tissues and species, demonstrating the adaptability of our method.


Conflict of interest statement

The authors declare no competing interests.

Figures

Fig. 1
Fig. 1. Overview of fragment-seq and assessment of quality and accuracy.
a Schematic illustration of fragment-seq workflow. scRNA-seq: single-cell RNA-sequencing. Created with BioRender.com. b Brightfield microscopy images of representative liver fragments. Scale bar: 100 μm. Imaging was performed for 9 96-well plates in one experiment with results shown in Supplementary Fig. 1b, here six representative fragments are shown. c Fragment-size distribution of sorted fragments from different tissues visualized in boxplots [n = 82 (murine spleen), 1468 (murine liver), 138 (CRC organoid) fragments]. Black dots indicate fragments. For box and whiskers plots the middle line represents the median; the upper and lower lines are the first and third quartile (Q1 and Q3); the whiskers indicate the upper and lower limits of data spread by subtracting 1.5* interquartile range (IQR) from Q1 and adding 1.5* IQR to Q3. d Scatter plot showing the fraction of mismatched cells. Dots represent fragments and their color indicates the percentage of mismatched cells (human cells within mouse fragments and mouse cells within human fragments) (n = 139 fragments from 1 sample). UMI unique molecular identifier. e Barplot showing cell type proportions per fragment; only fragments with at least 5 cells are considered (n = 1568 fragments from a total of 10 samples). LEC liver endothelial cell, LSECs liver sinusoidal endothelial cells, LVECs lymphatic vascular endothelial cells. MAC macrophages f Uniform manifold approximation and projection (UMAP) visualization of batch-corrected (see the “Methods” section), single-cell transcriptomes from fragment-seq and scRNA-seq of mouse metastatic liver samples. Cells are clustered, annotated, and colored by their cell type. Cells are separated based on the protocol [conventional scRNA-seq (n = 2 samples) and fragment-seq (n = 10 samples)]. For c and d the source data are provided as a Source Data file.
Fig. 2
Fig. 2. Fragment-seq application to investigate gene zonation during liver metastasis.
a Schematics of liver microanatomy and fragment zonation approach. Created with BioRender.com. b Differentially expressed genes (DEGs) of LECs in spatially ordered fragments. Left, fragment-seq (1384 fragments across 9 samples). Right, Molecular Cartography (MC) (155 areas across 4 samples). Colored dots represent significantly enriched genes; red, enriched in pericentral zones; yellow, enriched in periportal zones. Gene labels indicate genes significantly enriched in both analyses. p_FDR: false discovery rate adjusted p-value. c Boxplots showing gene expression in LECs of spatially ordered fragments (n = L1–L3: 137, L4: 214, L5: 402, L6: 409, L7: 196, L8–L10: 26 fragments across 9 samples). Black dots represent individual fragments. d Representative images of MC of Plpp1 (red) and Galnt15 (yellow) are shown as an overlay with DAPI signal (white). CV central vein, PV portal vein. e Boxplots of Vcam1 gene expression in Kupffer cells (KCs) of spatially ordered fragments or spatial areas. Left, fragment-seq (like in c) (n = L1–L3: 115, L4: 206, L5: 379, L6: 387, L7: 182, L8–L10: 26 fragments across 9 samples); right, MC comparing pericentral and periportal. f Predicted ligand–receptor (L–R) interactions between KCs and T cells in grouped fragments from pericentral or periportal origin (n = 9 samples). Interaction scores were calculated from grouped fragment-seq data by CellPhoneDB, which uses a permutation test to generate p-values (unadjusted) indicating significantly enriched L–R interactions. Interactions referenced in the main text are highlighted with red squares and white numbers indicate interaction scores. g Representative MC of Vcam1 (purple), Itgb1 (yellow), and Cyp2f2 (red) shown as an overlay with DAPI signal (white). For MC in d, e, and g the complete dataset (as shown in d) was from pericentral n = 89; periportal n = 66 areas across four samples from four separate experiments. For b, c, and e, we used a negative binomial generalized log-linear model (‘glmQLFTest‘ function of edgeR), which uses a (two-sided) empirical Bayes quasi-likelihood F-test. P-values (Benjamini–Hochberg adjusted) of <0.05 were considered significant (***<0.001). For b, c, e, and f the source data are provided as a Source Data file. For all box and whiskers plots the middle line represents the median; the upper and lower lines are the first and third quartile (Q1 and Q3); the whiskers indicate the upper and lower limits of data spread by subtracting 1.5* interquartile range (IQR) from Q1 and adding 1.5* IQR to Q3. L–R: ligand–receptor.
Fig. 3
Fig. 3. Fragment-seq application to investigate local differences in metastatic-proximal and -distal microenvironments.
a Schematics of reconstructing fragment position based on the presence of metastatic cells (distal = fragments without metastatic cells; proximal = fragments with metastatic cells). Created with BioRender.com. b Separated UMAPs based on reconstructed groups from integrated samples (n = 3). Cells are clustered, annotated, and colored by their cell type. c Dot plots representing cell type proportions of grouped fragment-seq data (n = 3 samples). From left to right: macrophages/monocytes (Mac/Mono), metastatic cells, KCs, and LECs. Dots represent individual mice and dots with black circles represent grouped proximal fragments. d As in c, but dots represent areas from molecular cartography (MC). e Representative MC images; upper image: DAPI (white); lower image, DAPI stain overlayed with cell type annotations. f As in c, from indicated Mac/Mono subtypes (n = 3 samples). g Differentially expressed genes (DEGs) of macrophages/monocytes between distal and proximal regions from MC highlighted in a volcano plot. Colored dots represent significantly enriched genes; blue, enriched in proximal; red, enriched in distal. p_FDR: false discovery rate adjusted p-value. h Cell colocalization map built from MC data comparing the frequency of colocalization in distal and proximal areas using a two-sided permutation test, no correction for multiple comparisons. i Predicted ligand–receptor (L–R) interactions between macrophages/monocytes and T cells in distal or proximal areas based on fragment-seq data (n = 3 samples). Interaction scores were calculated from grouped fragment-seq data by CellPhoneDB using a permutation test (unadjusted p-value indicated). j Representative MC image of Spp1 (green), Vcam1 (purple), and Itgb1 (yellow) shown as an overlay with DAPI signal (white). MC data in d, e, g, h, and j represents two samples from two independent experiments from mice with visible macrometastases (n = distal: 71, proximal: 11 areas). For c, d, f, and g, we used a negative binomial generalized log-linear model (‘glmQLFTest‘ function of edgeR), which uses a (two-sided) empirical Bayes quasi-likelihood F-test. P-values (Benjamini–Hochberg adjusted) of <0.05 were considered significant. For, c, d, and f–i the source data are provided as a Source Data file. For all box and whiskers plots the middle line represents the median; the upper and lower lines are the first and third quartile (Q1 and Q3); the whiskers indicate the upper and lower limits of data spread by subtracting 1.5* interquartile range (IQR) from Q1 and adding 1.5* IQR to Q3. L–R: ligand–receptor.

References

    1. Chen KH, Boettiger AN, Moffitt JR, Wang S, Zhuang X. RNA imaging. Spatially resolved, highly multiplexed RNA profiling in single cells. Science. 2015;348:aaa6090. doi: 10.1126/science.aaa6090. - DOI - PMC - PubMed
    1. Eng C-HL, et al. Transcriptome-scale super-resolved imaging in tissues by RNA seqFISH+ Nature. 2019;568:235–239. doi: 10.1038/s41586-019-1049-y. - DOI - PMC - PubMed
    1. Goh JJL, et al. Highly specific multiplexed RNA imaging in tissues with split-FISH. Nat. Methods. 2020;17:689–693. doi: 10.1038/s41592-020-0858-0. - DOI - PubMed
    1. Lee JH, et al. Fluorescent in situ sequencing (FISSEQ) of RNA for gene expression profiling in intact cells and tissues. Nat. Protoc. 2015;10:442–458. doi: 10.1038/nprot.2014.191. - DOI - PMC - PubMed
    1. Wang X, et al. Three-dimensional intact-tissue sequencing of single-cell transcriptional states. Science. 2018;361:eaat5691. doi: 10.1126/science.aat5691. - DOI - PMC - PubMed

Publication types

Associated data