. 2023 Nov 27;14(1):7770.
doi: 10.1038/s41467-023-43652-x.

Mutual modulation of gut microbiota and the immune system in type 1 diabetes models

Affiliations

Mutual modulation of gut microbiota and the immune system in type 1 diabetes models

Estela Rosell-Mases et al. Nat Commun. .

Abstract

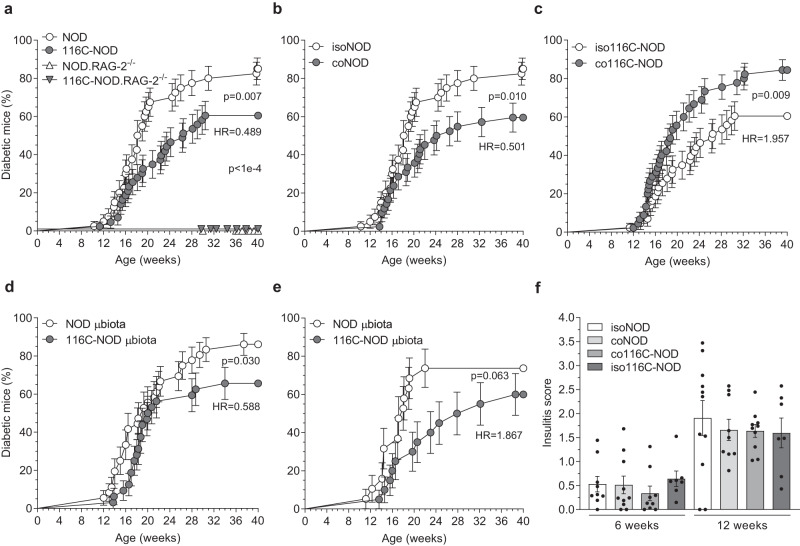
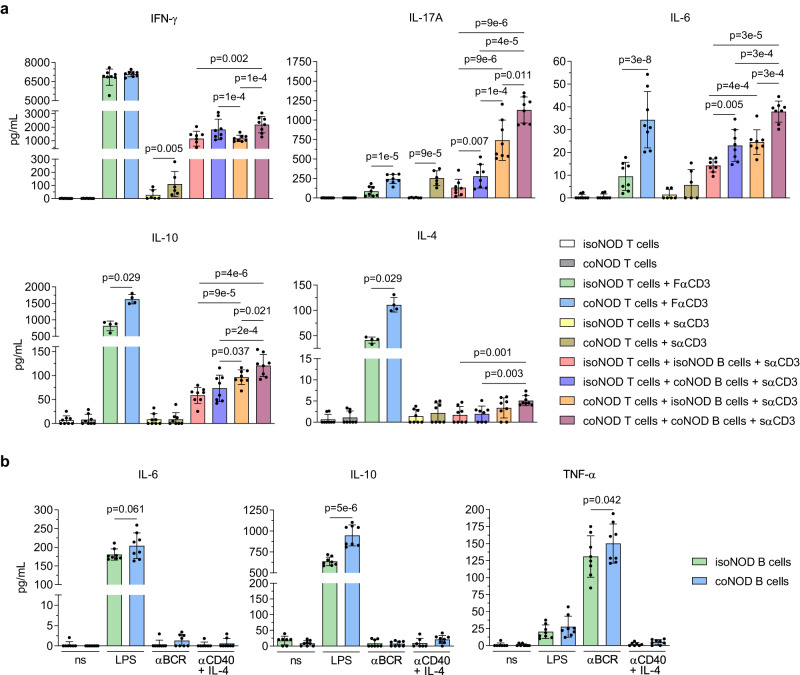
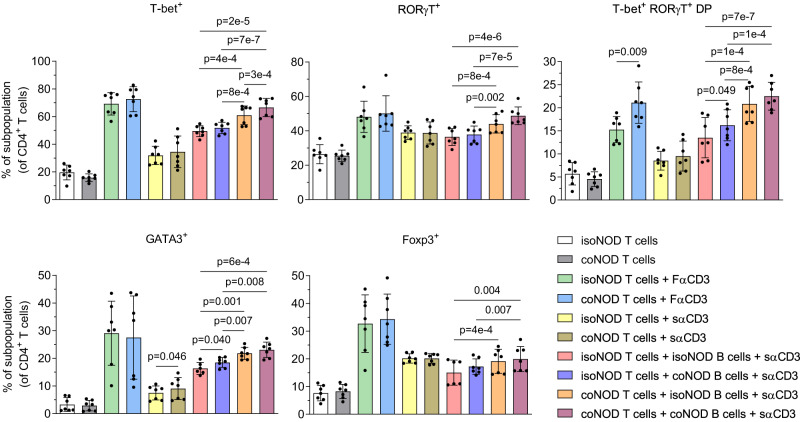
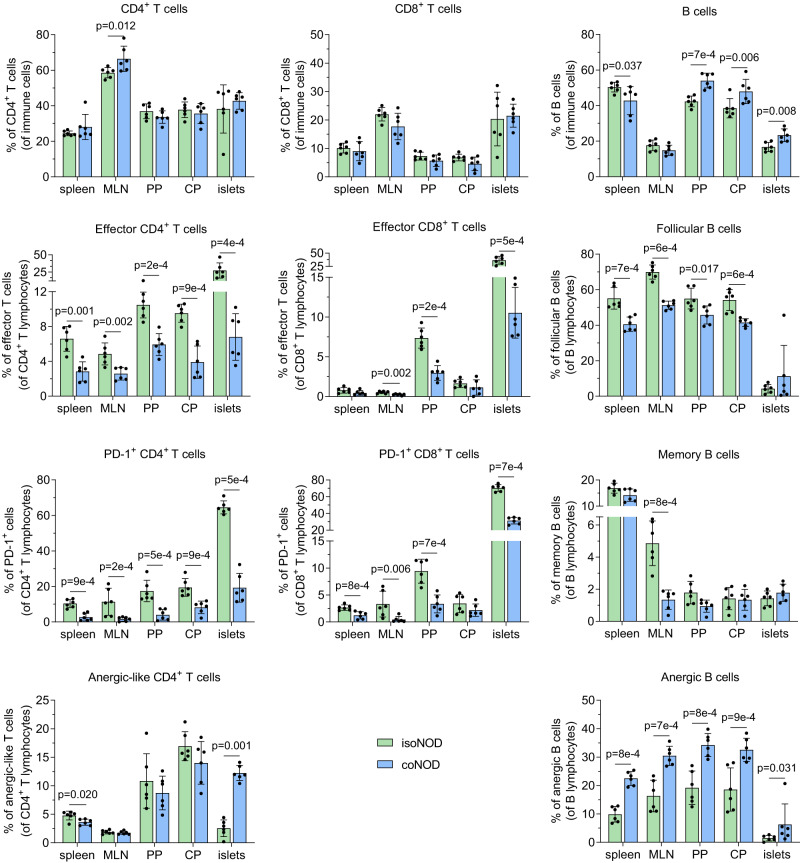
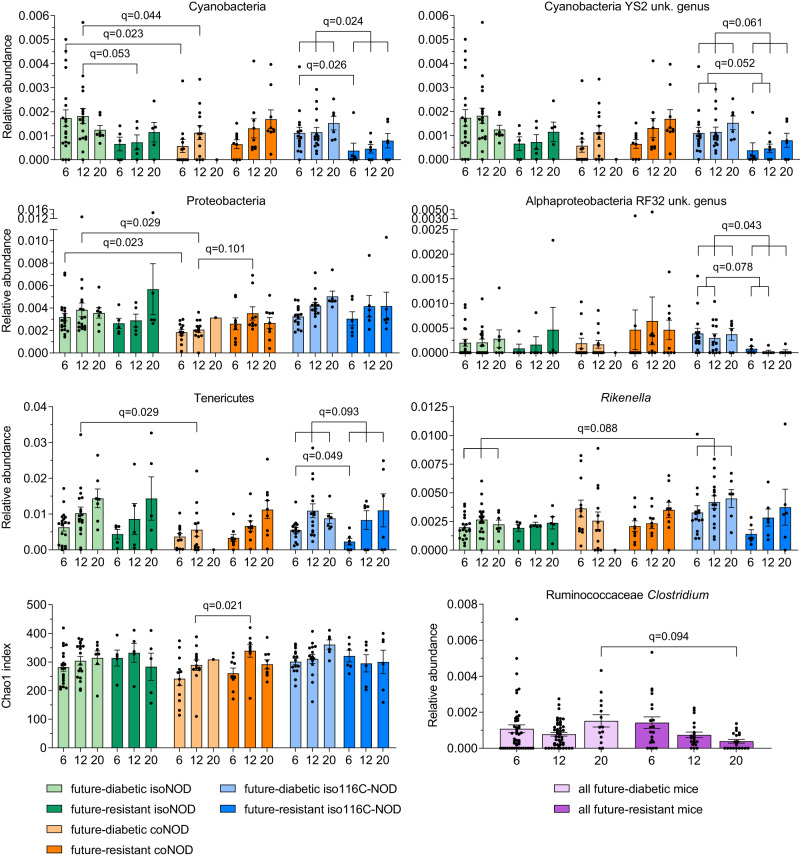
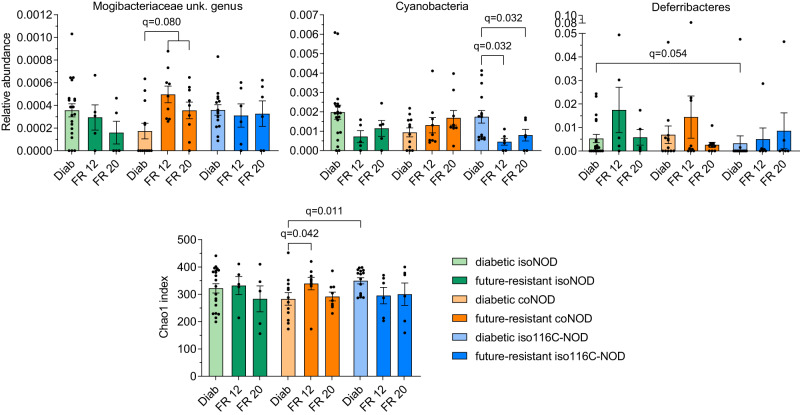
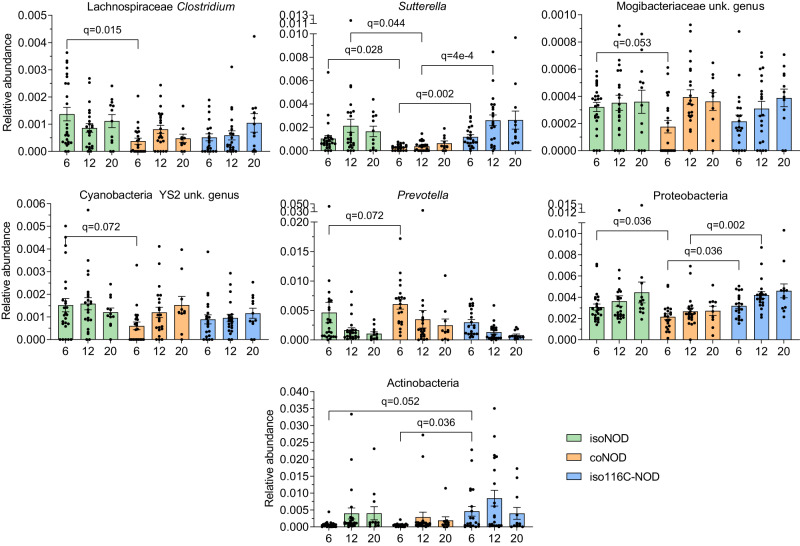
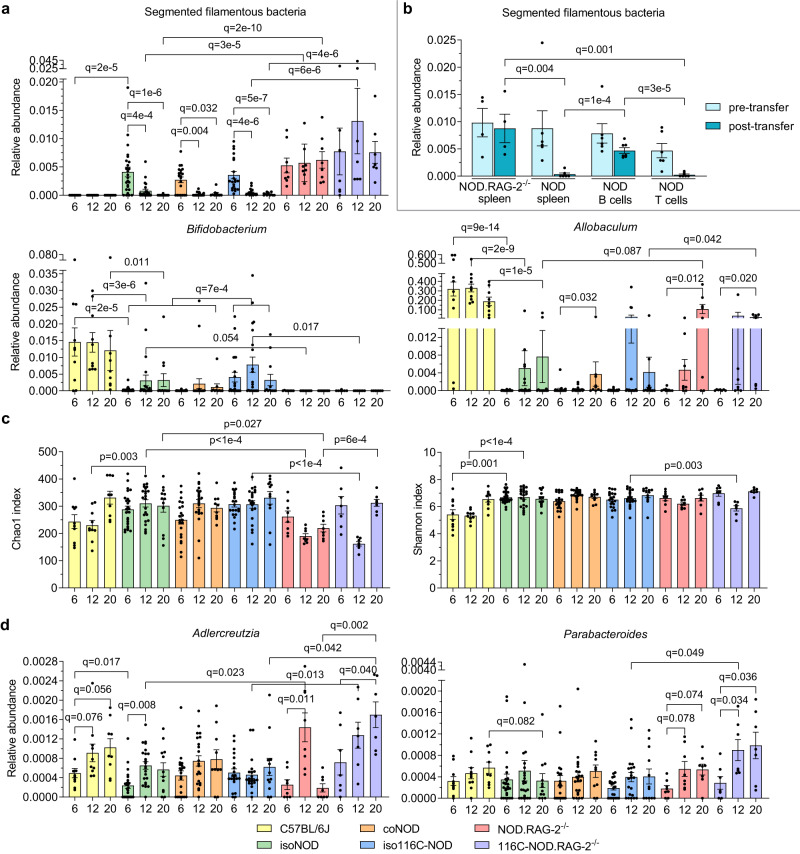
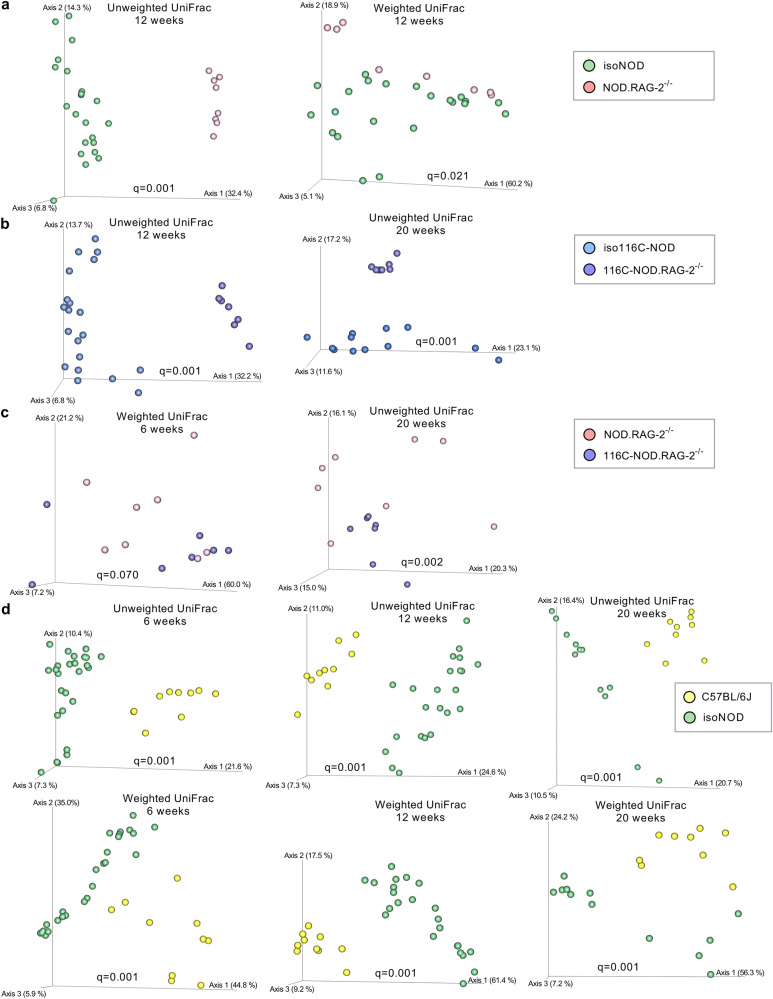
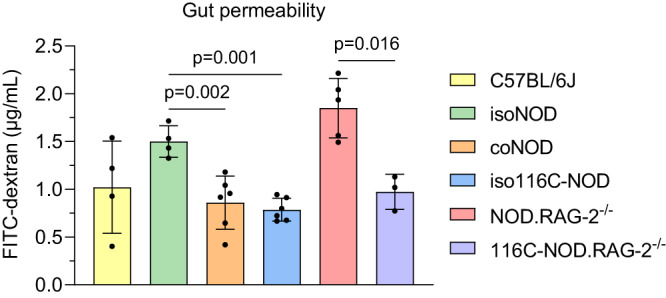
The transgenic 116C-NOD mouse strain exhibits a prevalent Th17 phenotype, and reduced type 1 diabetes (T1D) compared to non-obese diabetic (NOD) mice. A cohousing experiment between both models revealed lower T1D incidence in NOD mice cohoused with 116C-NOD, associated with gut microbiota changes, reduced intestinal permeability, shifts in T and B cell subsets, and a transition from Th1 to Th17 responses. Distinct gut bacterial signatures were linked to T1D in each group. Using a RAG-2-/- genetic background, we found that T cell alterations promoted segmented filamentous bacteria proliferation in young NOD and 116C-NOD, as well as in immunodeficient NOD.RAG-2-/- and 116C-NOD.RAG-2-/- mice across all ages. Bifidobacterium colonization depended on lymphocytes and thrived in a non-diabetogenic environment. Additionally, 116C-NOD B cells in 116C-NOD.RAG-2-/- mice enriched the gut microbiota in Adlercreutzia and reduced intestinal permeability. Collectively, these results indicate reciprocal modulation between gut microbiota and the immune system in rodent T1D models.


Conflict of interest statement

The authors declare no competing interests.

Figures

Fig. 1
Fig. 1. T1D monitoring of NOD and 116C-NOD mouse models under natural transfer of gut microbiota.
a Diabetes incidence of NOD (n = 40), 116C-NOD (n = 43), NOD.RAG-2−/− (n = 17) and 116C-NOD.RAG-2−/− (n = 23) mice. The four models were housed separately. b Diabetes incidence of NOD mice isolated (isoNOD) (n = 40) and cohoused (coNOD) (n = 42) with their 116C-NOD littermates. c Diabetes incidence of 116C-NOD mice isolated (iso116C-NOD) (n = 43) and cohoused (co116C-NOD) (n = 45) with their NOD littermates. d Diabetes incidence of NOD mice recipients of microbiota from NOD (NOD µbiota) (n = 36) and 116C-NOD (116C-NOD µbiota) (n = 32). e Diabetes incidence of 116C-NOD mice recipients of microbiota from NOD (NOD µbiota) (n = 19) and 116C-NOD (116C-NOD µbiota) (n = 20). Microbiota recipients were housed in cages previously occupied by NOD or 116C-NOD mice. Cage change was performed thrice a week. Diabetes incidence curves are expressed as mean ± SE and analysed with the Log-rank (Mantel-Cox) test. Two-tailed p-values were obtained for (a), (b), and (c) data, as well as one-tailed p-values were considered for (d) and (e) data. Hazard ratios (HR) of 116C-NOD/NOD in (a), coNOD/isoNOD in (b), co116C-NOD/iso116C-NOD in (c), 116C-NOD µbiota/NOD µbiota in (d) and NOD µbiota/116C-NOD µbiota in (e) were analysed with Mantel-Haenszel test’s. f Insulitis score of isolated NOD (isoNOD) (6 weeks: n = 9, 12 weeks: n = 11), cohoused (coNOD) (6 weeks: n = 10, 12 weeks: n = 9), cohoused 116C-NOD (co116C-NOD) (6 weeks: n = 9, 12 weeks: n = 10), and isolated 116C-NOD (iso116C-NOD) (6 weeks: n = 7, 12 weeks: n = 7). Insulitis data are expressed as mean ± SE and analysed with Mann–Whitney’s test (one-sided, no significant differences were found).
Fig. 2
Fig. 2. In vitro cytokine secretion analysis of T and B lymphocytes from NOD mice isolated and cohoused with 116C-NOD mice.
a T cells from NOD mice isolated (isoNOD T cells) and cohoused (coNOD T cells) were cultured in vitro under different conditions: alone (isoNOD and coNOD: n = 8), with well-coated or fixed anti-CD3 (FαCD3) (isoNOD and coNOD: n = 8 for IFN-γ, IL-17A, and IL-6; n = 4 for IL-10 and IL-4), in the presence of soluble anti-CD3 (sαCD3) (isoNOD and coNOD: n = 6 for IFN-γ, IL-17A, and IL-6; n = 8 for IL-10 and IL-4), and co-cultured with B cells from NOD mice isolated (isoNOD B cells) and cohoused (coNOD B cells), in their four possible combinations, plus sαCD3: isoNOD T cells + isoNOD B cells (n = 8 for all cytokines), isoNOD T cells + coNOD B cells (n = 8 for all cytokines), coNOD T cells + isoNOD B cells (n = 8 for all cytokines), and coNOD T cells + coNOD B cells (n = 8 for all cytokines). b B cells from NOD mice isolated (isoNOD B cells) and cohoused (coNOD B cells) were cultured under different conditions: without stimulus (ns) (isoNOD: n = 7, coNOD: n = 8), with lipopolysaccharide (LPS) (isoNOD and coNOD: n = 8), with anti-B cell receptor (αBCR) (isoNOD and coNOD: n = 8), and with anti-CD40 (αCD40) plus IL-4 (isoNOD: n = 7, coNOD: n = 8). Two independent experiments were conducted (both shown). Data are expressed as mean ± SD and analysed with two-way ANOVA test (two-sided) on rank-transformed data-values.
Fig. 3
Fig. 3. Expression of the major Th transcription factors by in vitro cultured CD4+ T lymphocytes from NOD mice isolated and cohoused with 116C-NOD mice.
Expression of the transcription factors T-bet, RORγT, GATA3, and Foxp3 in T cells from NOD mice isolated (isoNOD T cells) and cohoused (coNOD T cells) cultured in vitro under the stimuli previously described in Fig. 2 (n = 7 for isoNOD and coNOD T cells in each culture condition). DP = double positive population for the markers in question and negative for the rest of the markers. Two independent experiments were performed (both depicted). Data are expressed as mean ± SD and analysed with two-way ANOVA test (two-sided) on rank-transformed data-values.
Fig. 4
Fig. 4. T and B cell subsets of secondary lymphoid organs and pancreatic islet infiltrate from NOD mice isolated and cohoused with 116C-NOD mice.
Direct ex vivo immunophenotyping of lymphocyte subpopulations within spleen, mesenteric lymph nodes (MLN), Peyer’s patches (PP), caecal patch (CP), and pancreatic islet infiltrate (islets), in NOD mice isolated (isoNOD) and cohoused (coNOD) (n = 6 for each organ and group of mice). The CD4+ and CD8+ T cell subsets included: effector T cells (CD44high CD62L CD69+ CD25+), exhausted-like T cells (PD-1(CD279)+) and anergic-like T cells (Foxp3 CD73high FR4high). The CD19+ B220+ B cell subsets comprised: follicular B cells (CD93 CD21low IgM+ IgDhigh CD23+), memory B cells (CD38high CD138 GL-7), and anergic B cells (CD93- CD21low IgM IgDhigh). Two independent experiments were conducted (both represented). Data are expressed as mean ± SD and analysed with two-way ANOVA test (two-sided) on rank-transformed data-values.
Fig. 5
Fig. 5. Relative abundance of gut microbiota significant taxa and richness from future-diabetic and future-resistant T1D-prone mice.
16S rRNA gene sequencing was conducted in faecal samples at 6, 12, and 20 weeks of age of isolated NOD (isoNOD), cohoused NOD (coNOD), and isolated 116C-NOD (iso116C-NOD). Animals were divided into two subgroups: future diabetics and future-resistant mice, which were compared within the same T1D-prone group and also amongst the three T1D-prone groups. Sample sizes: future-diabetic isoNOD (6 weeks: n = 20, 12 weeks: n = 18, 20 weeks n = 7); future-resistant isoNOD (6 weeks: n = 5, 12 weeks: n = 5, 20 weeks: n = 5); future-diabetic coNOD (6 weeks: n = 12, 12 weeks: n = 13, 20 weeks: n = 1); future-resistant coNOD (6 weeks: n = 9, 12 weeks: n = 9, 20 weeks: n = 9); future-diabetic iso116C-NOD (6 weeks: n = 15, 12 weeks: n = 15, 20 weeks: n = 6); future-resistant iso116C-NOD (6 weeks: n = 6, 12 weeks: n = 6, 20 weeks: n = 6). Data are expressed as mean ± SE. Relative abundance data were analysed using the MaAsLin2 statistical framework (mixed-effects linear regression model, two-sided test, adjustment for multiple comparisons), where p-values were corrected using the false discovery rate (FDR). Chao1 index was analysed with Mann–Whitney’s test (two-tailed p-values).
Fig. 6
Fig. 6. Relative abundance and richness of gut microbiota significant taxa from diabetic and future-resistant mice.
16S rRNA gene analysis was performed in faecal samples from diabetics (Diab) and future-resistant mice at 12 weeks (FR 12) and 20 weeks (FR 20) of isolated NOD (isoNOD), cohoused NOD (coNOD), and isolated 116C-NOD (iso116C-NOD) groups. Sample sizes: Diab isoNOD (n = 20); FR 12 isoNOD (n = 5); FR 20 isoNOD (n = 5); Diab coNOD (n = 12); FR 12 coNOD (n = 9); FR 20 coNOD (n = 9); Diab iso116C-NOD (n = 15); FR 12 iso116C-NOD (n = 6); FR 20 iso116C-NOD (n = 6). Data are expressed as mean ± SE. Relative abundance data were analysed using the MaAsLin2 statistical framework (mixed-effects linear regression model, two-sided test, adjustment for multiple comparisons), where p-values were corrected using the false discovery rate (FDR). Chao1 index was analysed with Mann-Whitney’s test (two-tailed p-values).
Fig. 7
Fig. 7. Relative abundance of gut microbiota significant taxa from non-diabetic mice of the T1D-prone models.
16S rRNA gene sequencing was conducted in faecal samples at 6, 12, and 20 weeks of age from non-diabetic isolated NOD (isoNOD), cohoused NOD (coNOD), and isolated 116C-NOD (iso116C-NOD) mice. Sample sizes: isoNOD (6 weeks: n = 25, 12 weeks: n = 23, 20 weeks: n = 12); coNOD (6 weeks: n = 21, 12 weeks: n = 22, 20 weeks: n = 10); iso116C-NOD (6 weeks: n = 21, 12 weeks: n = 21, 20 weeks: n = 12). Data are expressed as mean ± SE. Relative abundance data were analysed using the MaAsLin2 statistical framework (mixed-effects linear regression model, two-sided test, adjustment for multiple comparisons), where p-values were corrected using the false discovery rate (FDR).
Fig. 8
Fig. 8. Relative abundance and α-diversity of gut microbiota significant taxa from immunocompetent and immunodeficient mouse models.
16S rRNA gene analysis was performed in faecal samples at 6, 12, and 20 weeks of age of different mouse strains: control C57BL/6J (6 weeks: n = 10, 12 weeks: n = 10, 20 weeks: n = 9), isolated NOD or isoNOD (6 weeks: n = 25, 12 weeks: n = 23, 20 weeks: n = 12), cohoused NOD or coNOD (6 weeks: n = 21, 12 weeks: n = 22, 20 weeks: n = 10), isolated 116C-NOD or iso116C-NOD (6 weeks: n = 21, 12 weeks: n = 21, 20 weeks: n = 12), NOD.RAG-2−/− (6 weeks: n = 8, 12 weeks: n = 8, 20 weeks: n = 8), and 116C-NOD.RAG-2−/− (6 weeks: n = 7, 12 weeks: n = 7, 20 weeks: n = 7). a Relative abundance of significant taxa altered by the autoimmune diabetes lymphocyte milieu. b Relative abundance of segmented filamentous bacteria before (pre-transfer, 6 weeks) and after the transfer (post-transfer, 12 weeks) of total NOD spleen (n = 6), NOD B cells (n = 7), NOD T cells (n = 7), and control NOD.Rag2−/− spleen (n = 4). c α-diversity based on Chao1 and Shannon indexes. d Relative abundance of bacteria affected by 116C-NOD B cells. a, c, and d share the same legend. Data are expressed as mean ± SE. Relative abundance data were analysed using the MaAsLin2 statistical framework (mixed-effects linear regression model, two-sided test, adjustment for multiple comparisons), where p-values were corrected using the false discovery rate (FDR). Chao1 and Shannon indexes were analysed with Mann–Whitney’s test (two-tailed p-values).
Fig. 9
Fig. 9. β-diversity of gut microbiota from immunocompetent and immunodeficient mouse models.
a Unweighted and weighted UniFrac distances at 12 weeks of isolated NOD (isoNOD) (n = 23) and NOD.RAG-2−/− (n = 8). b Unweighted UniFrac distances at 12 and 20 weeks of isolated 116C-NOD (iso116C-NOD) (n = 21 and n = 12, respectively) and 116C-NOD.RAG-2−/− (n = 7). c Weighted and unweighted UniFrac distances at 6 and 20 weeks of NOD.RAG-2−/− (n = 7) and 116C-NOD.RAG-2−/− (n = 8). d Unweighted and weighted UniFrac distances at 6, 12, and 20 weeks of C57BL/6 (n = 10) and isolated NOD (isoNOD) (n = 25, n = 23, and n = 12, respectively). Statistics were performed using the PERMANOVA test (two-sided), where p-values were corrected using the false discovery rate (FDR).
Fig. 10
Fig. 10. Intestinal permeability of immunocompetent and immunodeficient mouse models.
In vivo FITC-dextran 4 kDa (FD4) gut permeability assay of the animal models at 12 weeks of age: control C57BL/6J (n = 4), isolated NOD or isoNOD (n = 4), cohoused NOD or coNOD (n = 6), isolated 116C-NOD or iso116C-NOD (n = 6), NOD.RAG-2−/− (n = 5), and 116C-NOD.RAG-2−/− (n = 3). FD4 was analysed in plasma samples. Two independent experiments were performed (both shown). Data are expressed as mean ± SD and analysed with two-way ANOVA test (two-sided) on rank-transformed data values.

References

    1. Ilonen J, Lempainen J, Veijola R. The heterogeneous pathogenesis of type 1 diabetes mellitus. Nat. Rev. Endocrinol. 2019;15:635–650. doi: 10.1038/s41574-019-0254-y. - DOI - PubMed
    1. Willcox A, Richardson SJ, Bone AJ, Foulis AK, Morgan NG. Analysis of islet inflammation in human type 1 diabetes. Clin. Exp. Immunol. 2009;155:173–181. doi: 10.1111/j.1365-2249.2008.03860.x. - DOI - PMC - PubMed
    1. Makino S, et al. Breeding of a non-obese, diabetic strain of mice. Jikken Dobutsu. 1980;29:1–13. - PubMed
    1. Fallahi, P. et al. Th1 chemokines in autoimmune endocrine disorders. J. Clin. Endocrinol. Metab.105, 1046–1060 (2020). - PubMed
    1. Katz JD, Benoist C, Mathis D. T helper cell subsets in insulin-dependent diabetes. Science. 1995;268:1185–1188. doi: 10.1126/science.7761837. - DOI - PubMed

Publication types

Associated data