. 2023 Nov 27;14(1):7772.
doi: 10.1038/s41467-023-43533-3.

RNA is a key component of extracellular DNA networks in Pseudomonas aeruginosa biofilms

Affiliations

RNA is a key component of extracellular DNA networks in Pseudomonas aeruginosa biofilms

Sudarsan Mugunthan et al. Nat Commun. .

Abstract

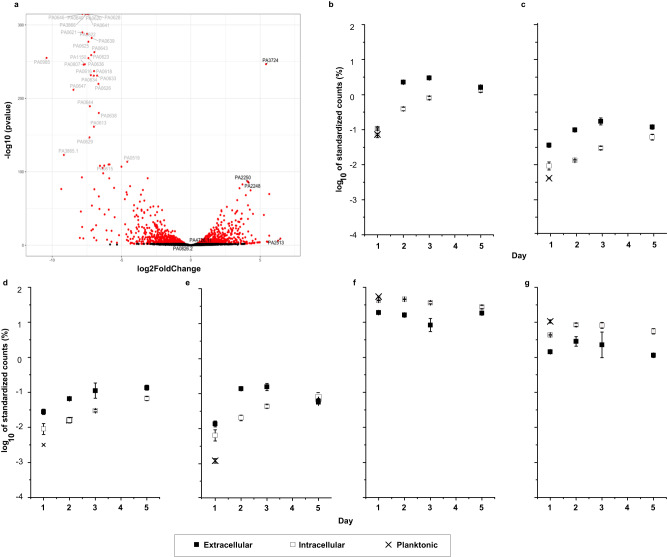
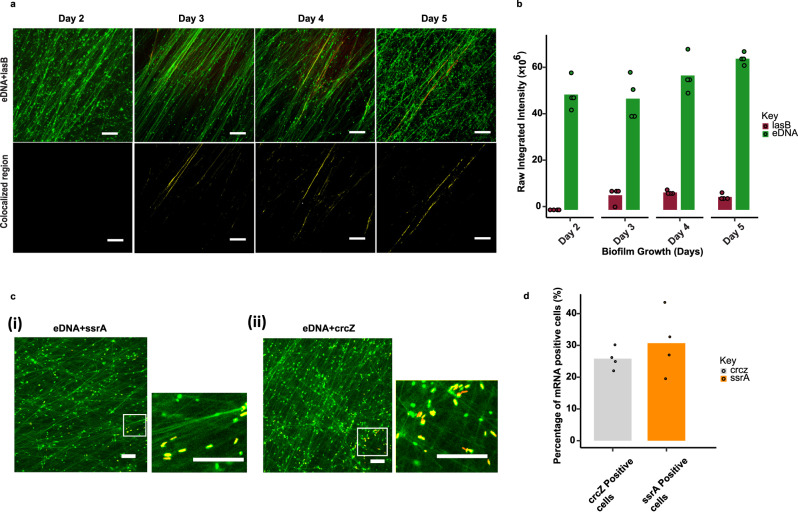
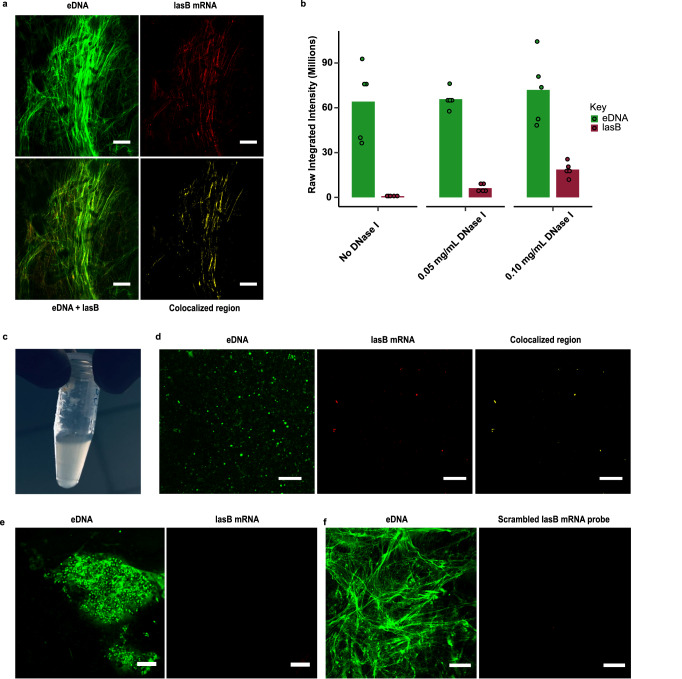
The extracellular matrix of bacterial biofilms consists of diverse components including polysaccharides, proteins and DNA. Extracellular RNA (eRNA) can also be present, contributing to the structural integrity of biofilms. However, technical difficulties related to the low stability of RNA make it difficult to understand the precise roles of eRNA in biofilms. Here, we show that eRNA associates with extracellular DNA (eDNA) to form matrix fibres in Pseudomonas aeruginosa biofilms, and the eRNA is enriched in certain bacterial RNA transcripts. Degradation of eRNA associated with eDNA led to a loss of eDNA fibres and biofilm viscoelasticity. Compared with planktonic and biofilm cells, the biofilm matrix was enriched in specific mRNA transcripts, including lasB (encoding elastase). The mRNA transcripts colocalised with eDNA fibres in the biofilm matrix, as shown by single molecule inexpensive FISH microscopy (smiFISH). The lasB mRNA was also observed in eDNA fibres in a clinical sputum sample positive for P. aeruginosa. Thus, our results indicate that the interaction of specific mRNAs with eDNA facilitates the formation of viscoelastic networks in the matrix of Pseudomonas aeruginosa biofilms.


Conflict of interest statement

The authors declare no competing interests.

Figures

Fig. 1
Fig. 1. Hydrolysis of RNA and not DNA results in loss of eDNA fibres and P. aeruginosa biofilm dissolution.
Nuclear magnetic resonance (NMR) of extracted nucleic acid (NA) gel isolate and confocal laser scanning microscopy of Pseudomonas aeruginosa biofilms. a NMR 1H-13C heteronuclear single quantum (HSQC)-total correlation spectroscopy (TOCSY) spectrum of extracellular nucleic acid (NA) gel isolate dissolved in 0.1 M NaOD, (10 mg ml−1) at 25 °C showing the C1’-H1’ cross peaks of RNA (blue ovals) and DNA (red rectangles) and their correlations to the neighbouring carbon C2’-H1’. Molecule structures (right) illustrate correlations. b 1-D 31P NMR of NA isolate gel and crude P. aeruginosa biofilm with proton decoupling showing the presence of monoesterified (i.e., monoribonucleotides) and diesterified (i.e., DNA) phosphate peaks (i), and 2-D 1H-31P heteronuclear correlation (HETCOR) spectrum of extracellular NA showing the 31P-1H cross-peaks of monoribonucleotides and DNA (ii). Coupling of monoesterified phosphates to H2’ or H3’ of eight monoesterified monoribonucleotides (from left to right: 3’ AMP/3’ GMP, 3’ CMP/3’ UMP, 2’ CMP/2’ UMP, 2’ AMP, 2’ GMP); and diesterified phosphate to DNA H3’ and H5’/H5” protons, are denoted by the dashed lines. There is a discontinuity (vertical wavy line) in the 31P axis due to the different thresholds required to illustrate the 31P-1H correlations in the monoesterified and diesterified regions. All samples were prepared in 0.1 M NaOD, (10 mg ml−1) at 25 °C. c Confocal micrographs of five-day P. aeruginosa biofilms at pH 7 and d following alkaline transesterification (37 °C for 16 h; n = 3), stained with TOTO-1 showing eDNA fibres (green). Scale bars represent 10 µm. e Rheogram of five-day Pseudomonas aeruginosa PAO1 wildtype biofilm and alkalinised wildtype biofilm (0.3 M KOH at 37oC for 16 h; n = 3) in frequency sweep at 25 °C, 0.026 mm gap, 0.3 amplitude. A tan δ > 1 represents fluid behaviour, while tan δ < 1 indicates gel behaviour. For e, the biological triplicates are averaged for both conditions and plotted against frequency. Relevant source data for Fig. 1e is provided as a source data file.
Fig. 2
Fig. 2. The abundance of specific mRNA transcripts increases in the extracellular matrix of P. aeruginosa biofilms relative to planktonic cells.
Extracellular mRNA transcripts identified through RNA analysis of five-day P. aeruginosa biofilms. a Volcano plot of total RNA sequenced from the biofilm matrix of five-day P. aeruginosa biofilms and planktonic P. aeruginosa cells (16 h). mRNA transcripts that are highly abundant in planktonic cells compared to the biofilm matrix are highlighted in grey in the left part of the image with a negative log 2-fold change. mRNA transcripts with a positive log 2-fold change and higher negative log10 p-value such as PA3724 (lasB), PA2250 (IpdV), PA2248 (bkDA-2) and PA2513 (antB), are more abundant in the extracellular biofilm matrix and are highlighted in bold in the right-hand part of the image. A higher negative log 10 p-value indicates a higher probability of the presence of that particular mRNA transcript in either planktonic cells or in the biofilm matrix of P. aeruginosa. bg Standardised gene counts (%) of highly abundant mRNA transcripts (b) lasB, (c) bkDA-2, (d) IpDV, (e) antB, (f) ssrA and (g) crcZ in extracellular biofilm matrix and intracellular biofilm cells across different days of biofilm growth (days 1-5). All extractions and sequencing were performed in biological triplicates. The standard deviation bars indicated in Fig. 2b–g are generated based on the mean values calculated from biological triplicates. The negative binomial model was fitted to estimate size factors and dispersion. Significance was determined using DeSeq2 to identify differentially expressed genes which incorporates two two-tailed Wald test with a P < 0.01. Relevant source data for Fig. 2a–g have been deposited to public repository and can be found in the data availability section.
Fig. 3
Fig. 3. mRNA is detected in eDNA fibres upon mild DNase I pretreatment.
Extracellular lasB mRNA visualisation using the smiFISH method. smiFISH confocal micrographs of five-day P. aeruginosa biofilms showing lasB mRNA smiFISH probes (red), eDNA specific TOTO-1 (green), merged image i.e (red + green) and colocalised region (yellow): a without DNase I treatment showing no affinity of lasB probe for lasB mRNA in the eDNA fibre, b treated with 0.02 mg ml−1 DNase I indicating weak dispersed lasB RNA signal on the eDNA fibre, and c treated with 0.05 mg ml−1 and d 0.1 mg ml−1 of DNase I respectively showing increased lasB RNA signal intensity (yellow; c and d colocalised region panel). Scale bars represent 10 µm. e Three-dimensional (3-D) confocal micrograph of five-day P. aeruginosa biofilm (Z-stack = 5 µm) showing overall spatial distribution of lasB mRNA (red) and their colocalisation (yellow) with TOTO-1 stained eDNA fibre (green) (n = 4). Scale bars represent 10 µm. f Fluorescence intensity quantification (n = 4) of eDNA (green bars) and lasB mRNA (red bars) expression in five-day P. aeruginosa biofilms treated with 0, 0.02, 0.05 and 0.1 mg ml−1 DNase I. g Colocalisation analysis (n = 4) showing Mander’s coefficients for eDNA and lasB mRNA colocalisation in five-day P. aeruginosa PAO1 wildtype biofilms at 0, 0.02, 0.05 and 0.1 mg ml−1 DNase I. h Confocal micrograph of DNase I pre-treated (0.1 mg ml−1) five-day P. aeruginosa biofilms performed using smiFISH probes specific for IpdV (27 primary probes), antB (13 primary probes), and bkDA-2 (8 primary probes) mRNA (red), which colocalise with TOTO-1 (green) stained eDNA fibres (reddish yellow streaks in top panel of merged images). Mander’s coefficients for Ipdv, antB, and bkDA-2 of 16 ± 5%, 11 ± 3%, and 18 ± 6%, respectively (n = 5 images each), were determined based on the overlap of the mRNA signal with TOTO−1 stained (green) eDNA fibres (colocalised region panel at bottom; yellow). Scale bars represent 10 µm. i smiFISH confocal micrograph fluorescence intensity quantification (n = 5) of eDNA (green bars) and highly enriched extracellular mRNA bkDA-2, IpDV and antB (red bars) in five-day P. aeruginosa biofilms. The standard deviation bars indicated in Fig. 3f, g, i are generated based on the mean values calculated from biological triplicates. Relevant source data for Fig. 3f, g and i are provided as a source data file.
Fig. 4
Fig. 4. lasB not required for eDNA fibres, and abundant iRNA are not seen in eDNA fibres.
a smiFISH confocal micrograph of DNase I pre-treated (0.1 mg ml−1) P. aeruginosa biofilms stained with lasB mRNA smiFISH probes (red) after two, three, four, and five days of growth. eDNA fibre was visualised with TOTO−1 (green) and colocalised region (yellow). Mander’s coefficients for days 1, 2, 3, 4, and 5 biofilms were zero, zero, 14 ± 2%, 22 ± 4%, and 24 ± 8% respectively (n = 5 images each) based on the overlap of the mRNA signal with TOTO−1 stained (green) eDNA fibres (colocalised region panels; yellow). b smiFISH confocal micrograph fluorescence intensity quantification (n = 4) of extracellular DNA and lasB mRNA expression across different days (days 2 to 5). Green bars represent eDNA and red bars represent lasB mRNA. c Confocal micrograph of DNase I (0.1 mg ml−1) pre-treated five-day P. aeruginosa biofilms (n = 4) stained with 10 and six smiFISH primary probes specific for transfer messenger RNA (i) (tmRNA) ssrA and (ii) crcZ respectively showing 25% of cells with crcZ and 30% with ssrA. Cells staining positive for ssrA and crcZ RNA are seen in yellow (Fig. 4c(i),(ii) ROI, respectively). ROI indicates zoom-in of region of interest shown in small white square boxes. d smiFISH confocal micrograph fluorescence intensity quantification (n = 4) of crcZ (25 %) and ssrA (30%) positive cells in five-day P. aeruginosa biofilms using maxima function in ImageJ Fiji software. Scale bars represent 10 µm. The standard deviation bars indicated in 4b and d are generated based on the mean values calculated from biological triplicates. Relevant source data for Fig. 4b, d are provided as a source data file.
Fig. 5
Fig. 5. lasB mRNA is also present in eDNA fibres of human clinical sputum sample.
smiFISH performed on clinical sputum samples highly enriched with P. aeruginosa. a Confocal micrograph of 0.1 mg ml−1 DNaseI pretreated human clinical sputum sample HP0005 highly enriched in P. aeruginosa showing eDNA fibres (TOTO−1 stain; green), lasB mRNA (lasB mRNA specific smiFISH probe; red streaks), merged image of lasB mRNA and eDNA fibres and colocalised region of eDNA fibres with lasB mRNA (yellow). A Mander’s coefficient of 56.72 % (n = 8 images) was determined for the clinical sample based on the overlap of the lasB mRNA signal with TOTO−1 stained (green) eDNA fibres (colocalised region panel; yellow). Scale bars represent 10 µm. b Fluorescence intensity quantification (n = 4) of extracellular DNA (green bars) and lasB mRNA (red bars) expression in human clinical sputum sample positive for P. aeruginosa biofilms treated with 0, 0.05, and 0.1 mg ml−1 DNase I. c Clinical sputum sample treated with 0.4 mg ml−1 of DNase-I at 37 °C for 1 h showing complete dispersal of sputum and increased solution turbidity d smiFISH confocal micrograph of 0.4 mg ml−1 DNase-I treated human clinical sample at 37 °C for 1 h (n = 3), showing eDNA staining with TOTO−1 dye (green) after DNase treatment and lasB signal as visualised with lasB-specific oligoribonucleotide smFISH probes (red), and colocalisation of eDNA and lasB (yellow). e smiFISH confocal micrograph (n = 4) of clinical sputum sample negative for P. aeruginosa after 0.1 mg ml−1 DNase1 pre-treatment showing dead cells (green) and no lasB oligoribonucleotide smFISH probes signal (red). f smiFISH confocal micrograph (n = 4) of clinical sputum sample positive for P. aeruginosa after 0.1 mg ml−1 DNase1 pre-treatment following staining with scrambled lasB-specific oligoribonucleotide smFISH probe (red), and eDNA specific TOTO−1 stain (green) showing eDNA fibres. The scale bars represent 10 µm. The standard deviation bars indicated in 5b are generated based on the mean values calculated from biological triplicates. Relevant source data for Fig. 5b are provided as a source data file.
Fig. 6
Fig. 6. Enzymatic digestion of eRNA leads to loss of eDNA fibres and loss of biofilm viscoelasticity.
Three-dimensional (3-D) confocal micrographs of five-day eDNA specific TOTO-1-stained P. aeruginosa PAO1 wildtype biofilm (green) a with 0.1 mg ml−1 DNase I pre-treatment and b 0.3 mg ml−1 RNase H treatment, c 0.1 mg ml−1 DNase I pre-treatment followed by subsequent 0.3 mg ml−1 RNase H digestion. The thickness of biofilm is 8 μm. Scale bars represent 10μm. d smiFISH confocal micrograph fluorescence intensity quantification (n = 3) of extracellular DNA fibre reduction (green bars) across different enzymatic treatments such as DNase I (D I), RNase A (R A) and RNase H (R H). e Rheogram of five-day Pseudomonas aeruginosa PAO1 wildtype biofilm (n = 3) pre-treated with 0.1 mg ml−1 DNaseI followed by either RNase A or RNase H treatment in frequency sweep at 25 °C, 0.026 mm gap, 0.3 amplitude showing that DNase I pretreatment followed by 0.3 mg ml−1 of both RNase A or RNase H digestion respectively reduces (i.e., increases tan δ) or removes (tan δ > 1) biofilm elasticity. The standard deviation bars indicated in 6d are generated based on the mean values calculated from biological triplicates. For e, the biological triplicates are averaged for each condition and plotted against frequency. Relevant source data for Fig. 6d, e are provided as a source data file.

References

    1. Whitchurch CB, Tolker-Nielsen T, Ragas PC, Mattick JS. Extracellular DNA required for bacterial biofilm formation. Science. 2002;295:1487. doi: 10.1126/science.295.5559.1487. - DOI - PubMed
    1. Böckelmann U, et al. Bacterial extracellular DNA forming a defined network-like structure. FEMS Microbiol Lett. 2006;262:31–38. doi: 10.1111/j.1574-6968.2006.00361.x. - DOI - PubMed
    1. Pakkulnan R, et al. Extracellular DNA facilitates bacterial adhesion during Burkholderia pseudomallei biofilm formation. PLoS One. 2019;14:e0213288. doi: 10.1371/journal.pone.0213288. - DOI - PMC - PubMed
    1. Sugimoto S, et al. Broad impact of extracellular DNA on biofilm formation by clinically isolated Methicillin-resistant and -sensitive strains of Staphylococcus aureus. Sci. Rep. 2018;8:2254. doi: 10.1038/s41598-018-20485-z. - DOI - PMC - PubMed
    1. Tang L, Schramm A, Neu TR, Revsbech NP, Meyer RL. Extracellular DNA in adhesion and biofilm formation of four environmental isolates: A quantitative study. FEMS Microbiol Ecol. 2013;86:394–403. doi: 10.1111/1574-6941.12168. - DOI - PubMed