. 2023 Nov 27;14(1):7779.
doi: 10.1038/s41467-023-42173-x.

Complex 33-beam simulated galactic cosmic radiation exposure impacts cognitive function and prefrontal cortex neurotransmitter networks in male mice

Affiliations

Complex 33-beam simulated galactic cosmic radiation exposure impacts cognitive function and prefrontal cortex neurotransmitter networks in male mice

Rajeev I Desai et al. Nat Commun. .

Abstract

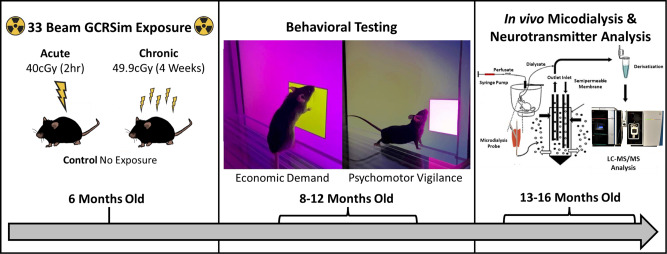
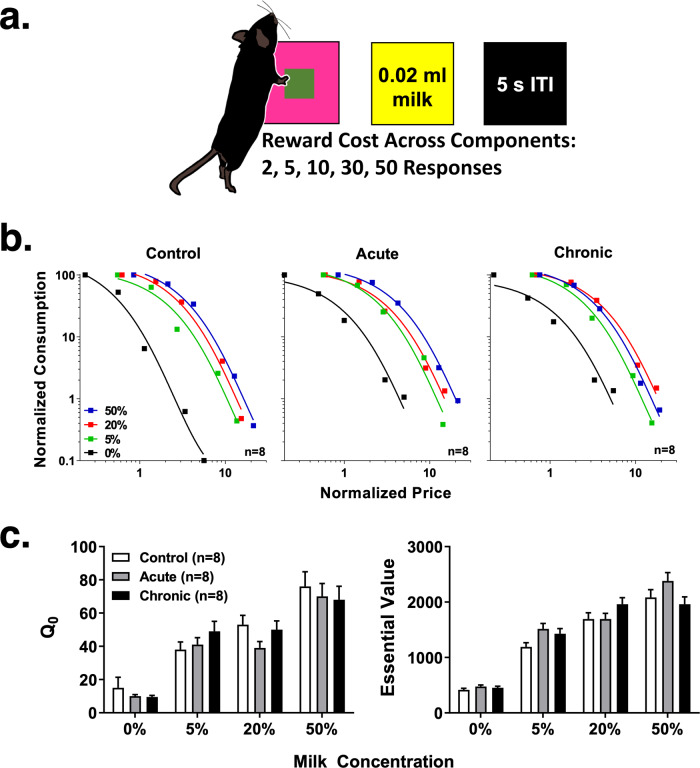
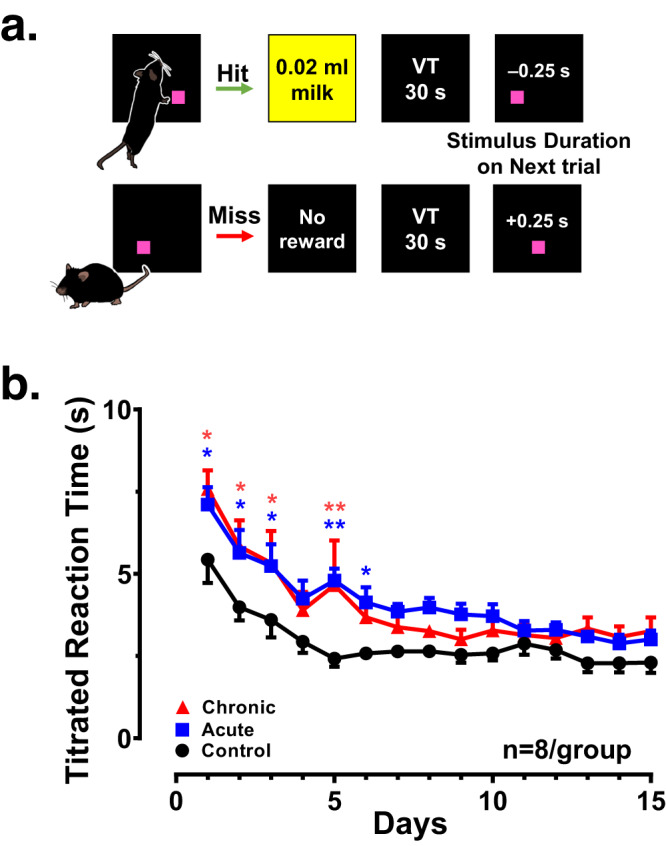
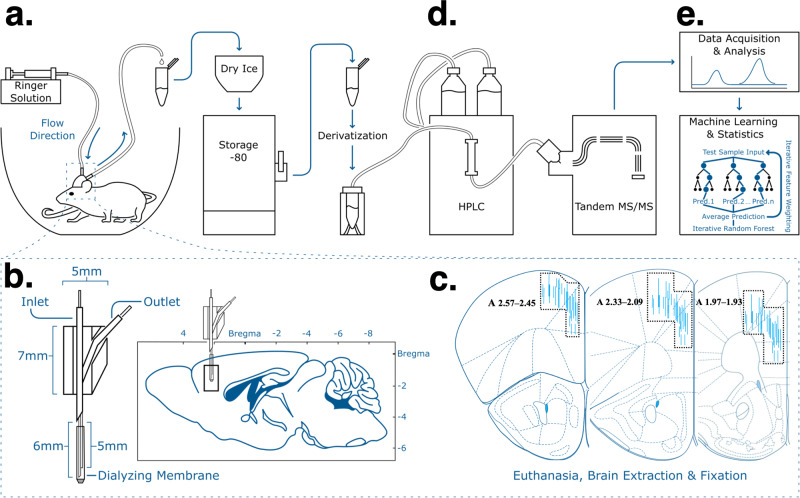
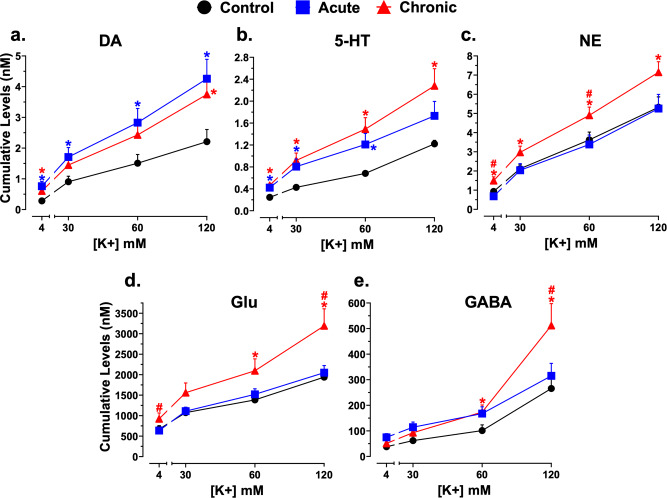
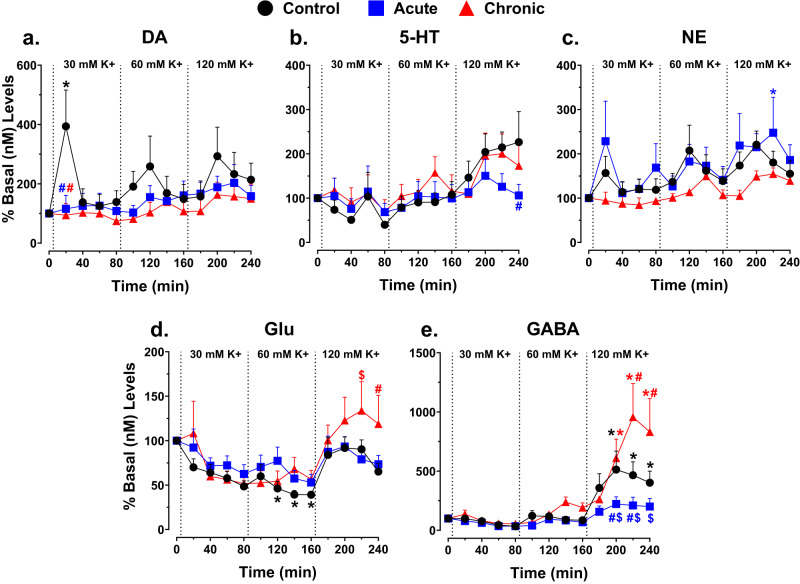
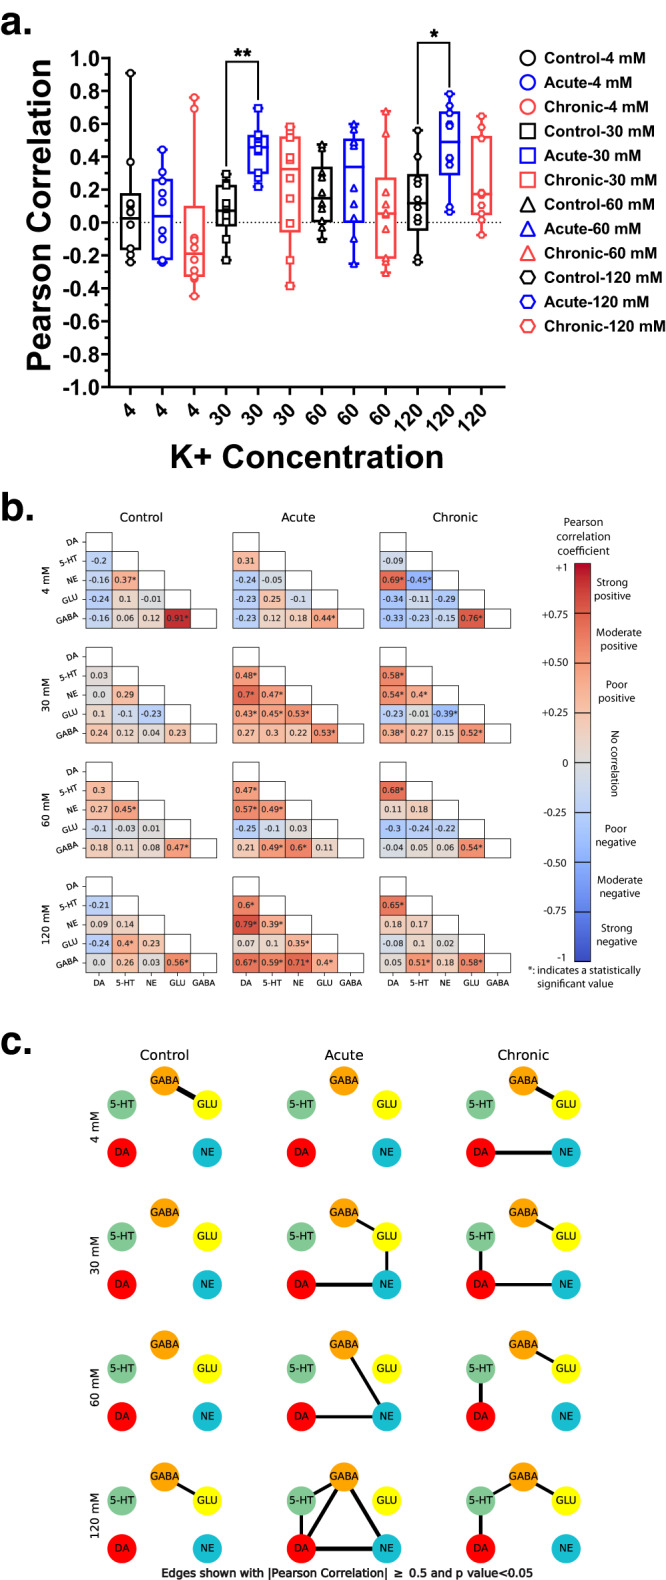
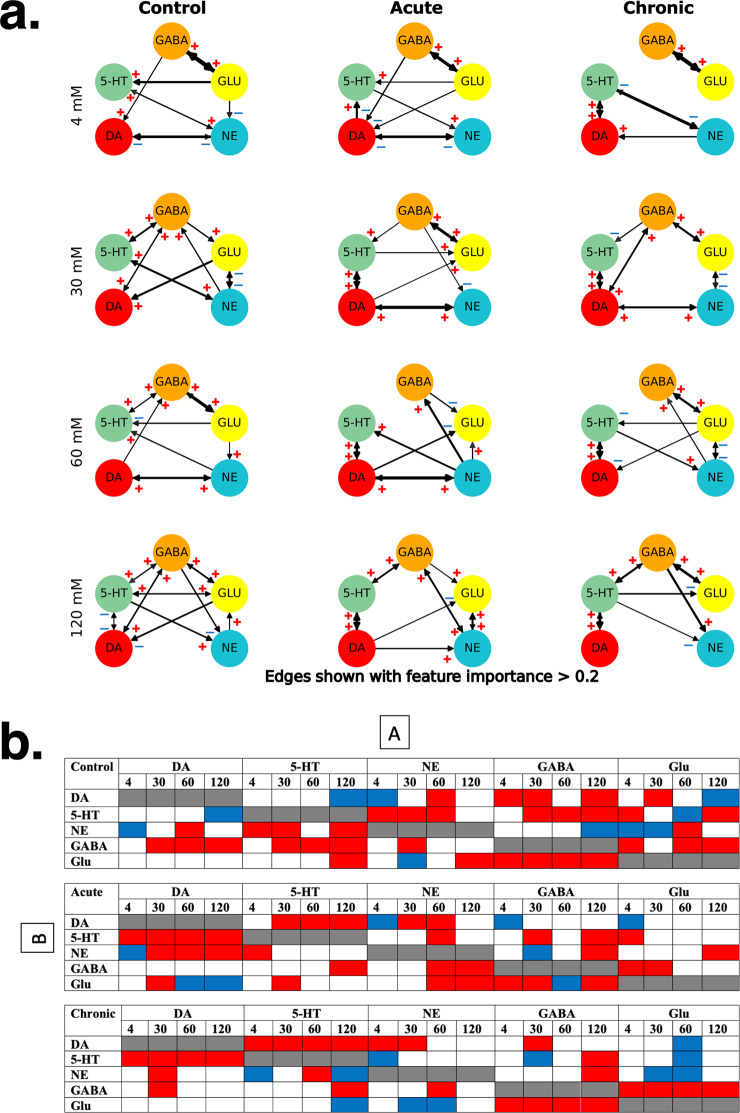
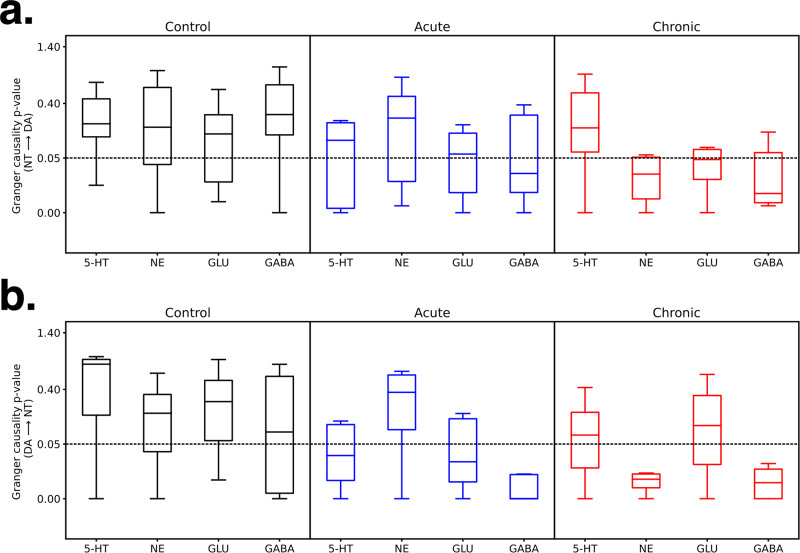
Astronauts will encounter extended exposure to galactic cosmic radiation (GCR) during deep space exploration, which could impair brain function. Here, we report that in male mice, acute or chronic GCR exposure did not modify reward sensitivity but did adversely affect attentional processes and increased reaction times. Potassium (K+)-stimulation in the prefrontal cortex (PFC) elevated dopamine (DA) but abolished temporal DA responsiveness after acute and chronic GCR exposure. Unlike acute GCR, chronic GCR increased levels of all other neurotransmitters, with differences evident between groups after higher K+-stimulation. Correlational and machine learning analysis showed that acute and chronic GCR exposure differentially reorganized the connection strength and causation of DA and other PFC neurotransmitter networks compared to controls which may explain space radiation-induced neurocognitive deficits.


Conflict of interest statement

The authors declare no competing interests.

Figures

Fig. 1
Fig. 1. Timeline of experimental protocols in mice.
All subjects were shipped directly to NASA Space Radiation Laboratory, Brookhaven National Laboratory (Long Island, NY) for exposure to galactic cosmic radiation simulation (GCRSim). Following acute or chronic exposure to GCRSim and post-exposure recovery for 3–5 days, all subjects (including controls) were shipped to McLean Hospital, Harvard Medical School (Belmont, MA). After an 8-week mandatory quarantine period, all subjects were interrogated for changes in neurocognitive performance using touchscreen-based assay and neurotransmitter function using in vivo microdialysis/liquid chromatography mass spectrometry (LC-MS/MS) analysis over a 7-month period.
Fig. 2
Fig. 2. Acute and chronic GCR fail to impact reward sensitivity or motivation in an economic demand task.
a Task schematic. b Normalized demand functions for sweetened condensed milk concentrations for the control (left panel), acute (middle panel), and chronic (right panel) treatment groups (n = 8/group). Normalized consumption is expressed as a percentage of Q0 (demand intensity at price 0) and price is expressed as the number of responses required to produce 1% of Q0. c Q0 (left panel) and essential value (right panel) for the control (white bars), acute (gray bars), and chronic (black bars) treatment groups (± standard error) across sweetened condensed milk concentrations. To evaluate the statistical significance of GCR exposure on economic demand parameters, data were subjected to two-way analysis of variance (ANOVA). ITI intertrial interval.
Fig. 3
Fig. 3. Acute and chronic GCR produce attentional deficits in a psychomotor vigilance task.
a Task Schematic. b Mean (±SEM) titrated reaction times (s) for the control (black data series), acute (blue data series), and chronic (red data series) treatment groups (n = 8/group) across the 15-session condition. A two-way ANOVA followed by a post-hoc Tukey test when appropriate was used. *p < 0.05; **p < 0.01 represents significant difference compared to controls. VT variable time.
Fig. 4
Fig. 4. Flowchart illustration of in vivo microdialysis experimental set-up, design, sample collection, sample analysis, and histology.
Samples were collected from control and GCR exposed mice using custom-designed microdialysis probes as shown in enlargement schematic (a; see online methods for details of probe construction) with the dialysis membrane targeting the PFC as shown in the enlargement schematic (b). A CMA/102 microdialysis syringe pump was used to perfuse the dialysis probes with Ringer solution consisting of different concentrations of K+. Dialysate samples were collected in microcentrifuge tubes placed in dry ice and samples were stored at −80 °C until quantification. c After completion of microdialysis experiments, all subjects were euthanized and brains were removed, fixed, and sectioned. Drawings of the forebrain sections based on Paxinos and Franklin with superimposed rectangles that show the confines within which the microdialysis probe tracks were considered to be in the PFC. Data were only included from subjects with probe tracks within the rectangles and the anterior coordinate (measured from bregma) is located in each section. d Dialysate samples from mice in which the probes were located in the PFC were quantified to determine levels of neurotransmitters using high-performance liquid chromatography (HPLC) coupled with tandem mass spectrometry (MS/MS). Neurotransmitters in dialysate samples were analyzed using standard statistical tools, as well as machine learning approaches to determine changes in the PFC neurochemical network (e).
Fig. 5
Fig. 5. Acute and chronic GCR exposure produced differences in K+-evoked neurotransmitter levels in the PFC.
Cumulative levels of DA (a), 5-HT (b), NE (c), Glu (d), or GABA (e) at each K+ concentration in the PFC of control (n = 10), acute (n = 10), or chronic (n = 8) GCR exposed mice are shown. Ordinates, cumulative levels of DA, 5-HT, NE, Glu, or GABA in nM; abscissae, K+ concentration in mM. Each data point represents the mean (±S.E.M.) nM concentrations of the cumulative levels of all four dialysate samples taken at 4-, 30-, 60-, or 120-mM K+ concentration. An unpaired two-tailed t test was used to determine differences in cumulative increases in neurotransmitter levels among groups. *P < 0.05 represents significant difference compared to controls within each concentration. #P < 0.05 represents significant differences between acute and chronic GCR treated mice at each concentration. See Supplementary Table 1 for further details on statistics. DA dopamine, 5-HT serotonin, NE norepinephrine, Glu glutamate, GABA γ-aminobutyric acid.
Fig. 6
Fig. 6. Acute and chronic GCR exposure abolished K+-evoked DA response in PFC, but not other neurotransmitters.
Time course of the effects of K+-evoked increases in extracellular levels of DA (a), 5-HT (b), NE (c), Glu (d), or GABA (e) in the PFC of control (n = 10), acute (n = 10), or chronic (n = 8) GCR exposed mice as a % basal (nM) levels. Dialysate samples were taken from the PFC every 20 min. Each dotted line indicates time points at which K+ concentration was increased. Ordinates, percentage of basal DA, 5-HT, NE, Glu, or GABA levels; abscissae, time in minutes during K+ stimulation. Each point indicates the mean (±S.E.M.) effect shown as of percentage of basal DA, 5-HT, NE, Glu, or GABA levels; neurotransmitter levels were uncorrected for probe recovery. Time course data were analyzed using a two-way ANOVA (treatment group and concentration and treatment group and time as factors, respectively) for repeated measures over concentration and time; overall changes from basal levels determined at 4 mM K+ perfusate solution were subjected to Tukey post hoc analyses. Analysis of these data showed: (a) for DA: main-effect treatment, F(2,325) = 8.41, P = 0.0003; main-effect time F(12,325) = 1.58, P > 0.05; a significant treatment × concentration interaction, F(24,325) = 0.81, P > 0.05; (b) for 5-HT: non-significant main-effect treatment, F(2,325) = 1.62, P > 0.05; significant main-effect time, F(12,325) = 3.93, P = 0.0001; non-significant treatment × concentration interaction, F(24,325) = 0.62, P = 0.92; (c) for NE: main-effect treatment, F values(2,325) = 7.91, P = 0.0004; main-effect time, F values(12,325) ≥ 2.40, P values = 0.005; non-significant treatment x concentration interaction, F(24,325) = 0.41, P = 0.99; and (d-e) for Glu and GABA: main-effect treatment, F values(2,325) ≥ 5.06, P values ≤ 0.007; main-effect time, F values (12,325) ≥ 6.23, P values < 0.0001; significant treatment x concentration interaction for GABA, F(24,325) = 2.74, P < 0001 but not Glu, F(24,325) = 0.91, P > 0.05. *P < 0.05 represents significant difference compared to basal values at 4 mM at time = 0. #P < 0.05 represents a significant difference compared to controls at each time point. $P < 0.05 represents significant differences between acute and chronic GCR-treated mice at each time point. DA dopamine, 5-HT serotonin, NE norepinephrine, Glu glutamate, GABA γ-aminobutyric acid.
Fig. 7
Fig. 7. Pearson’s correlation analysis showed that acute and chronic GCR exposure differentially reorganized PFC neurotransmitter networks.
Box plot (a) showing overall pair-wise Pearsons correlation for each treatment group during K+ stimulation (4 mM: F(2,27) = 0.40, P > 0.05; 30 mM: F(2,27) = 6.44, P = 0.005; 60 mM: F(2,27) = 1.03, P > 0.05; 120 mM: F(2,27) = 4.69, P = 0.018). Plots show median, interquartile range, minimum, and maximum levels; One-way ANOVAs were followed by a Tukey’s Multiple Comparison post-hoc test: *P = 0.0153; **P = 0.0038. Heatmaps (b) depicting strength of pair-wise neurotransmitter correlations for all the target classes and concentration levels. All analysis is based on neurotransmitter data in Figs. 5, 6: control n = 10, acute n = 10, and chronic n = 8. Pearson’s product-moment correlation coefficient was calculated for each neurotransmitter pair to determine the relationship between each neurotransmitter. Significant change in correlation can be observed for each concentration across the target classes. Neurotransmitter networks (c) built using Pearson’s correlation ≥ 0.5 with a significance p-value of <0.05. Thickness of an edge represents the strength of the correlation. Significant reorganization of networks can be observed moving across the study groups. In general, ‘acute’ condition shows higher connectivity among the target classes for most of the concentration levels. For all other *P < 0.05 indicates significant difference compared to controls. DA dopamine, 5-HT serotonin, NE norepinephrine, Glu glutamate, GABA γ-aminobutyric acid.
Fig. 8
Fig. 8. Machine learning-derived networks unravel the impact of neurotransmitters on each other and their rearrangement after acute and chronic GCR exposure.
a Directional neurotransmitter networks built using iRF-LOOP method. The iRF network for each target class that was derived from the measured neurotransmitters as well as the absolute difference between each connection over each pair of target classes resulting in 12 directional neurotransmitter networks are shown (i.e., from ‘Control’,‘Acute’,‘Chronic’ and concentration from ‘4 mM’,‘30 mM’,‘60 mM’,‘120 mM’). All analysis is based on neurotransmitter data in Figs. 5, 6: control n = 10, acute n = 10, and chronic n = 8. We also embed the derived feature importance by changing edge thickness in the networks. The thickness of the edges represents importance of one neurotransmitter level in predicting level of another neurotransmitter. Apart from the networks for the individual groups, we add panels to capture changes in connection strength between every pair of target groups (e.g., acute vs. control). A threshold of 0.2 on the feature importance values was applied so that both balanced (a neurotransmitter being equally affected by other 4) and biased connections are depicted, and faint connections are suppressed. The connection strengths above that threshold are encoded with thickness of edges. For bidirectional arrows the difference between individual directions can be understood by observing the difference in thickness of arrowheads. Significant differences in connection strength and direction can be observed moving across the three classes for each concentration level (reflected clearly by the X vs. Y panels). For example, DA-NE connection is nonexistent in ‘Control’ class but appears strongly in ‘Acute’ and ‘Chronic’ classes for 30 mM concentration. In addition, using linear regression analysis we have added a ‘+’ sign of impact to reflect that an increase in one neurotransmitter promotes the increase in the levels of another neurotransmitter, whereas a ‘–’ sign reflects suppression. b Illustrates an alternative representation of the neurotransmitter networks depicted through the graphs in (a). The boxes are marked red and blue when, respectively, a positive or negative A to B connection exists with an importance greater than 0.2. DA dopamine, 5-HT serotonin, NE norepinephrine, Glu glutamate, GABA γ-aminobutyric acid.
Fig. 9
Fig. 9. Pair-wise Granger causality tests identify dopamine as an important player in driving or being driven by other neurotransmitters after acute and chronic GCR exposure.
a The Granger Causality test to understand the significance of causal impacts with GCR exposure vs controls and generated boxplots depicting the distribution of p-values over all the subjects for impact of each neurotransmitter on DA. b The Granger Causality test to understand the significance of causal impacts with GCR exposure vs controls and generated boxplots depicting the distribution of p-values over all the subjects for DA’s impact on each neurotransmitter. All analysis is based on neurotransmitter data in Figs. 5, 6: control n = 10, acute n = 10, or chronic n = 8. The boxplots depict the median (middle line), 25th percentile (Q1; lower boundary of the box), 75th percentile (Q3; upper boundary of the box), and lowest datum above Q1–1.5*(Q3–Q1) and highest datum below Q3 + 1.5*(Q3–Q1) as whiskers. Outliers are not shown. DA dopamine, 5-HT serotonin, NE norepinephrine, Glu glutamate, GABA γ-aminobutyric acid.

Similar articles

Cited by

References

    1. Cucinotta FA, Nikjoo H, Goodhead DT. The effects of delta rays on the number of particle-track transversals per cell in laboratory and space exposures. Radiat. Res. 1998;150:115–119. doi: 10.2307/3579651. - DOI - PubMed
    1. Saganti PB, Cucinotta FA, Wilson JW, Simonsen LC, Zeitlin C. Radiation climate map for analyzing risks to astronauts on the Mars surface from galactic cosmic rays. Space Sci. Rev. 2004;110:143–156. doi: 10.1023/B:SPAC.0000021010.20082.1a. - DOI
    1. Curtis SB, Vazquez ME, Wilson JW, Atwell W, Kim MH. Cosmic ray hits in the central nervous system at solar maximum. Adv. Space Res. 2000;25:2035–2040. doi: 10.1016/S0273-1177(99)01015-7. - DOI - PubMed
    1. Yasuda H, Komiyama T, Fujitaka K. Probability of hippocampus cell hits by high-LET space radiation in a low-Earth orbit mission (STS-91) Phys. Med. 2001;17:166–169. - PubMed
    1. Mhatre SD, et al. Neuro-consequences of the spaceflight environment. Neurosci. Biobehav Rev. 2022;132:908–935. doi: 10.1016/j.neubiorev.2021.09.055. - DOI - PubMed

Publication types