

Expression prevalence and dynamics of GPCR somatostatin receptors 2 and 3 as cancer biomarkers beyond NET: a paired immunohistochemistry approach
- PMID: 38012197
- PMCID: PMC10682014
- DOI: 10.1038/s41598-023-47877-0
Expression prevalence and dynamics of GPCR somatostatin receptors 2 and 3 as cancer biomarkers beyond NET: a paired immunohistochemistry approach
Abstract
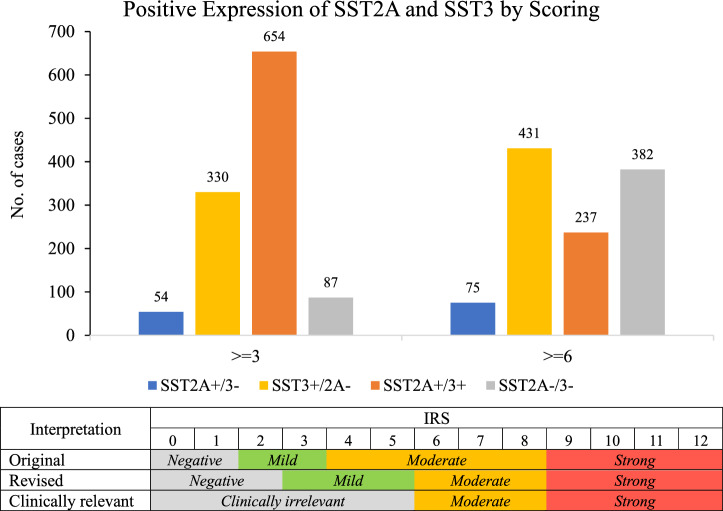
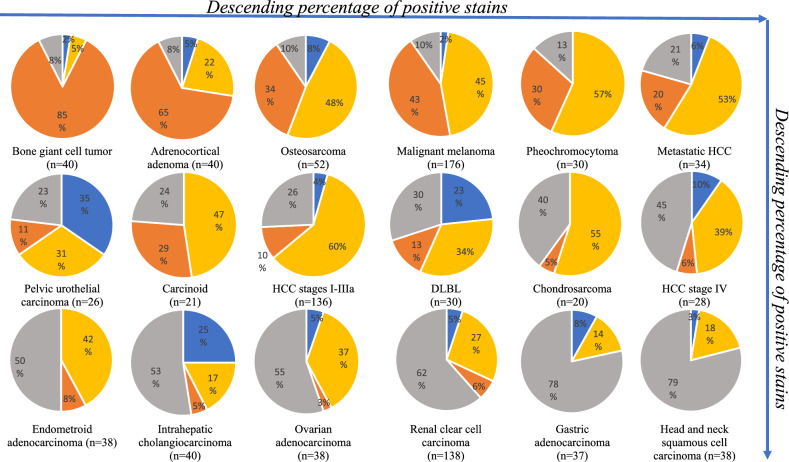
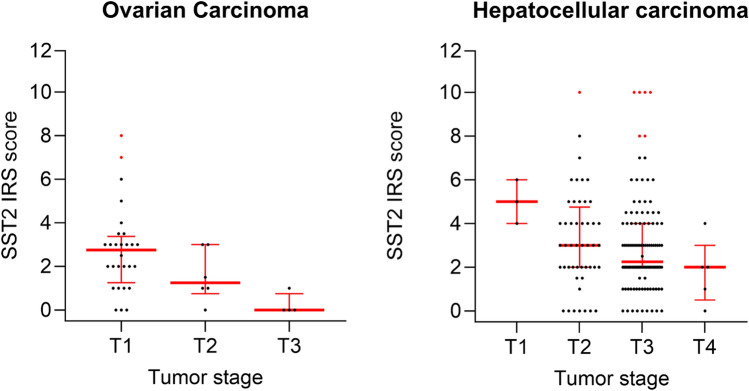
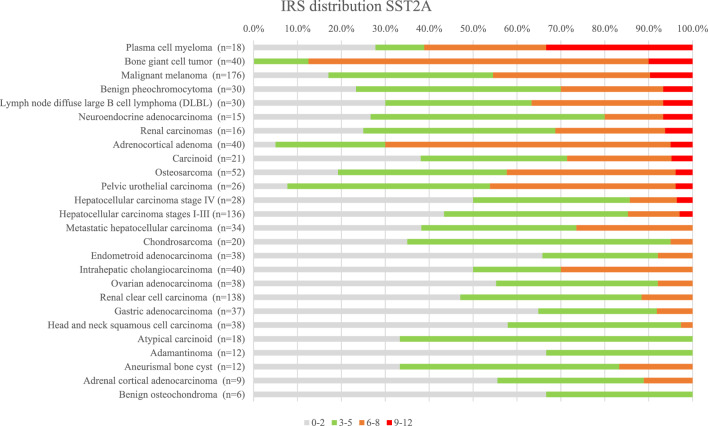
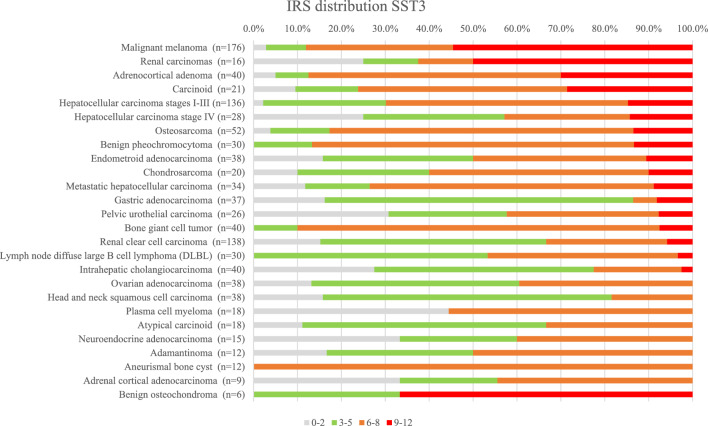
Somatostatin receptors are clinically validated GPCR biomarkers for diagnosis and treatment of various neuroendocrine tumors (NET). Among the five somatostatin receptors, SST2 and SST3 are associated with apoptosis and cell cycle arrest, making these receptor subtypes better differentiated targets in precision oncology. In this study we performed immunohistochemistry of paired tissue microarrays containing 1125 cores, representing 43 tumor types, each stained for SST2 and SST3. A 12-point immunoreactive scoring (IRS) range was used for interpretation of the staining results. We analyzed the results twice, using the conventional positivity IRS cutoffs ≥ 3 and more stringent ≥ 6. Evaluation of receptors expression dynamics was performed for tumor-nodes-metastases (TNM) defined subgroups (ovarian and hepatocellular adenocarcinomas) as a function of their tumor stage. Our results indicate that two-thirds of tested cores exhibit clinically significant expression of at least SST2 or SST3 (IRS ≥ 6). The expression prevalence of both receptors tends to decline with tumor progression. However, an unexpected upregulation of both SST2 and SST3 reemerged in metastases suggesting conserved receptors genetic potential during tumor life cycle. We suggest that SST2 and SST3 should be further explored as potential biomarkers and therapeutic tools for maximizing the efficiency of somatostatin-based precision oncology of solid tumors beyond NET.
© 2023. The Author(s).
Conflict of interest statement
The study has been funded by Starget Pharma™ Ltd. MOH and GK are employees of the company, DK and MA received compensation for the scientific advisory activities from the company, MOH, GK, and MA own stocks or options in the company. SS and AL declare no further potential conflict of interest.
Figures
References
MeSH terms
Substances
LinkOut - more resources
Full Text Sources
Other Literature Sources
