. 2023 Nov 27;6(1):1207.
doi: 10.1038/s42003-023-05565-9.

Recurrent connectivity supports higher-level visual and semantic object representations in the brain

Affiliations

Recurrent connectivity supports higher-level visual and semantic object representations in the brain

Jacqueline von Seth et al. Commun Biol. .

Abstract

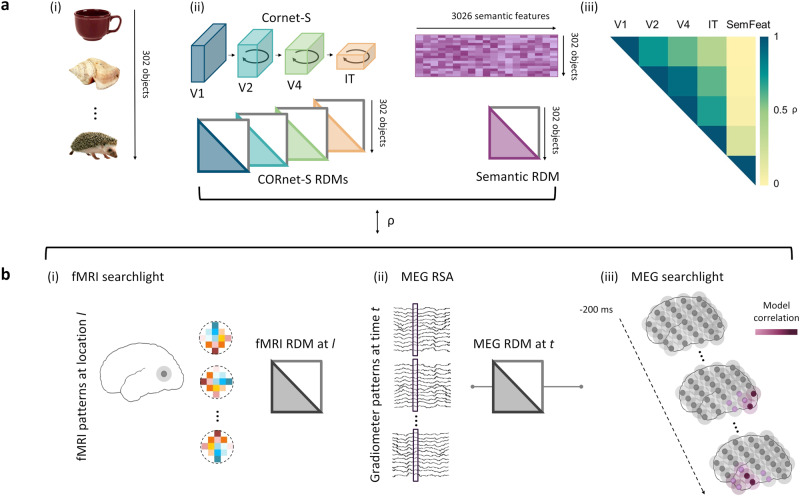
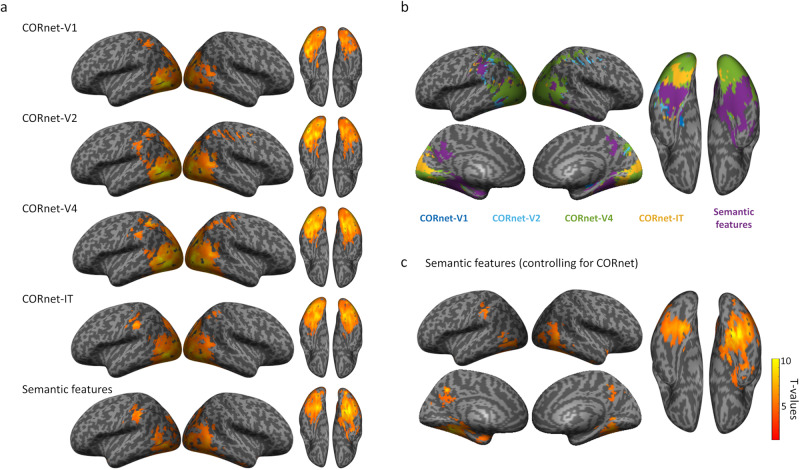
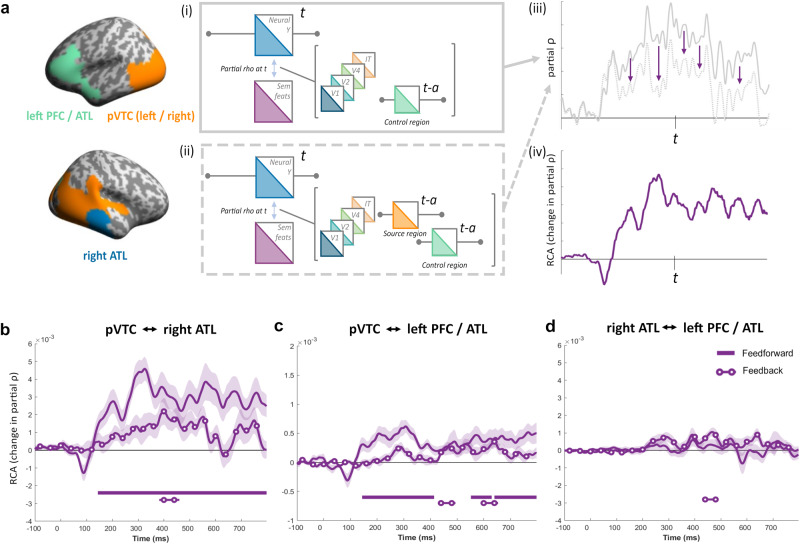
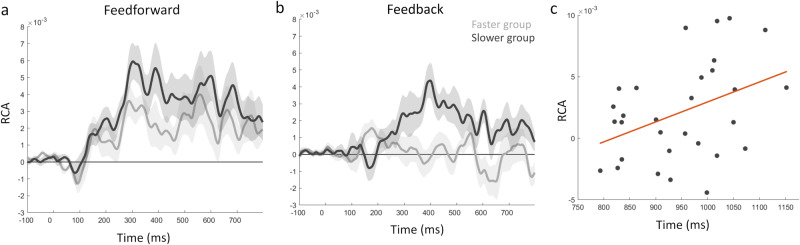
Visual object recognition has been traditionally conceptualised as a predominantly feedforward process through the ventral visual pathway. While feedforward artificial neural networks (ANNs) can achieve human-level classification on some image-labelling tasks, it's unclear whether computational models of vision alone can accurately capture the evolving spatiotemporal neural dynamics. Here, we probe these dynamics using a combination of representational similarity and connectivity analyses of fMRI and MEG data recorded during the recognition of familiar, unambiguous objects. Modelling the visual and semantic properties of our stimuli using an artificial neural network as well as a semantic feature model, we find that unique aspects of the neural architecture and connectivity dynamics relate to visual and semantic object properties. Critically, we show that recurrent processing between the anterior and posterior ventral temporal cortex relates to higher-level visual properties prior to semantic object properties, in addition to semantic-related feedback from the frontal lobe to the ventral temporal lobe between 250 and 500 ms after stimulus onset. These results demonstrate the distinct contributions made by semantic object properties in explaining neural activity and connectivity, highlighting it as a core part of object recognition not fully accounted for by current biologically inspired neural networks.


Conflict of interest statement

The authors declare no competing interests.

Figures

Fig. 1
Fig. 1. Schematic illustration of model and neural RDM construction for representational similarity and representational connectivity analyses.
a Construction of model RDMs. (i) 302 objects including animate and inanimate, natural and man-made objects were shown to participants and used to construct model RDMs. (ii) Visual RDMs are created from pairwise comparisons of nodal activations extracted from 4 layers of the CORnet-S ANN for each object and vectorised. A semantic model RDM is created based on data from a large property norming study which generated 3026 features, with the RDM defined by the overlap in features between concepts, and vectorised. (iii) Pairwise Spearman’s correlations between visual and semantic feature models show a high degree of correlation between the visual RDMs, graded by distance, but limited correlation between visual and semantic models. b Construction of vectorised model RDMs from MEG and fMRI data (note, MEG RDMs based on 302 objects and fMRI RDMs based on 131 objects). (i) fMRI searchlight RDMs reflect the similarity between voxel patterns for each of the objects, and each searchlight location across the brain. (ii) For the sensor-level MEG RSA analysis, MEG RDMs are created from object-specific spatio-temporal patterns for each time-point extracted from MEG sensors. (iii) Temporally resolved MEG RSA searchlight analysis is conducted for the semantic model using source localised MEG patterns. Vertices are illustrated with grey dots with shaded searchlight spheres, and the degree of hypothetical model correlation is indicated by purple colouration. Object images reprinted with permission from Hemera Photo Objects.
Fig. 2
Fig. 2. fMRI searchlight results.
a Maps show significant relationship between each model RDM and voxel patterns, voxelwise p < 0.001, cluster p < 0.05, N = 16. b Maps showing which model RDM had the strongest effect size at each searchlight centre voxel. c RSA effects of the semantic feature RDM partialling out effects of all CORnet layers.
Fig. 3
Fig. 3. RSA results for the MEG sensor array.
a Partial correlation RSA showing the unique effects of each model RDM over time (N = 36). Shaded areas show standard error of the mean. Solid bars show time periods of significant effects. b Swarmplots showing the differences in peak latency between model RDMs. Distributions display resamples of the data (31,465 resamples) which were used to generate 95% CIs for the differences in peak latencies.
Fig. 4
Fig. 4. Illustration and results of the MEG sensor-level Representational connectivity analysis (RCA).
a Illustration of the calculation of feedforward information flow (feedforward connectivity at each timepoint) between anterior and posterior regions at the MEG sensor-level, as introduced by Karimi-Rouzbahani et al.. i) RDMs are created from anterior and posterior sensors. Feedforward flow at each timepoint is formalised as the contribution of the earlier posterior RDM (t-30m) to the current model-anterior RDM correlation (t). This is calculated as the difference between the anterior-model RDM correlation and the anterior-model RDM correlation where the posterior RDM is partialled out. Feedback information flow is formalised as the contribution of the earlier anterior RDM (t-30) to the current model-posterior RDM correlation (t). ii) In the partial RCA, the contribution of other model RDMs is also partialled out in the calculation of both RSA timecourses. b Feedforward RCA effects for each model RDM. c Feedback effects of the model RDMs. Shaded areas show standard error of the mean. Solid bars show time periods of significant effects. d Swarmplots showing the differences in peak RCA latency between model RDMs. Distributions display resamples of the data (31,465 resamples) which were used to generate 95% CIs for the differences in peak latencies.
Fig. 5
Fig. 5. Searchlight RSA on source-localised MEG signals.
a Semantic feature effects were seen in four spatio-temporal clusters across bilateral pVTC, right ATL and left frontal/ATL. b Onset time of the semantic effects at each vertex and c time of peak RSA effect size at each vertex. d Maps showing significant effects of semantic features (partialling our all effects of the ANN layers) over time.
Fig. 6
Fig. 6. Illustration and results of RCA for source localised MEG signals.
a RCA analysis applied to ROI clusters. Feedforward effects in the source-level RCA is formalised in the same way as in the sensor-level analysis, and is based on the difference of two partial correlations. (i) The first measures the relationship between the target neural RDM and the semantic feature RDM, while controlling for other model RDMs and past RDMs from control regions. (ii) The second correlation measures the relationship between the target RDM and the semantic feature RDM, while controlling for the same other factors in addition to also removing the effects of past similarities in the source region. (iii) Example time-courses of these two partial correlations. A reduced correlation in the second partial correlation indicates the contribution of the source region to the target regions RSA effect. (iv) Subtracting the second correlation from the first is the RCA measure. b Effects between the pVTC and right ATL. Solid line shows feedforward effects (pvTC -> rATL) and line with circles shows feedback effects (rATL -> pVTC). c Feedforward (pVTC -> PFC/ATL) and Feedback (PFC/ATL-> pVTC) RCA effects between pVTC and the left PFC/ATL. d Feedforward (rATL -> PFC/ATL) and Feedback (PFC/ATL-> rATL) RCA effects between right ATL and left PFC/ATL. Shaded areas show standard error of the mean. Solid bars show time periods of significant effects.
Fig. 7
Fig. 7. RCA effects of the visual and semantic models showing feedforward and feedback effects.
a pVTC and right ATL, b pVTC and left PFC/ATL, and c right ATL and left PFC/ATL. Shaded areas show the standard error of the mean. Solid bars show time periods of significant effects.
Fig. 8
Fig. 8. Relationship of RCA effects to behaviour.
a Feedforward RCA effects of the semantic model for the faster group (light grey) and slower group (dark grey). b Feedback RCA effects for the two groups, where feedback is significantly increased for the slower group. Shaded areas show the standard error of the mean. c Correlation plot showing the relationship between response time and Feedback RCA for each participant, and the fitted linear effect.

References

    1. Clarke A, Tyler LK. Understanding what we see: how we derive meaning from vision. Trends Cogn. Sci. 2015;19:677–687. doi: 10.1016/j.tics.2015.08.008. - DOI - PMC - PubMed
    1. DiCarlo JJ, Zoccolan D, Rust NC. How does the brain solve visual object recognition? Neuron. 2012;73:415–434. doi: 10.1016/j.neuron.2012.01.010. - DOI - PMC - PubMed
    1. Kravitz DJ, Saleem KS, Baker CI, Ungerleider LG, Mishkin M. The ventral visual pathway: an expanded neural framework for the processing of object quality. Trends Cogn. Sci. 2013;17:26–49. doi: 10.1016/j.tics.2012.10.011. - DOI - PMC - PubMed
    1. Ungerleider, L. & Mishkin, M. Two cortical visual systems. in Analysis of visual behavior (eds. Ingle, D. J., Goodale, M. A. & Mansfiled, R. J. W.) 549–586 (MIT Press, 1982).
    1. Bankson BB, Hebart MN, Groen IIA, Baker CI. The temporal evolution of conceptual object representations revealed through models of behavior, semantics and deep neural networks. NeuroImage. 2018;178:172–182. doi: 10.1016/j.neuroimage.2018.05.037. - DOI - PubMed

Publication types

LinkOut - more resources