. 2024 Apr;8(4):479-494.
doi: 10.1038/s41551-023-01134-x. Epub 2023 Nov 27.

Tachycardia-induced metabolic rewiring as a driver of contractile dysfunction

Affiliations

Tachycardia-induced metabolic rewiring as a driver of contractile dysfunction

Chengyi Tu et al. Nat Biomed Eng. 2024 Apr.

Abstract

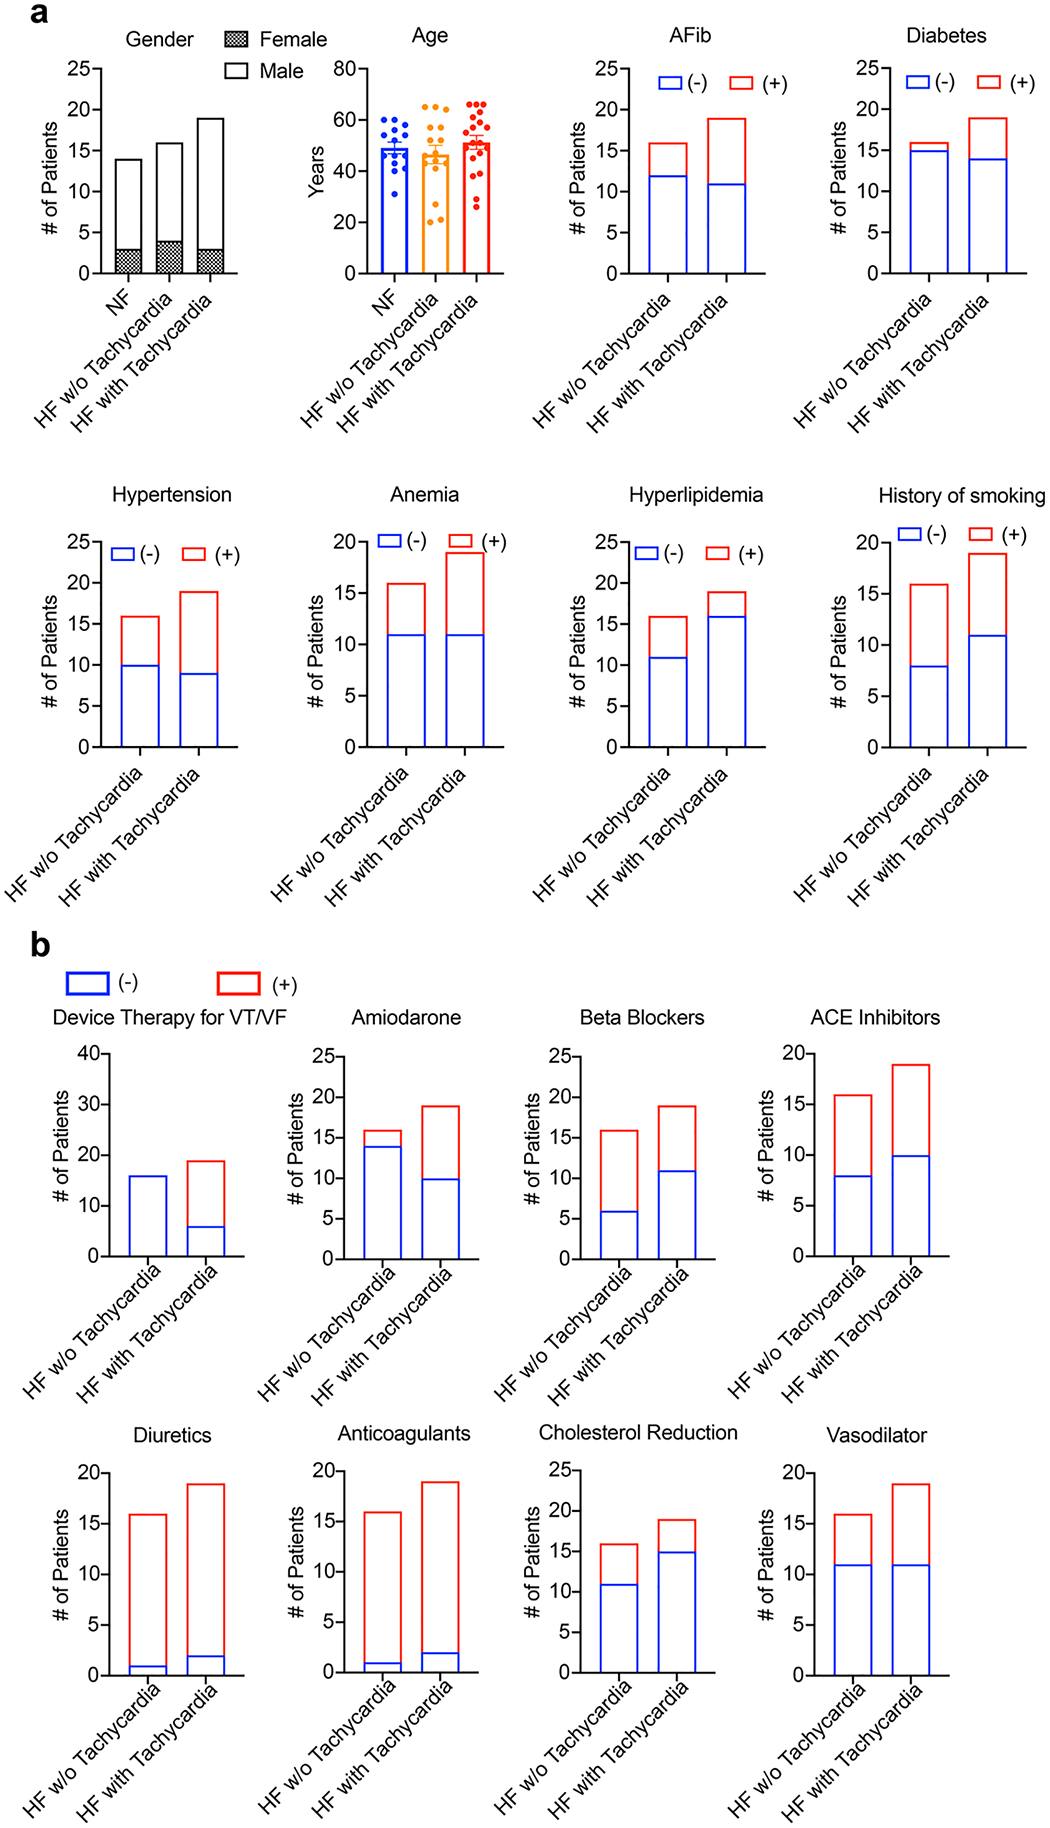
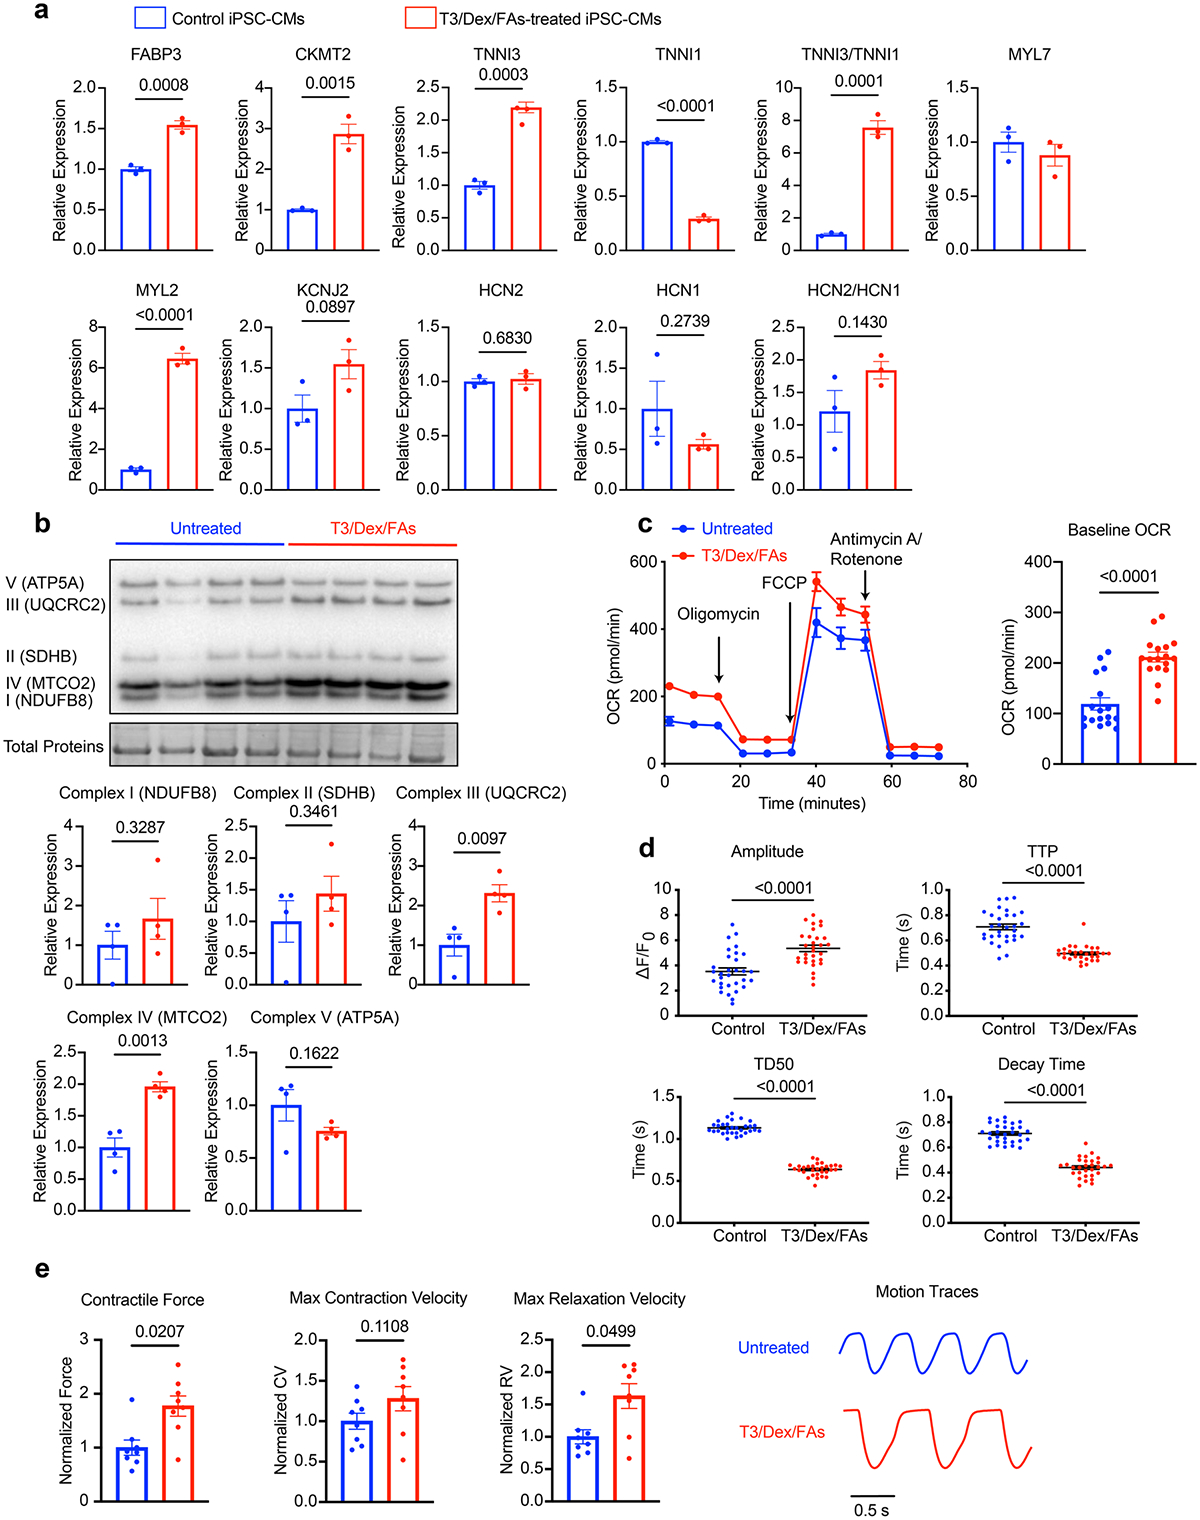
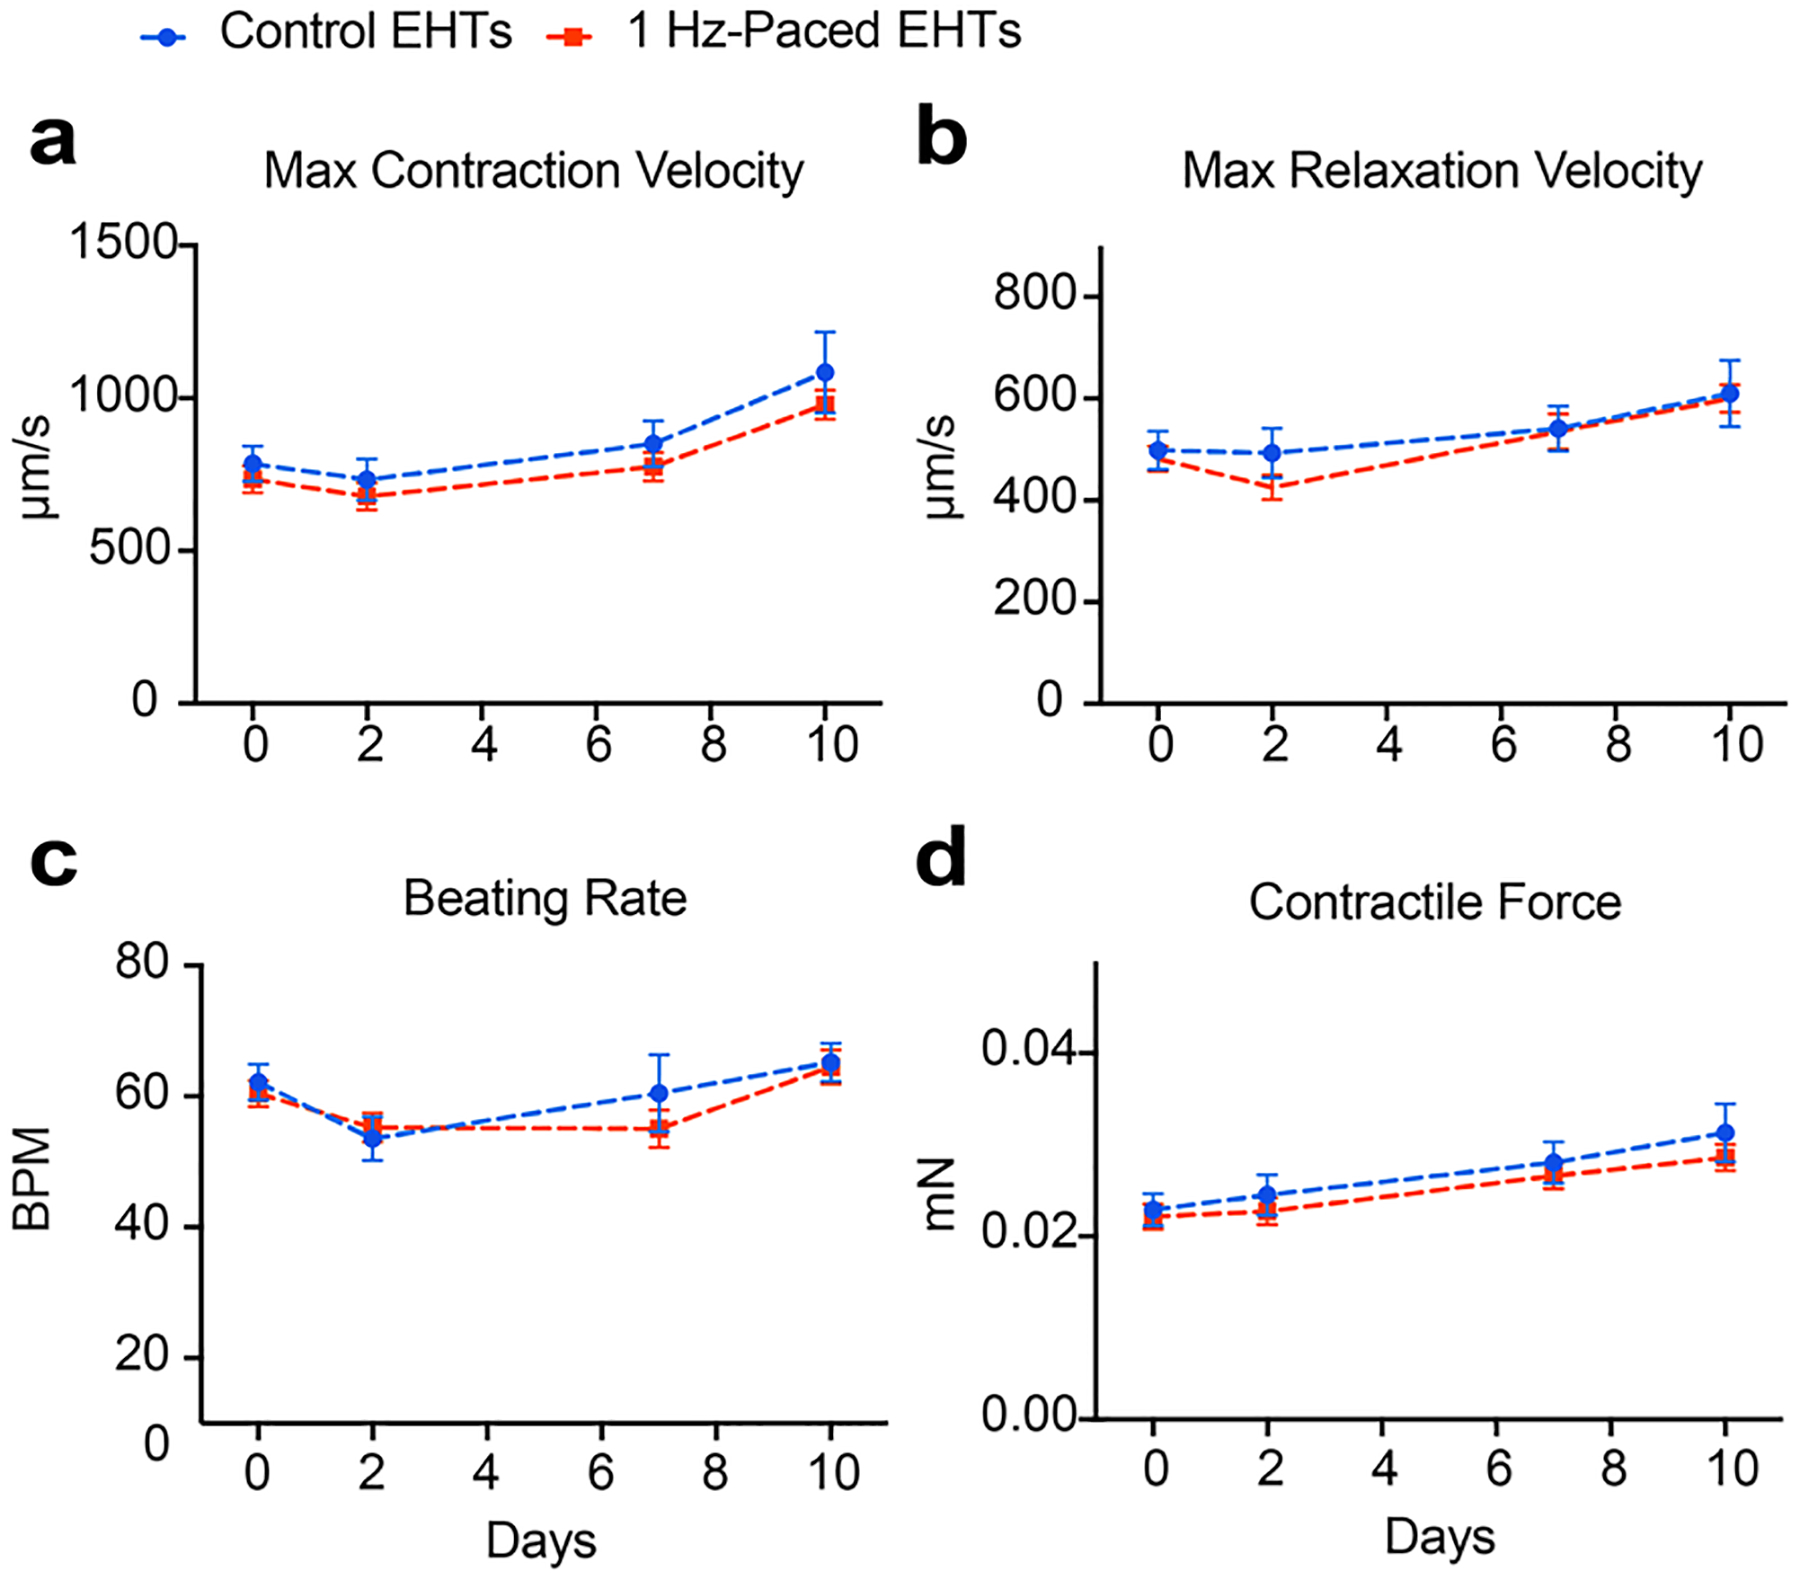
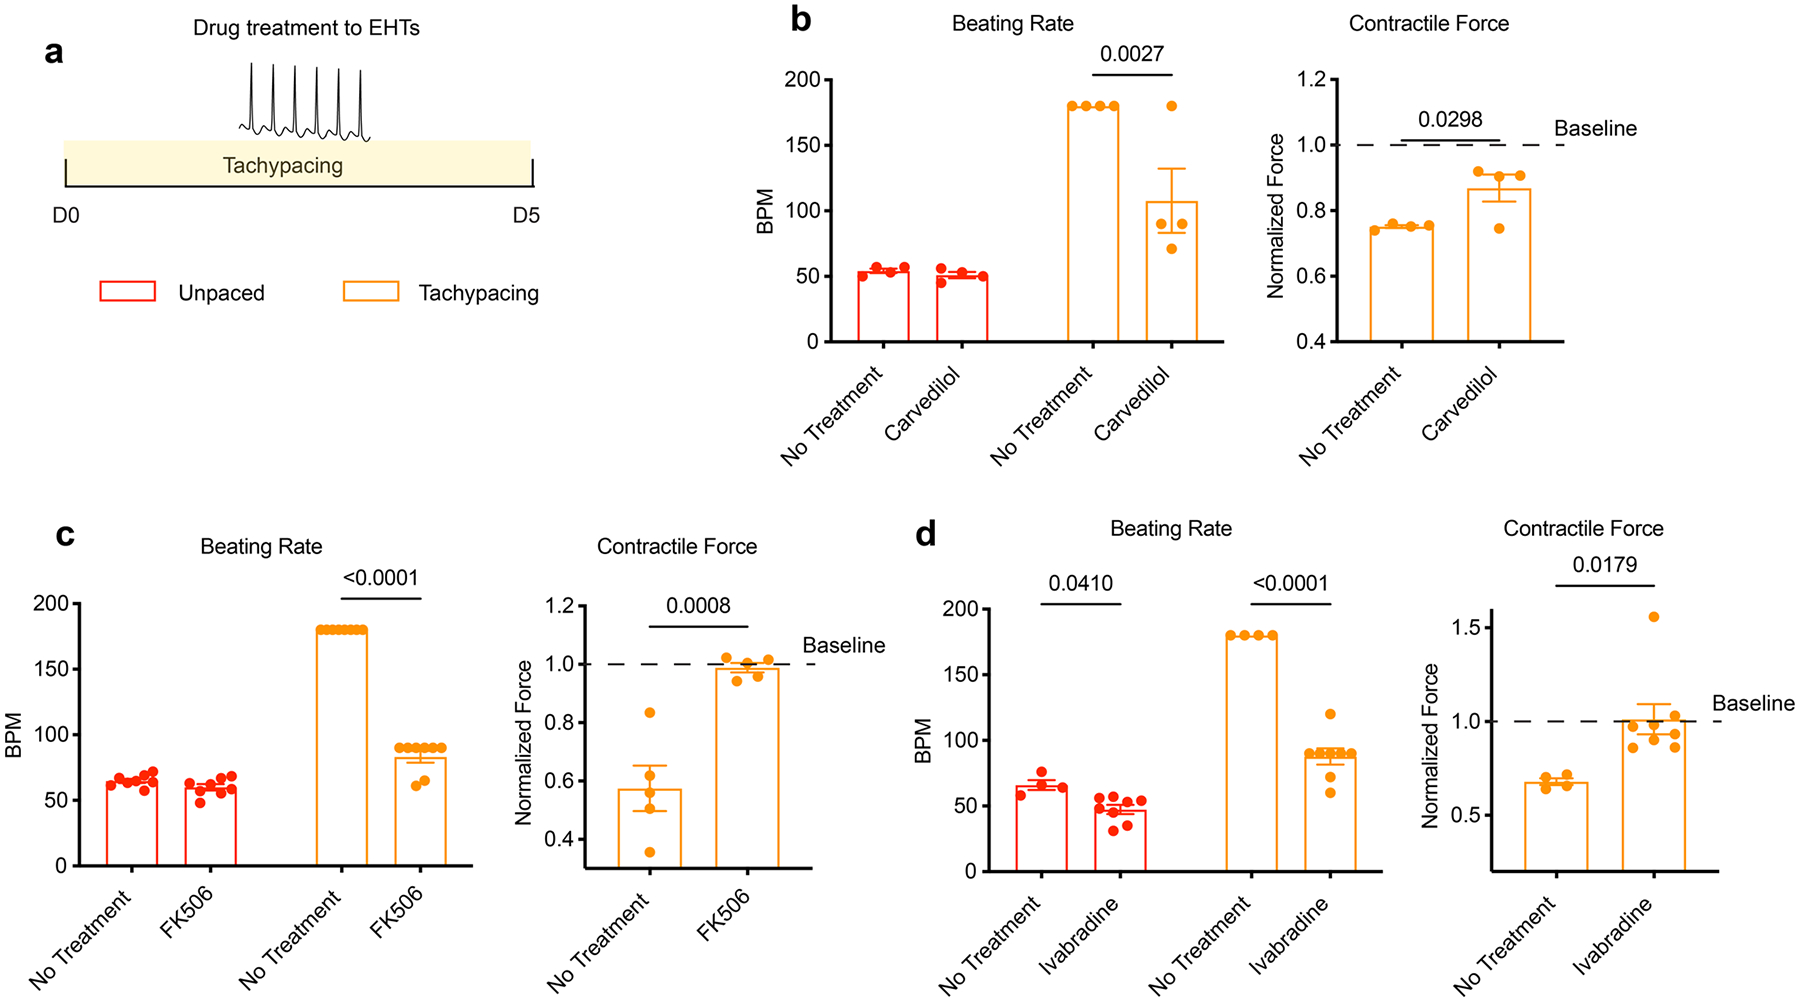
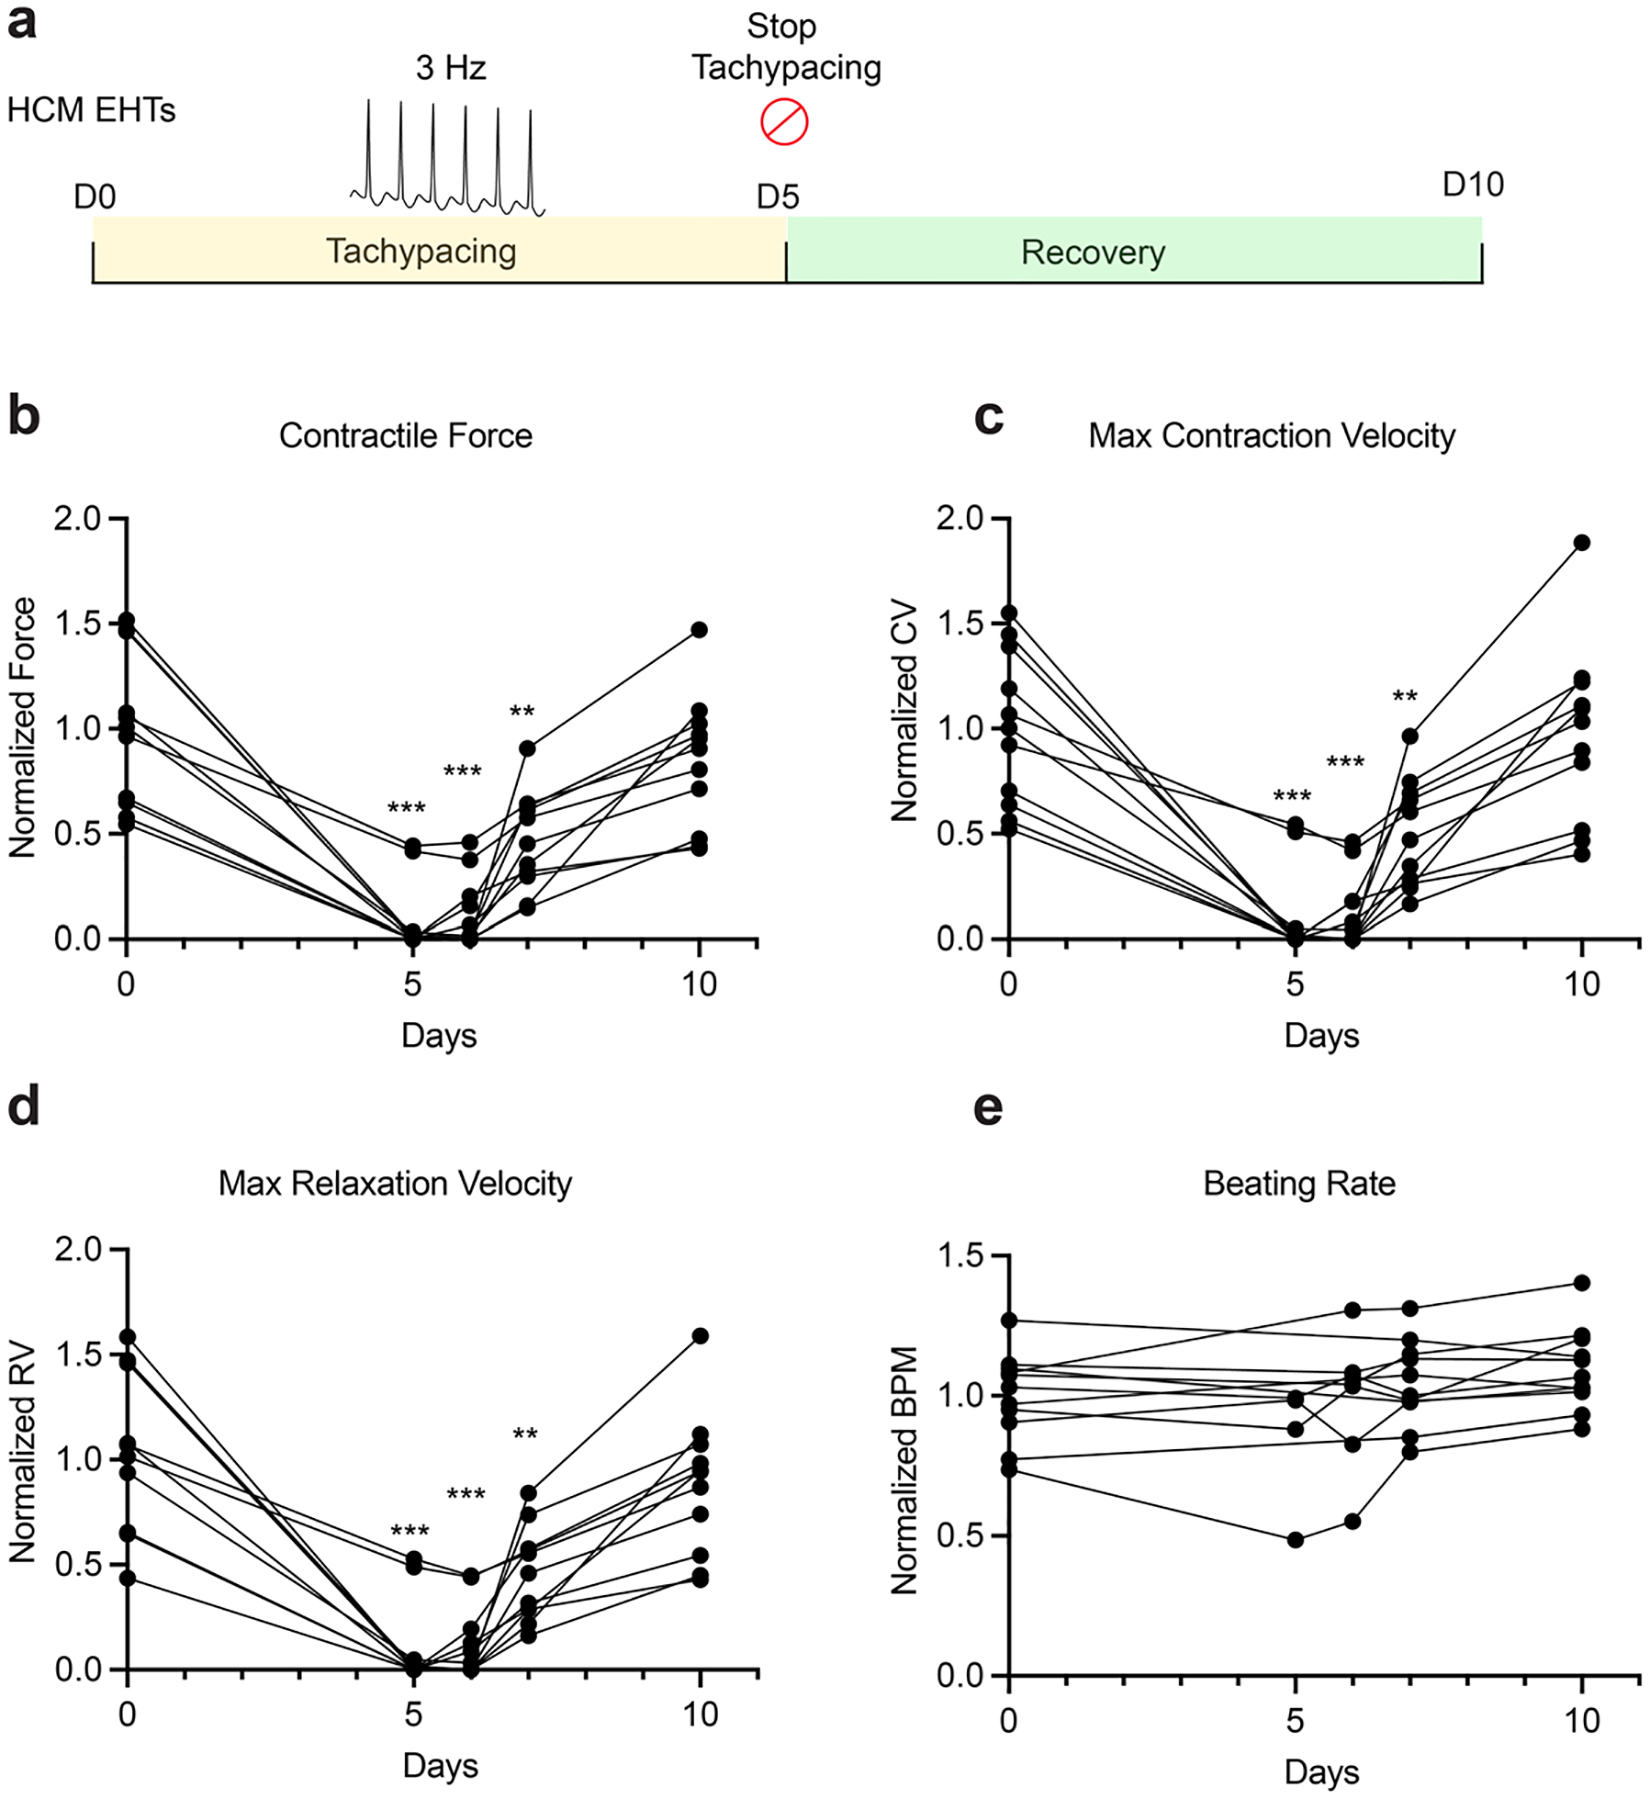
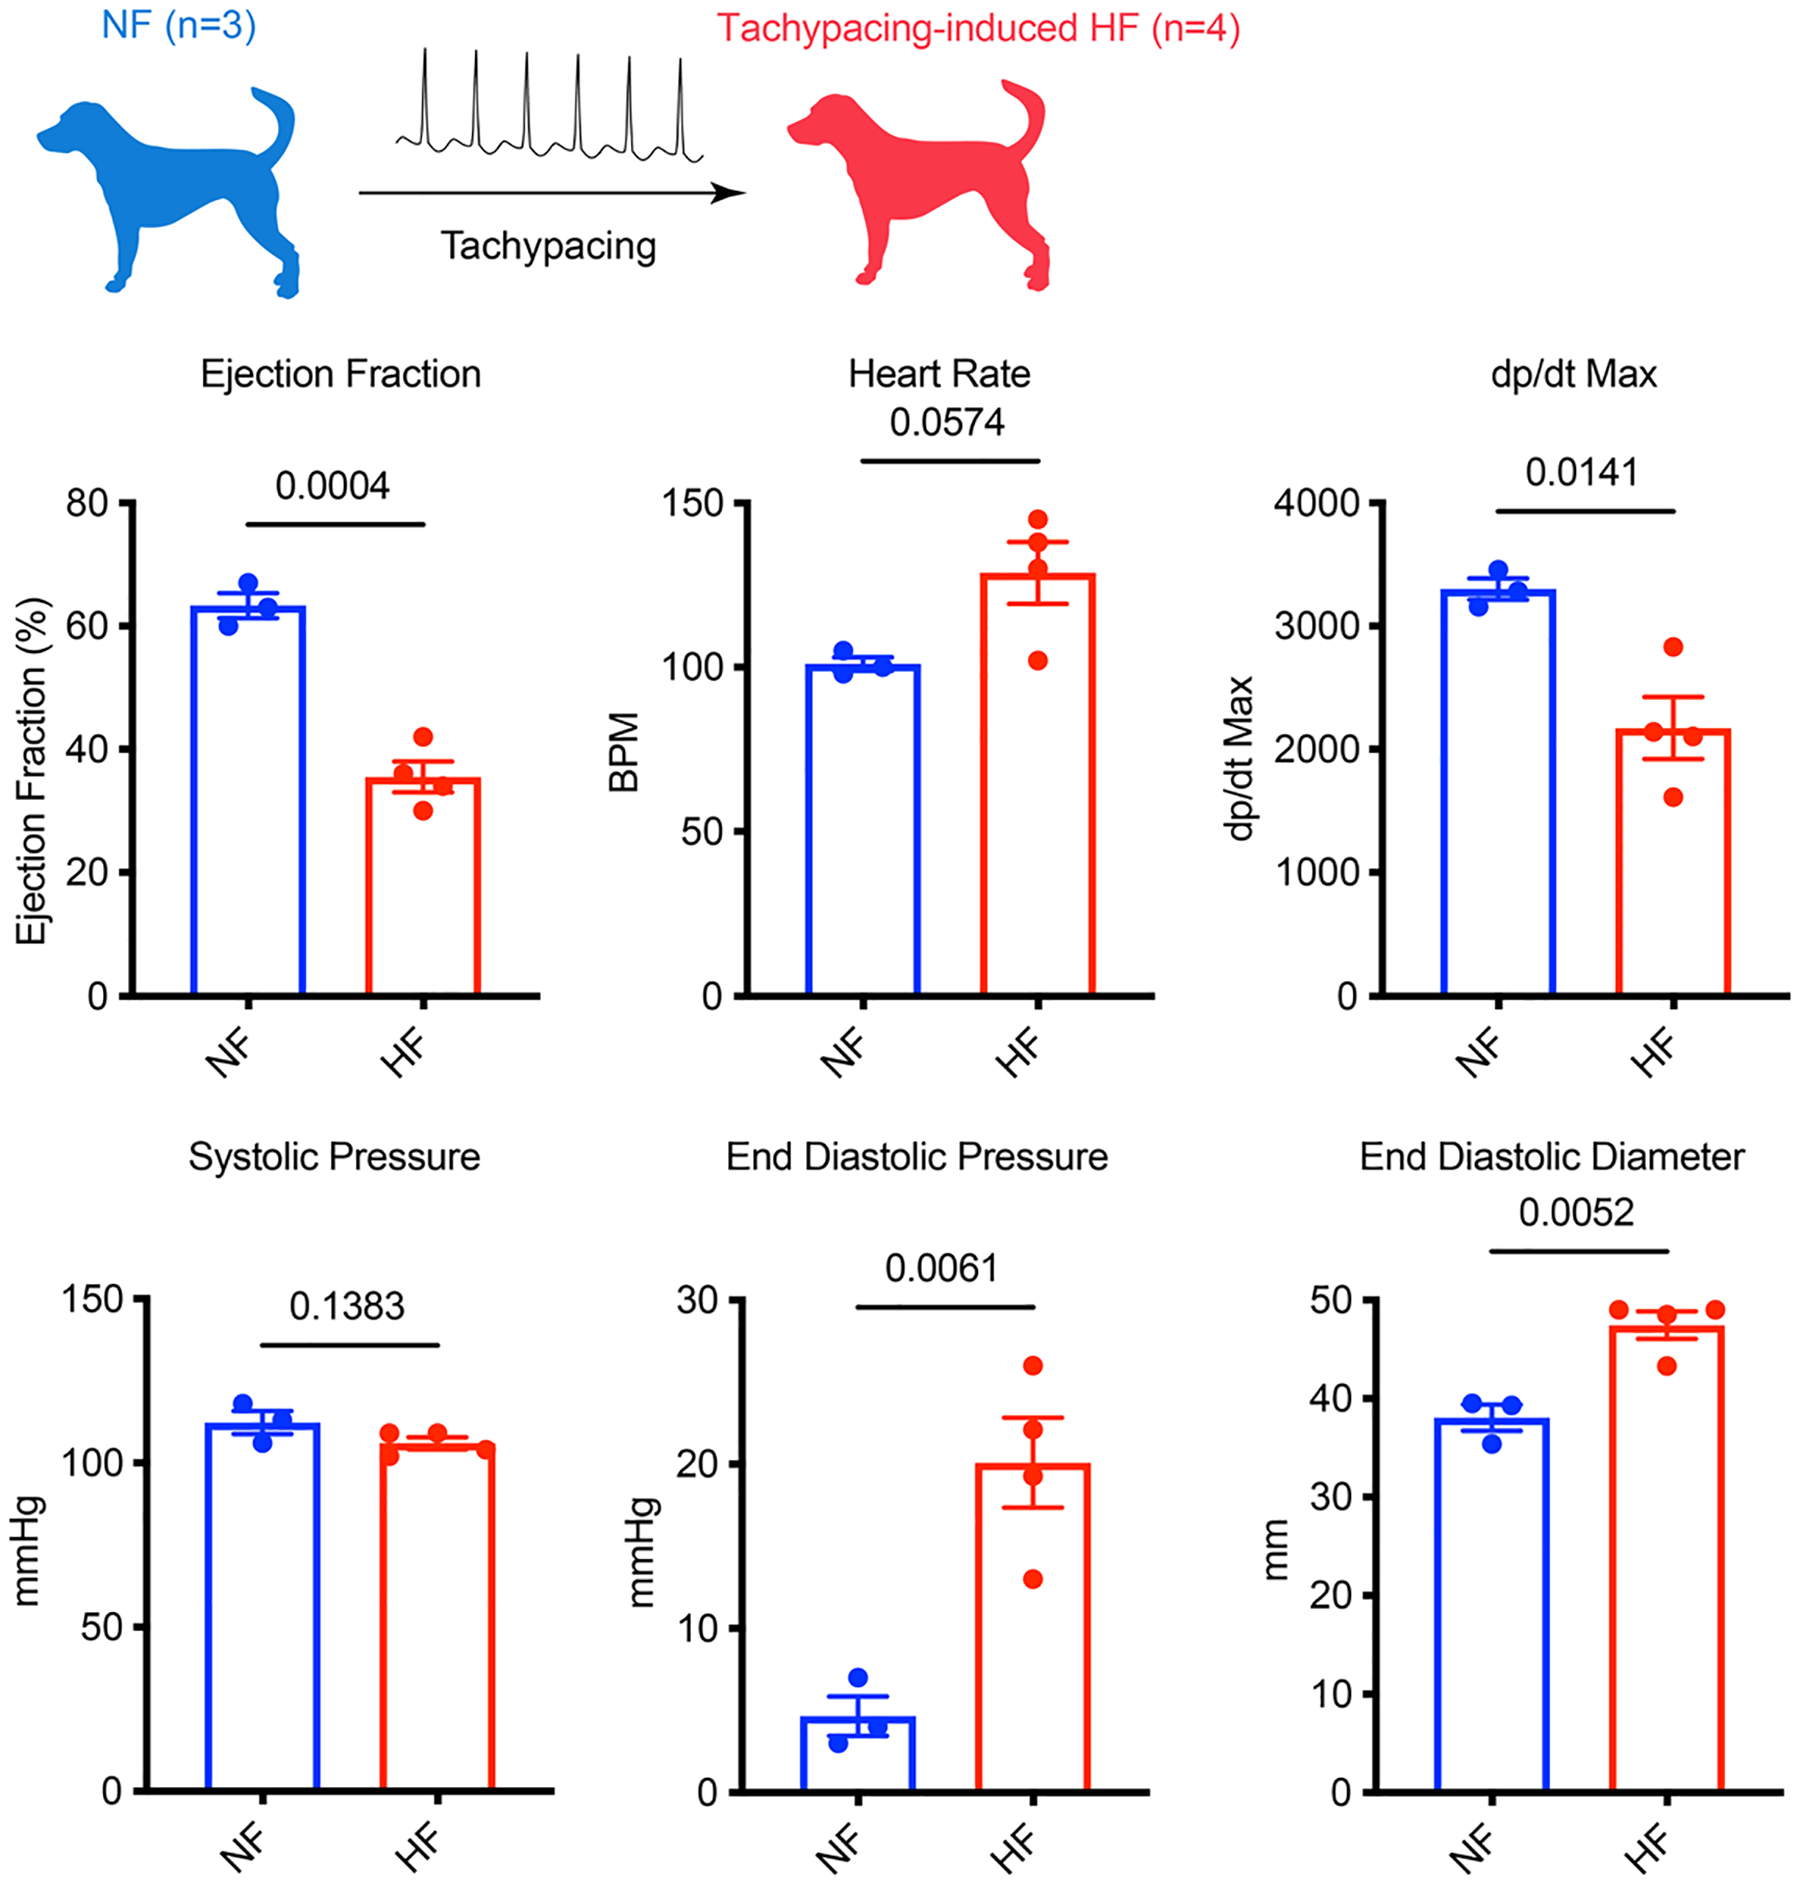
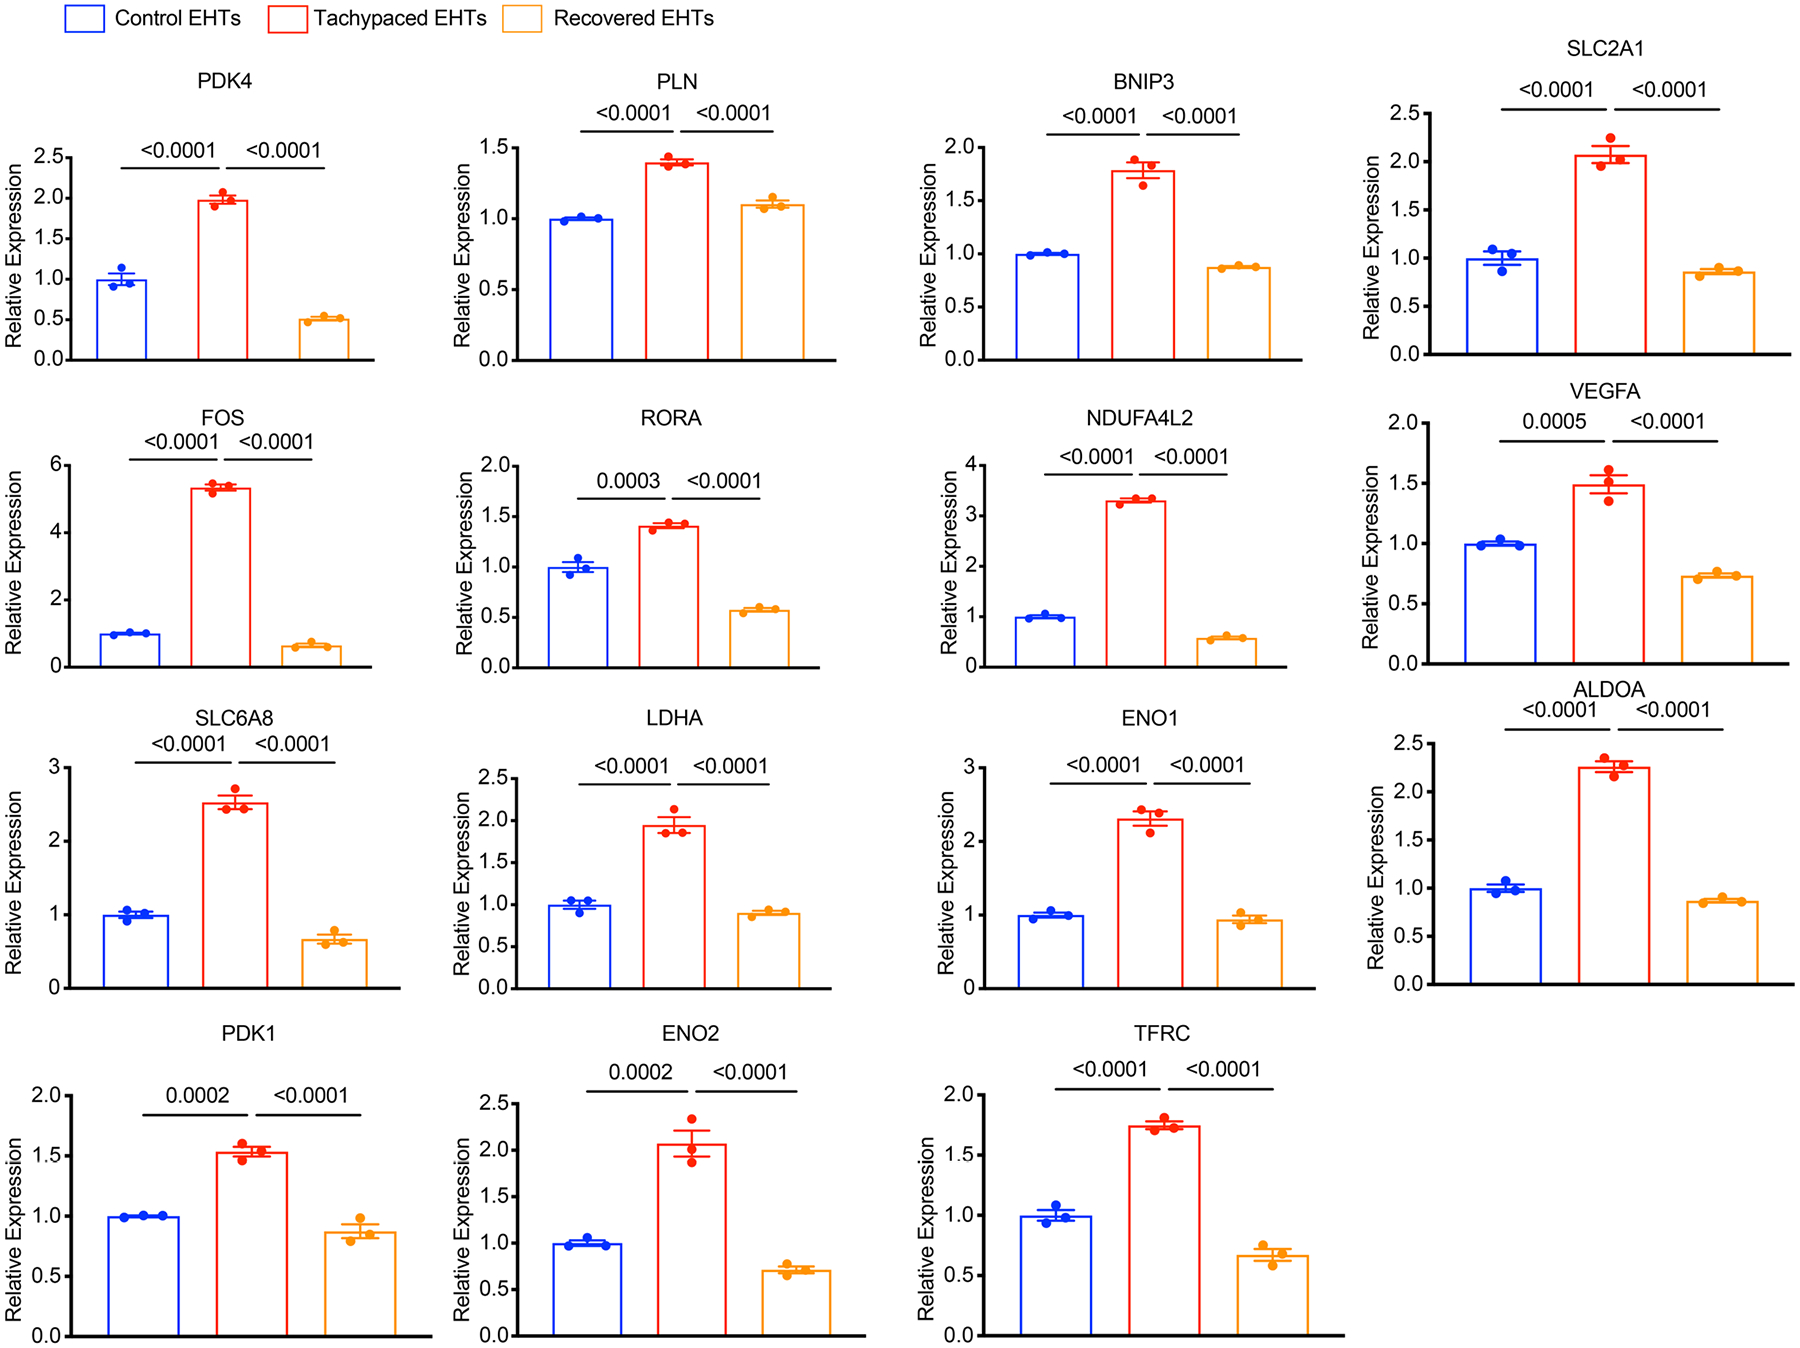
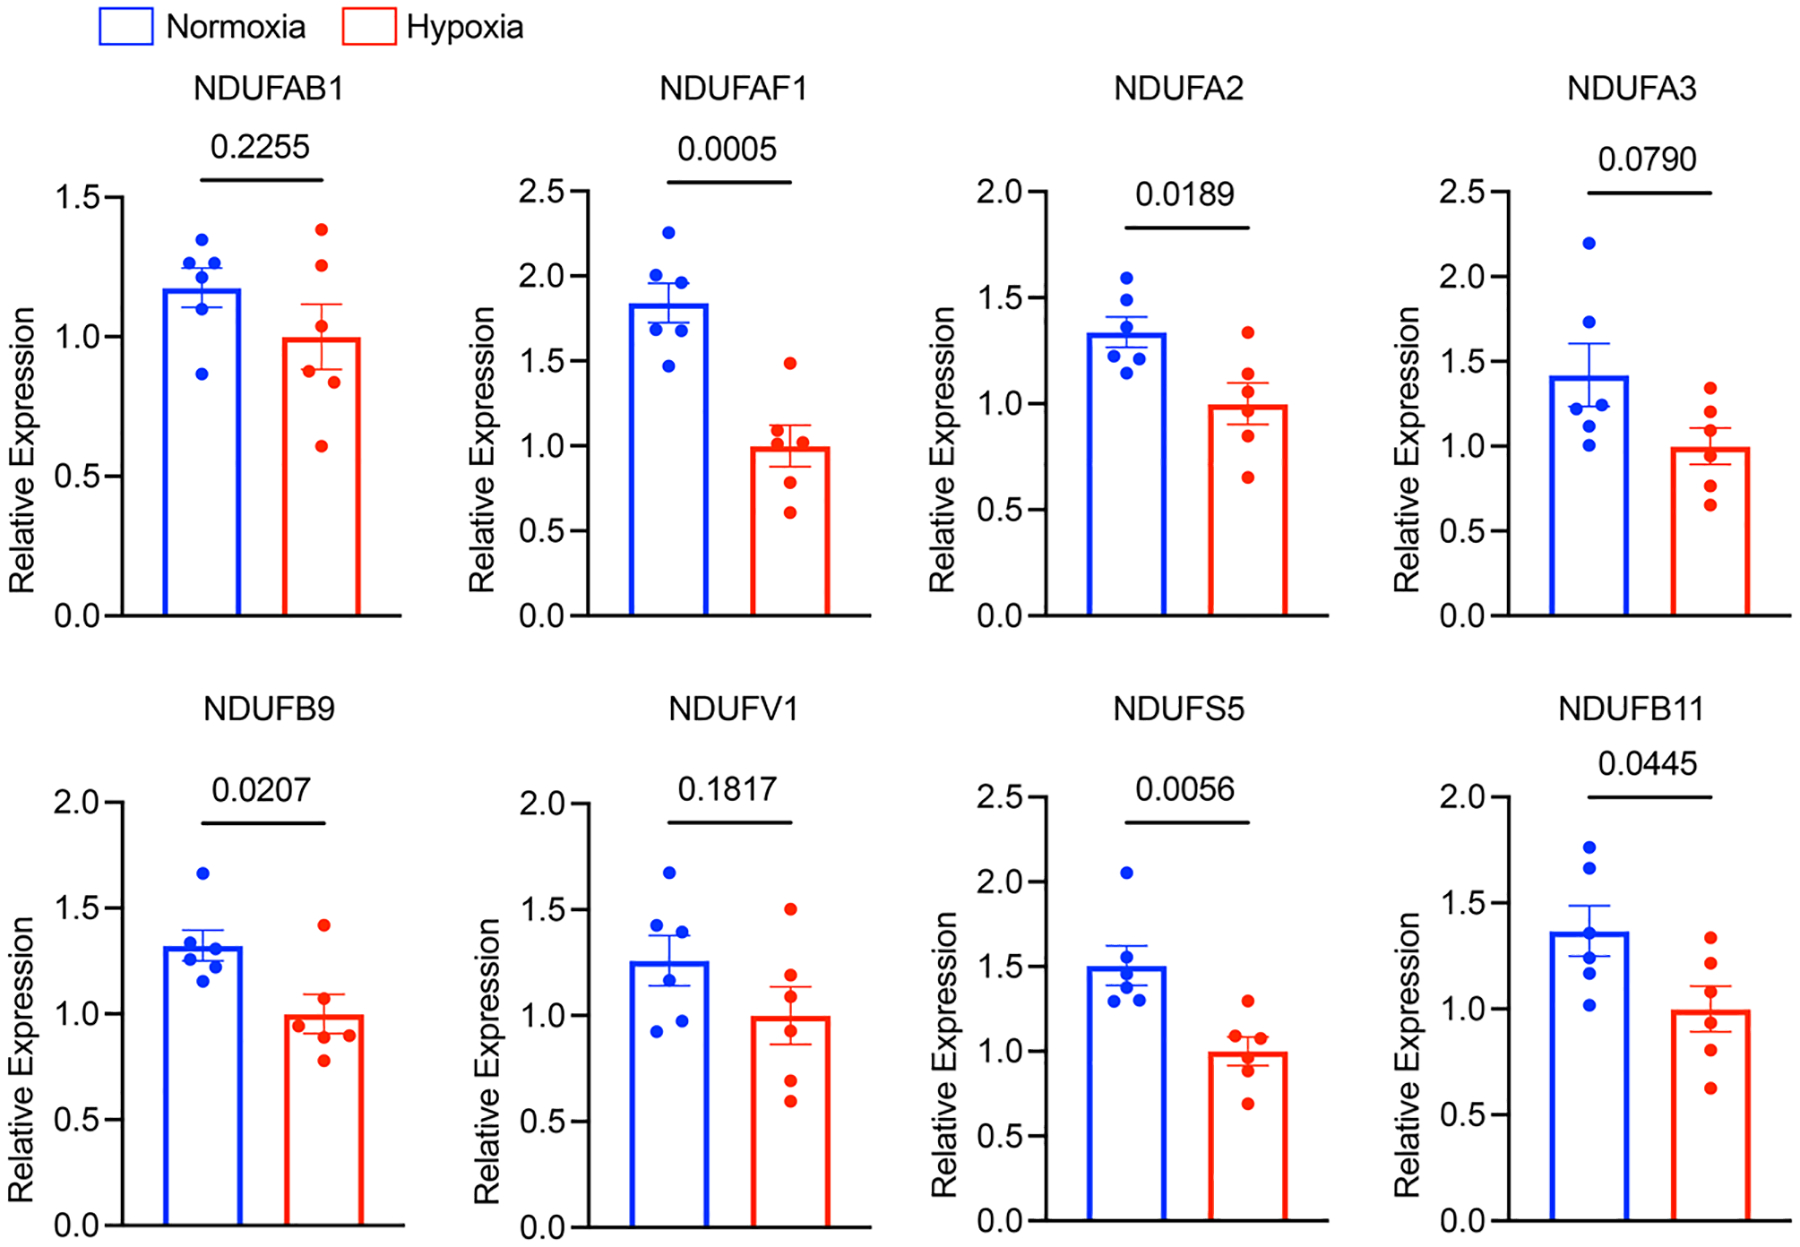
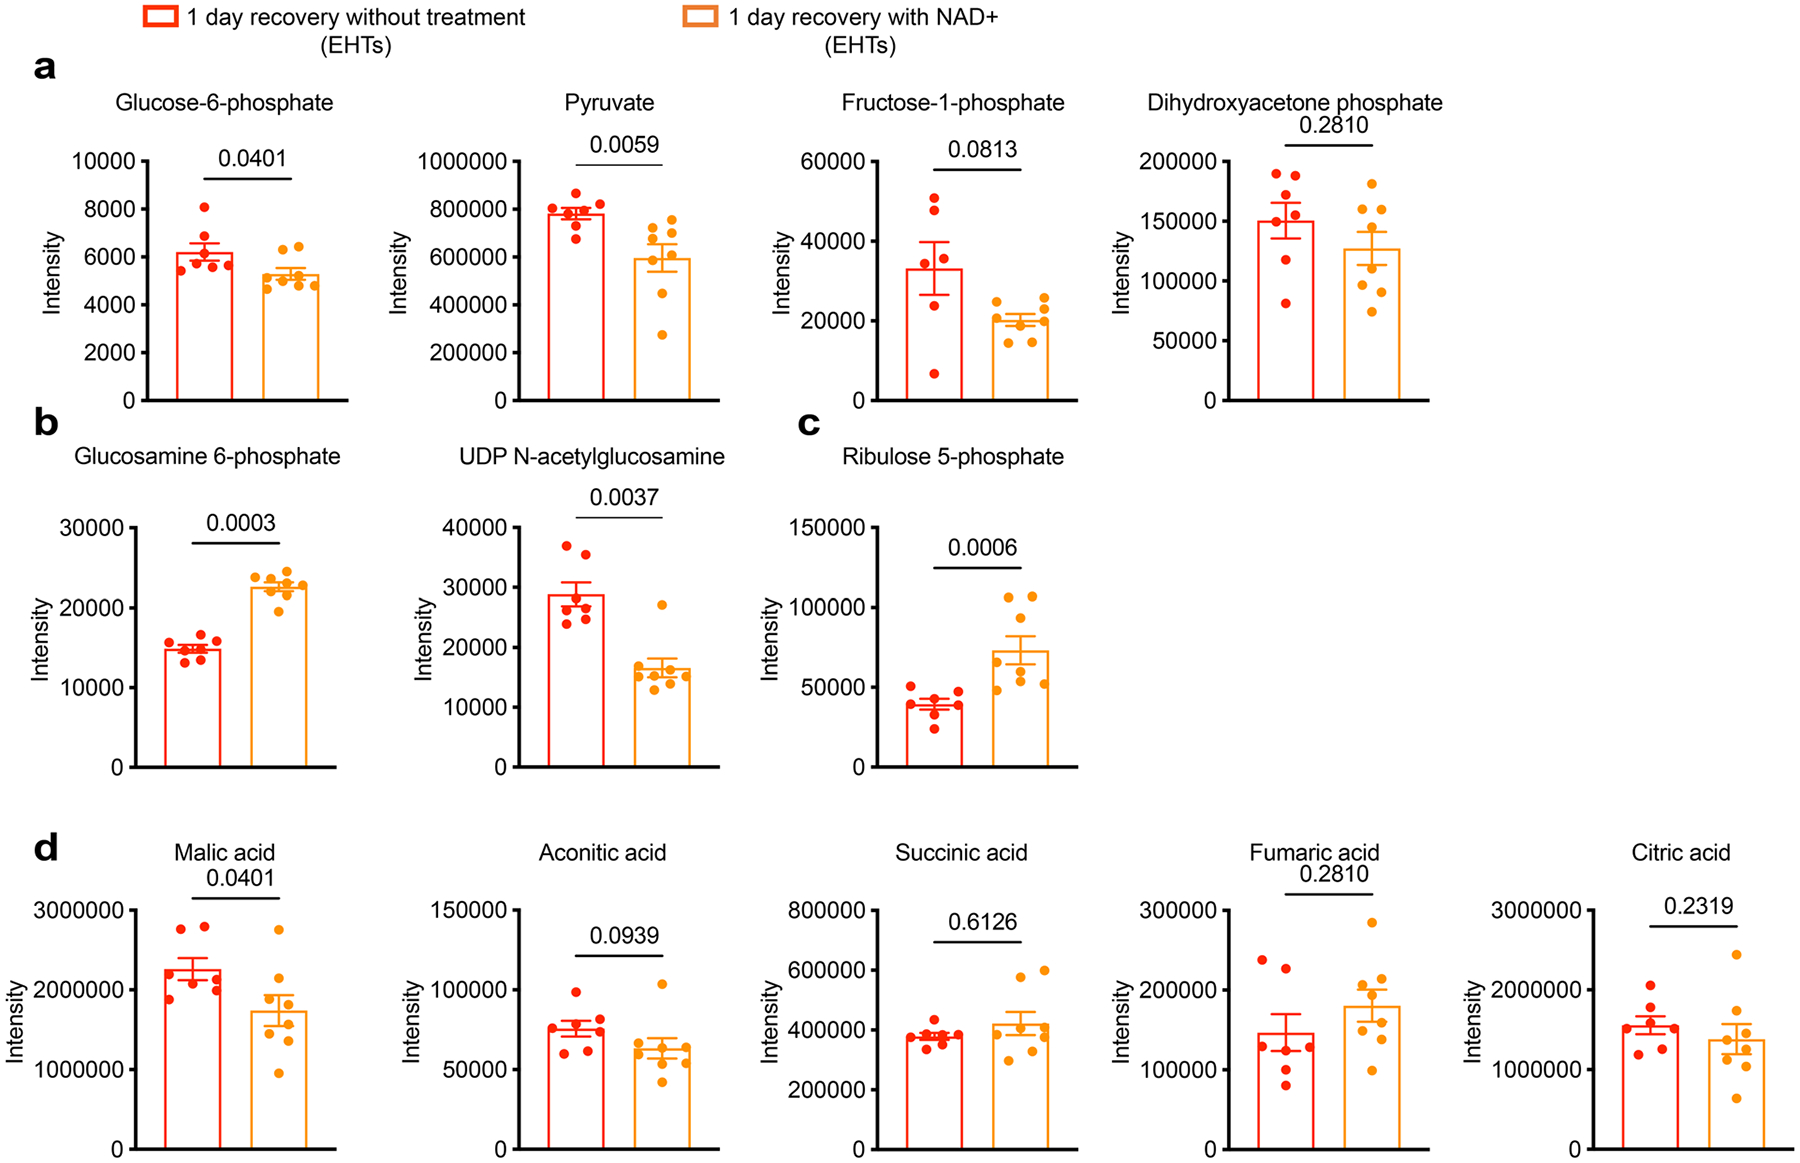
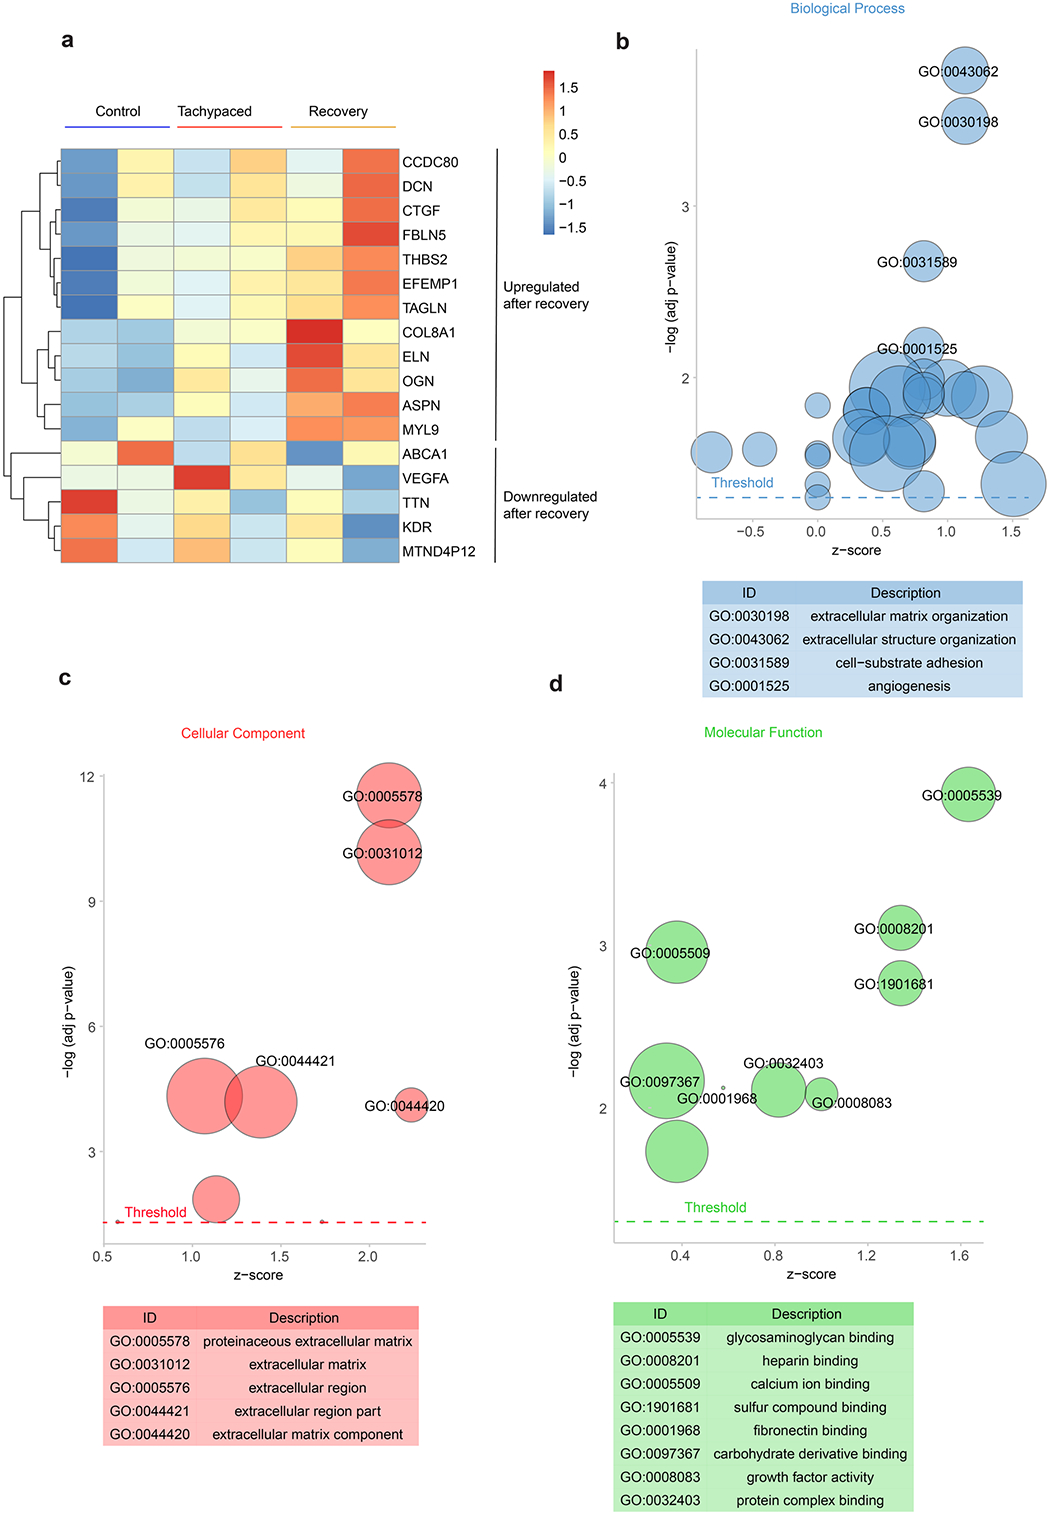
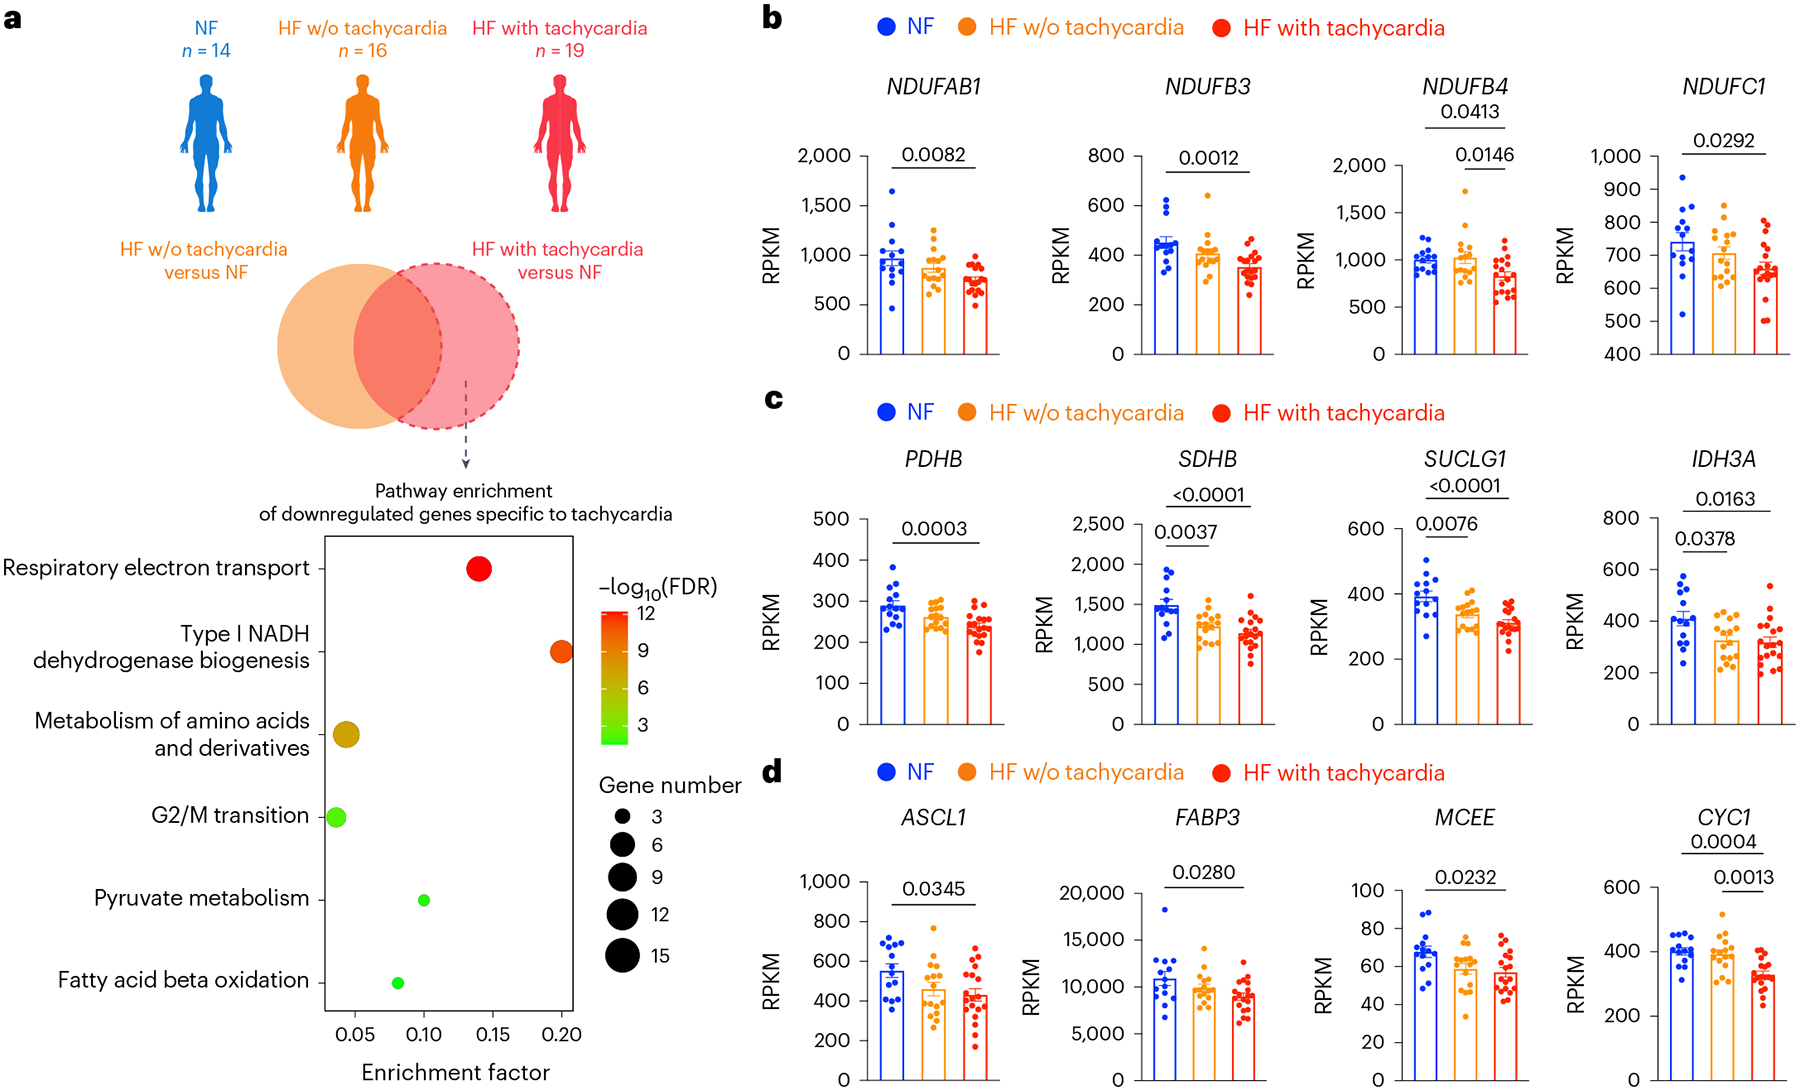
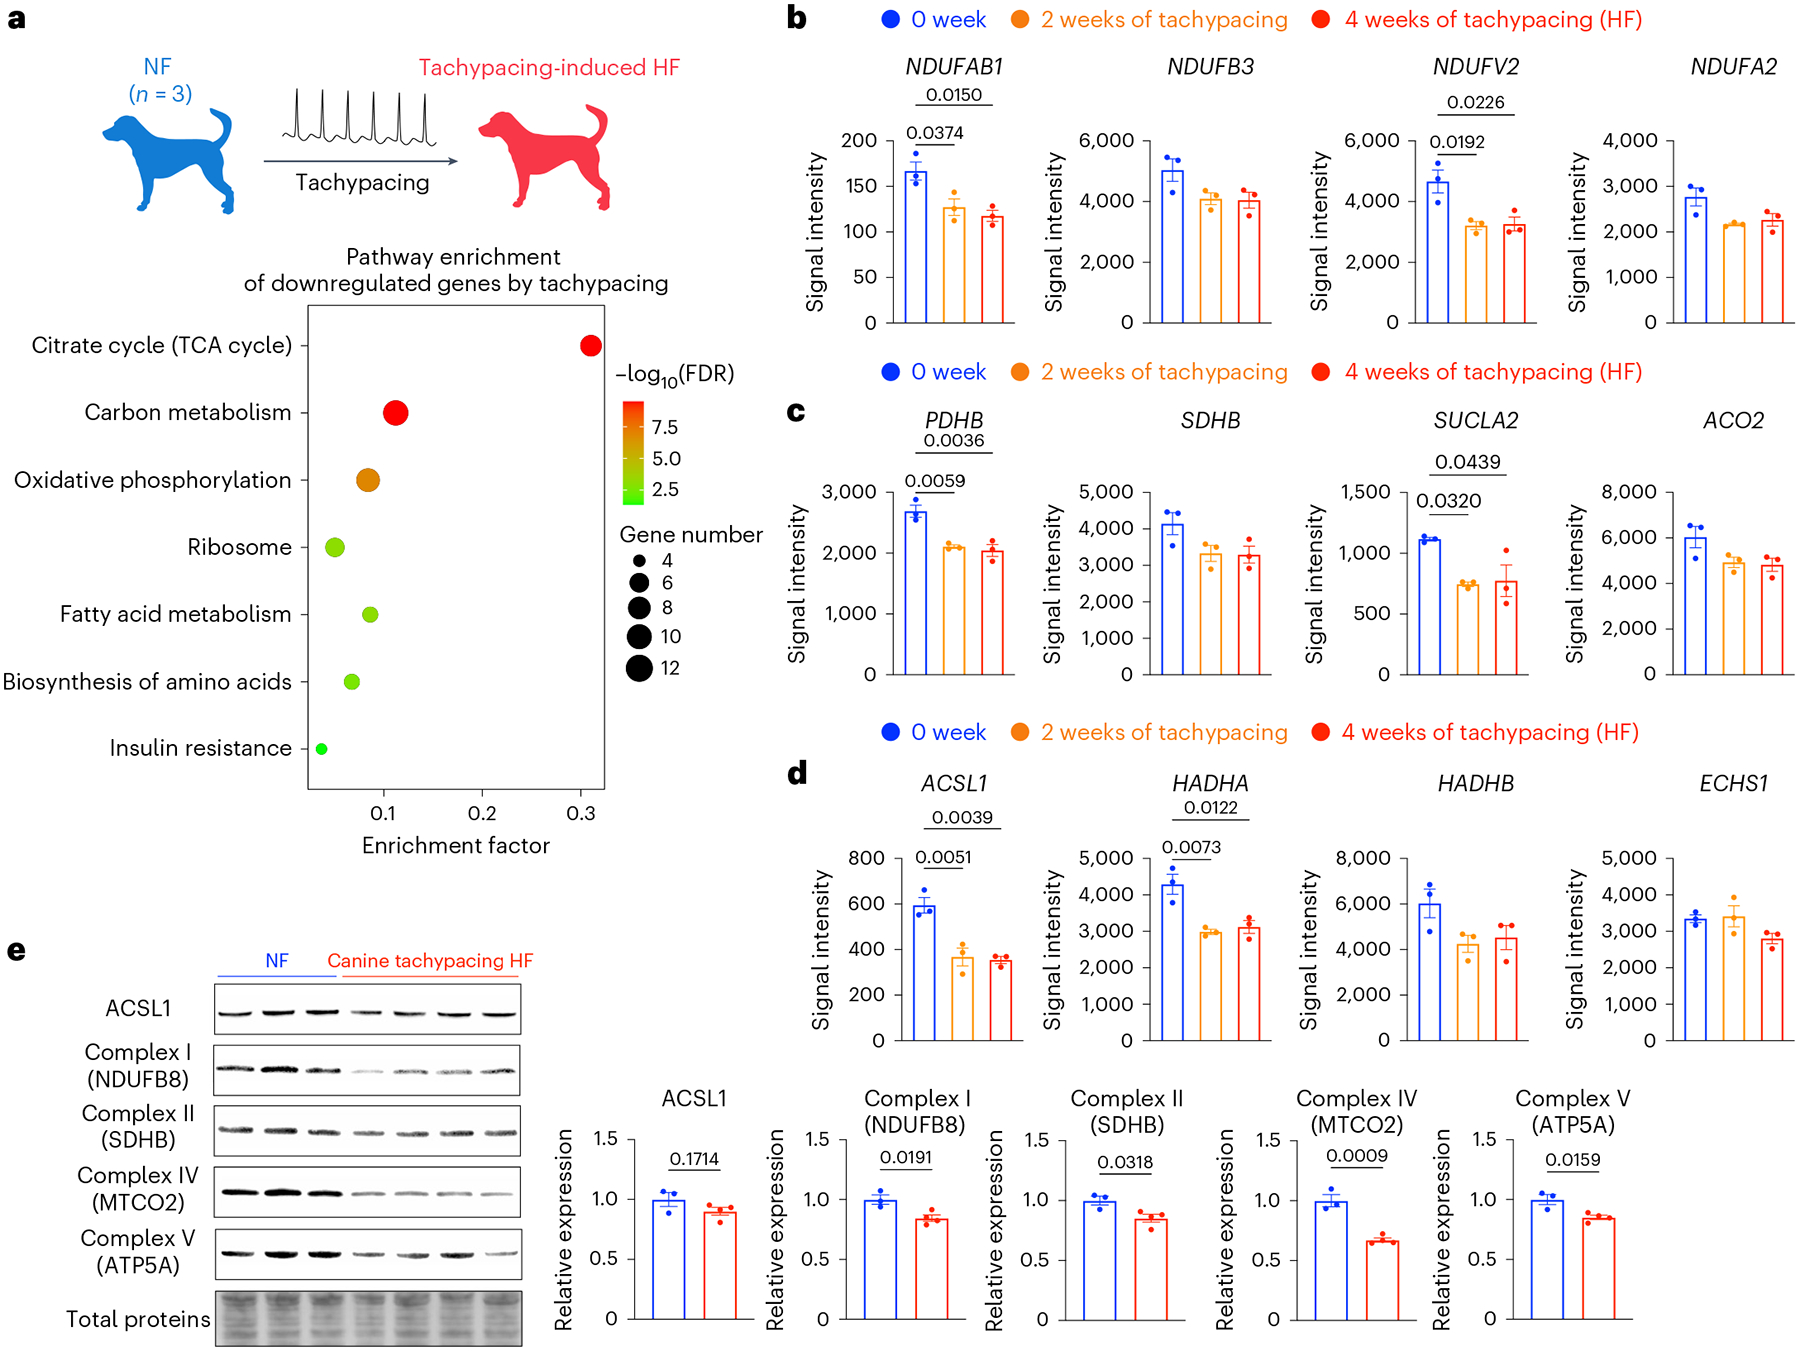
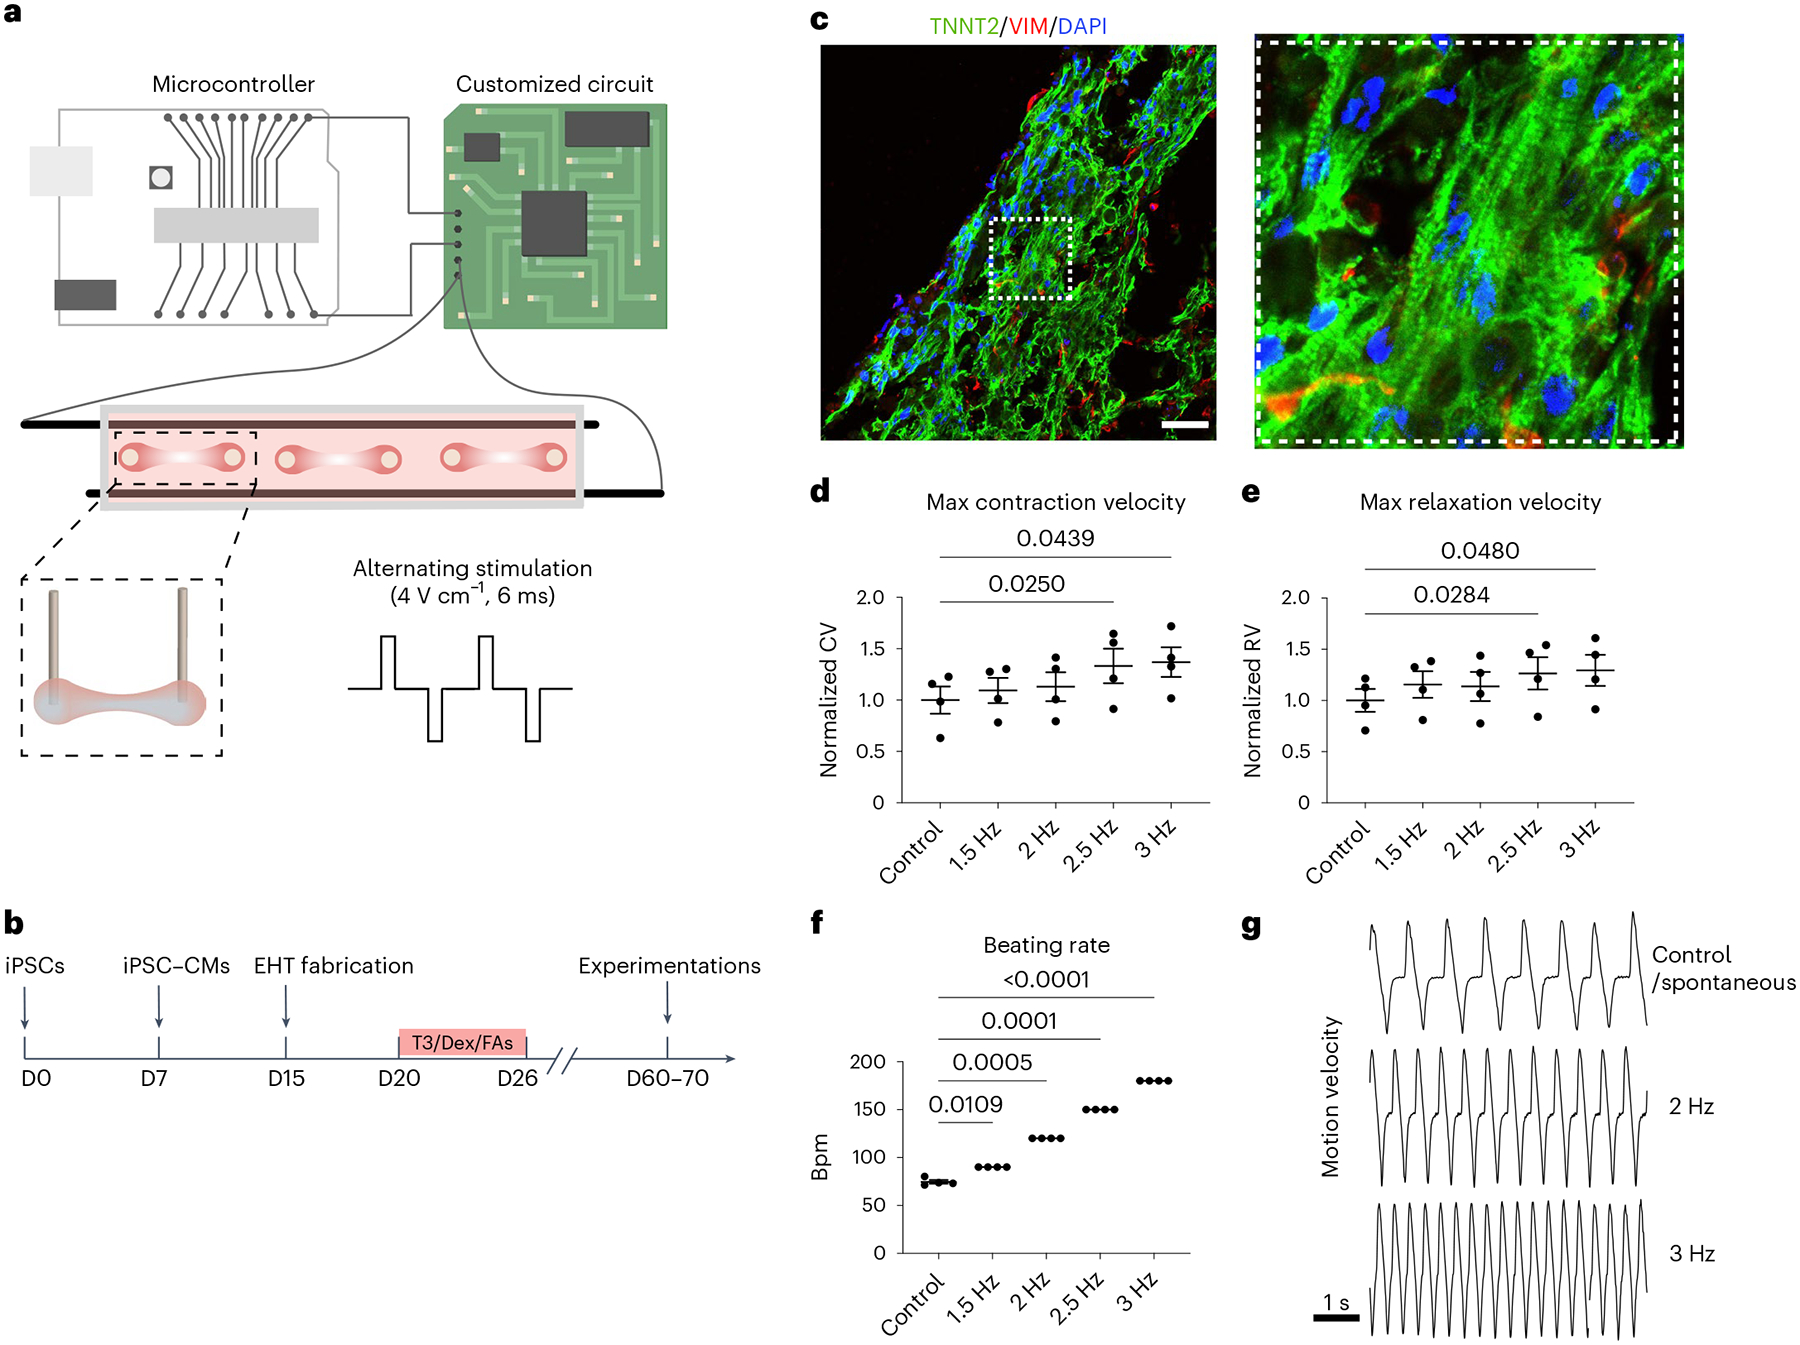
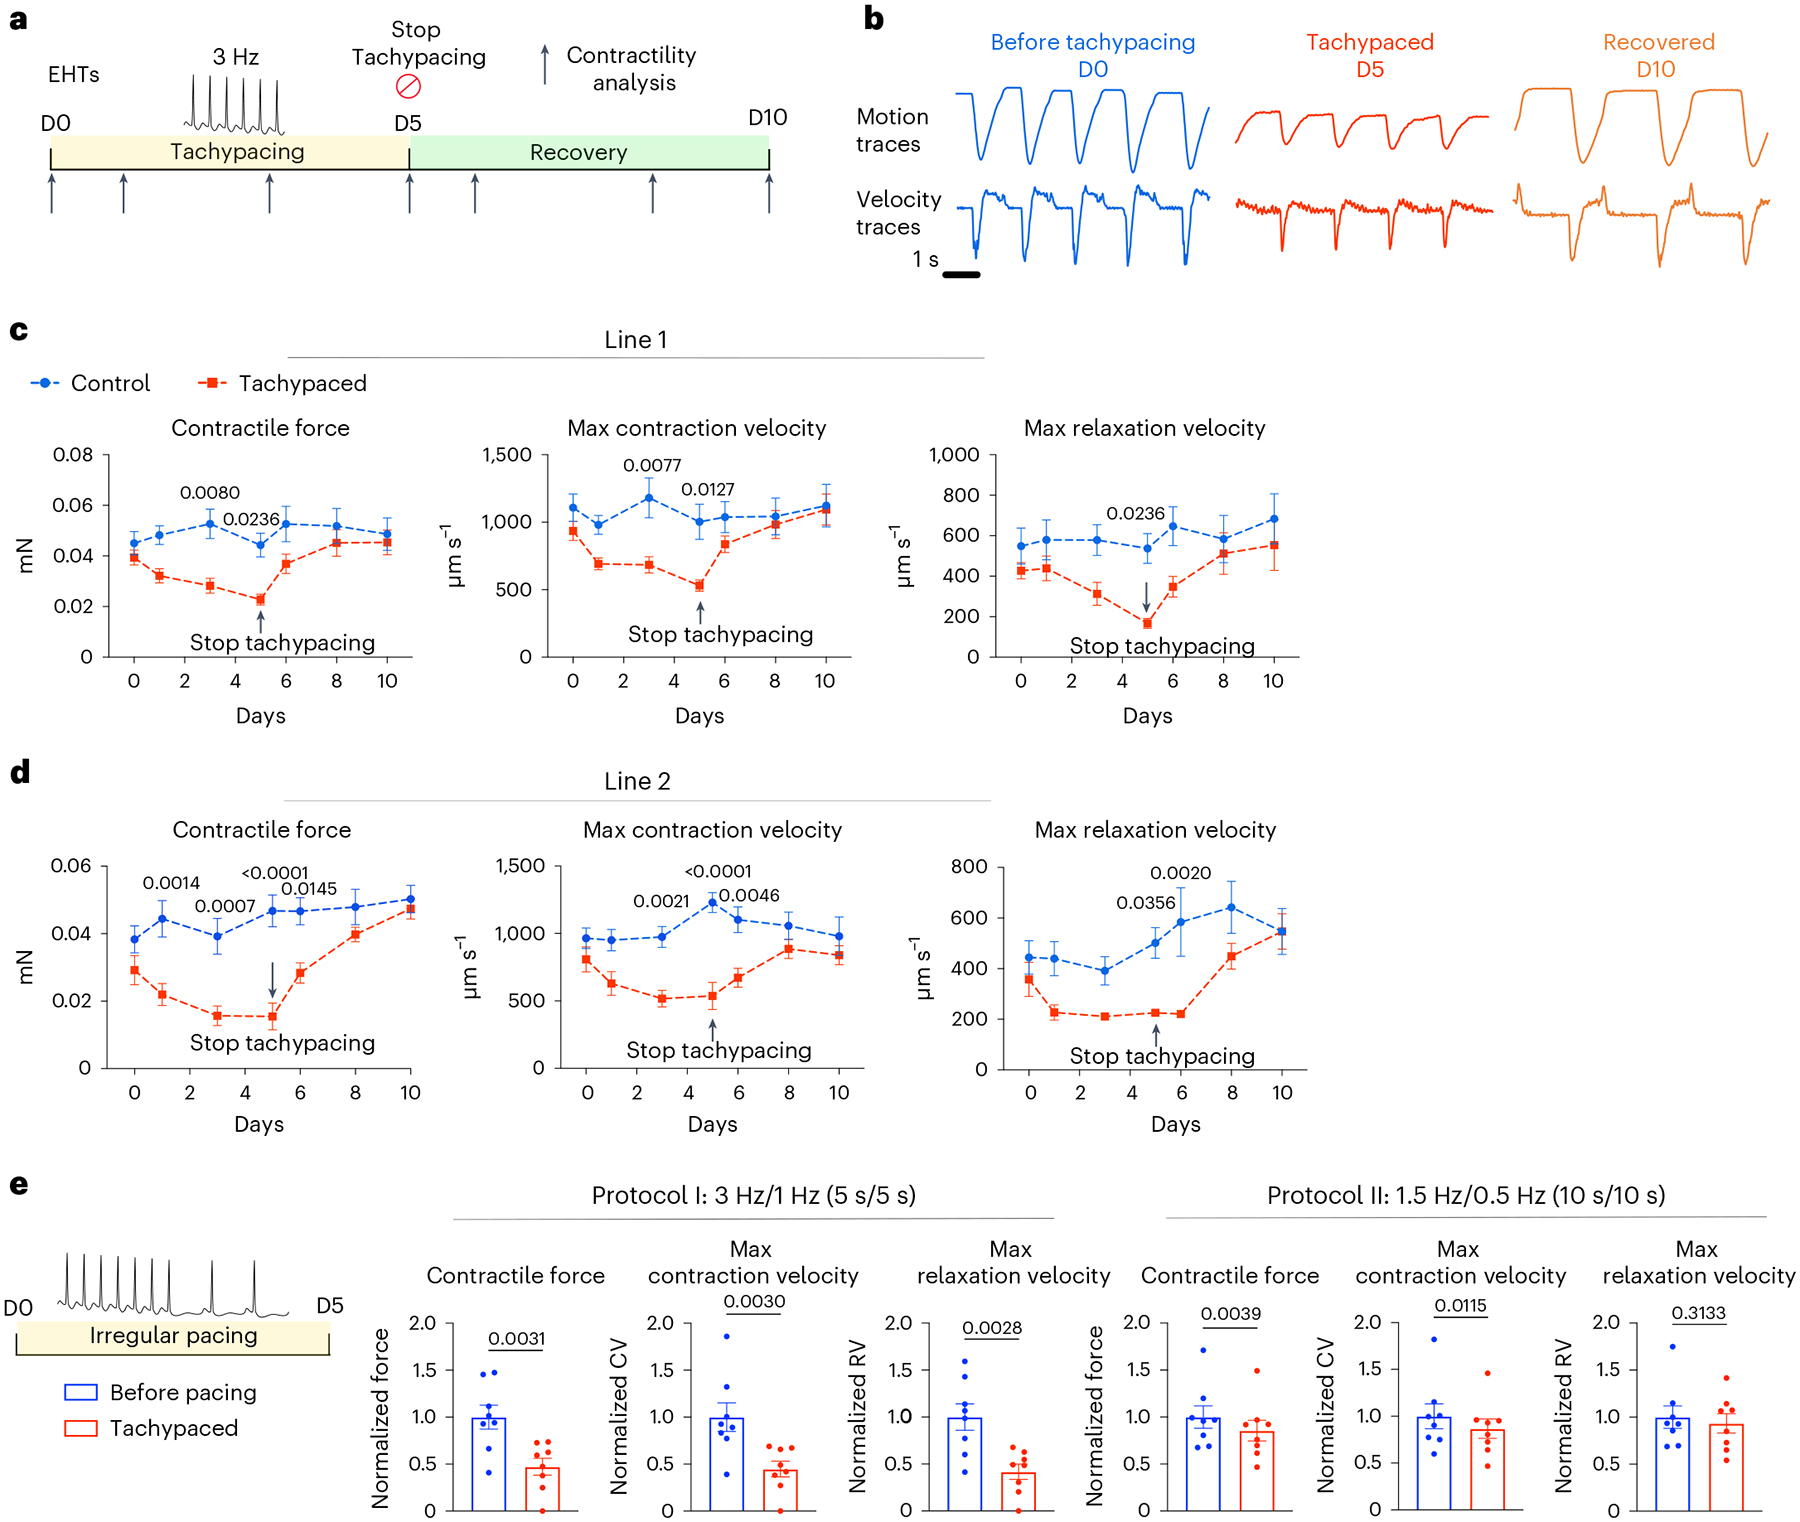
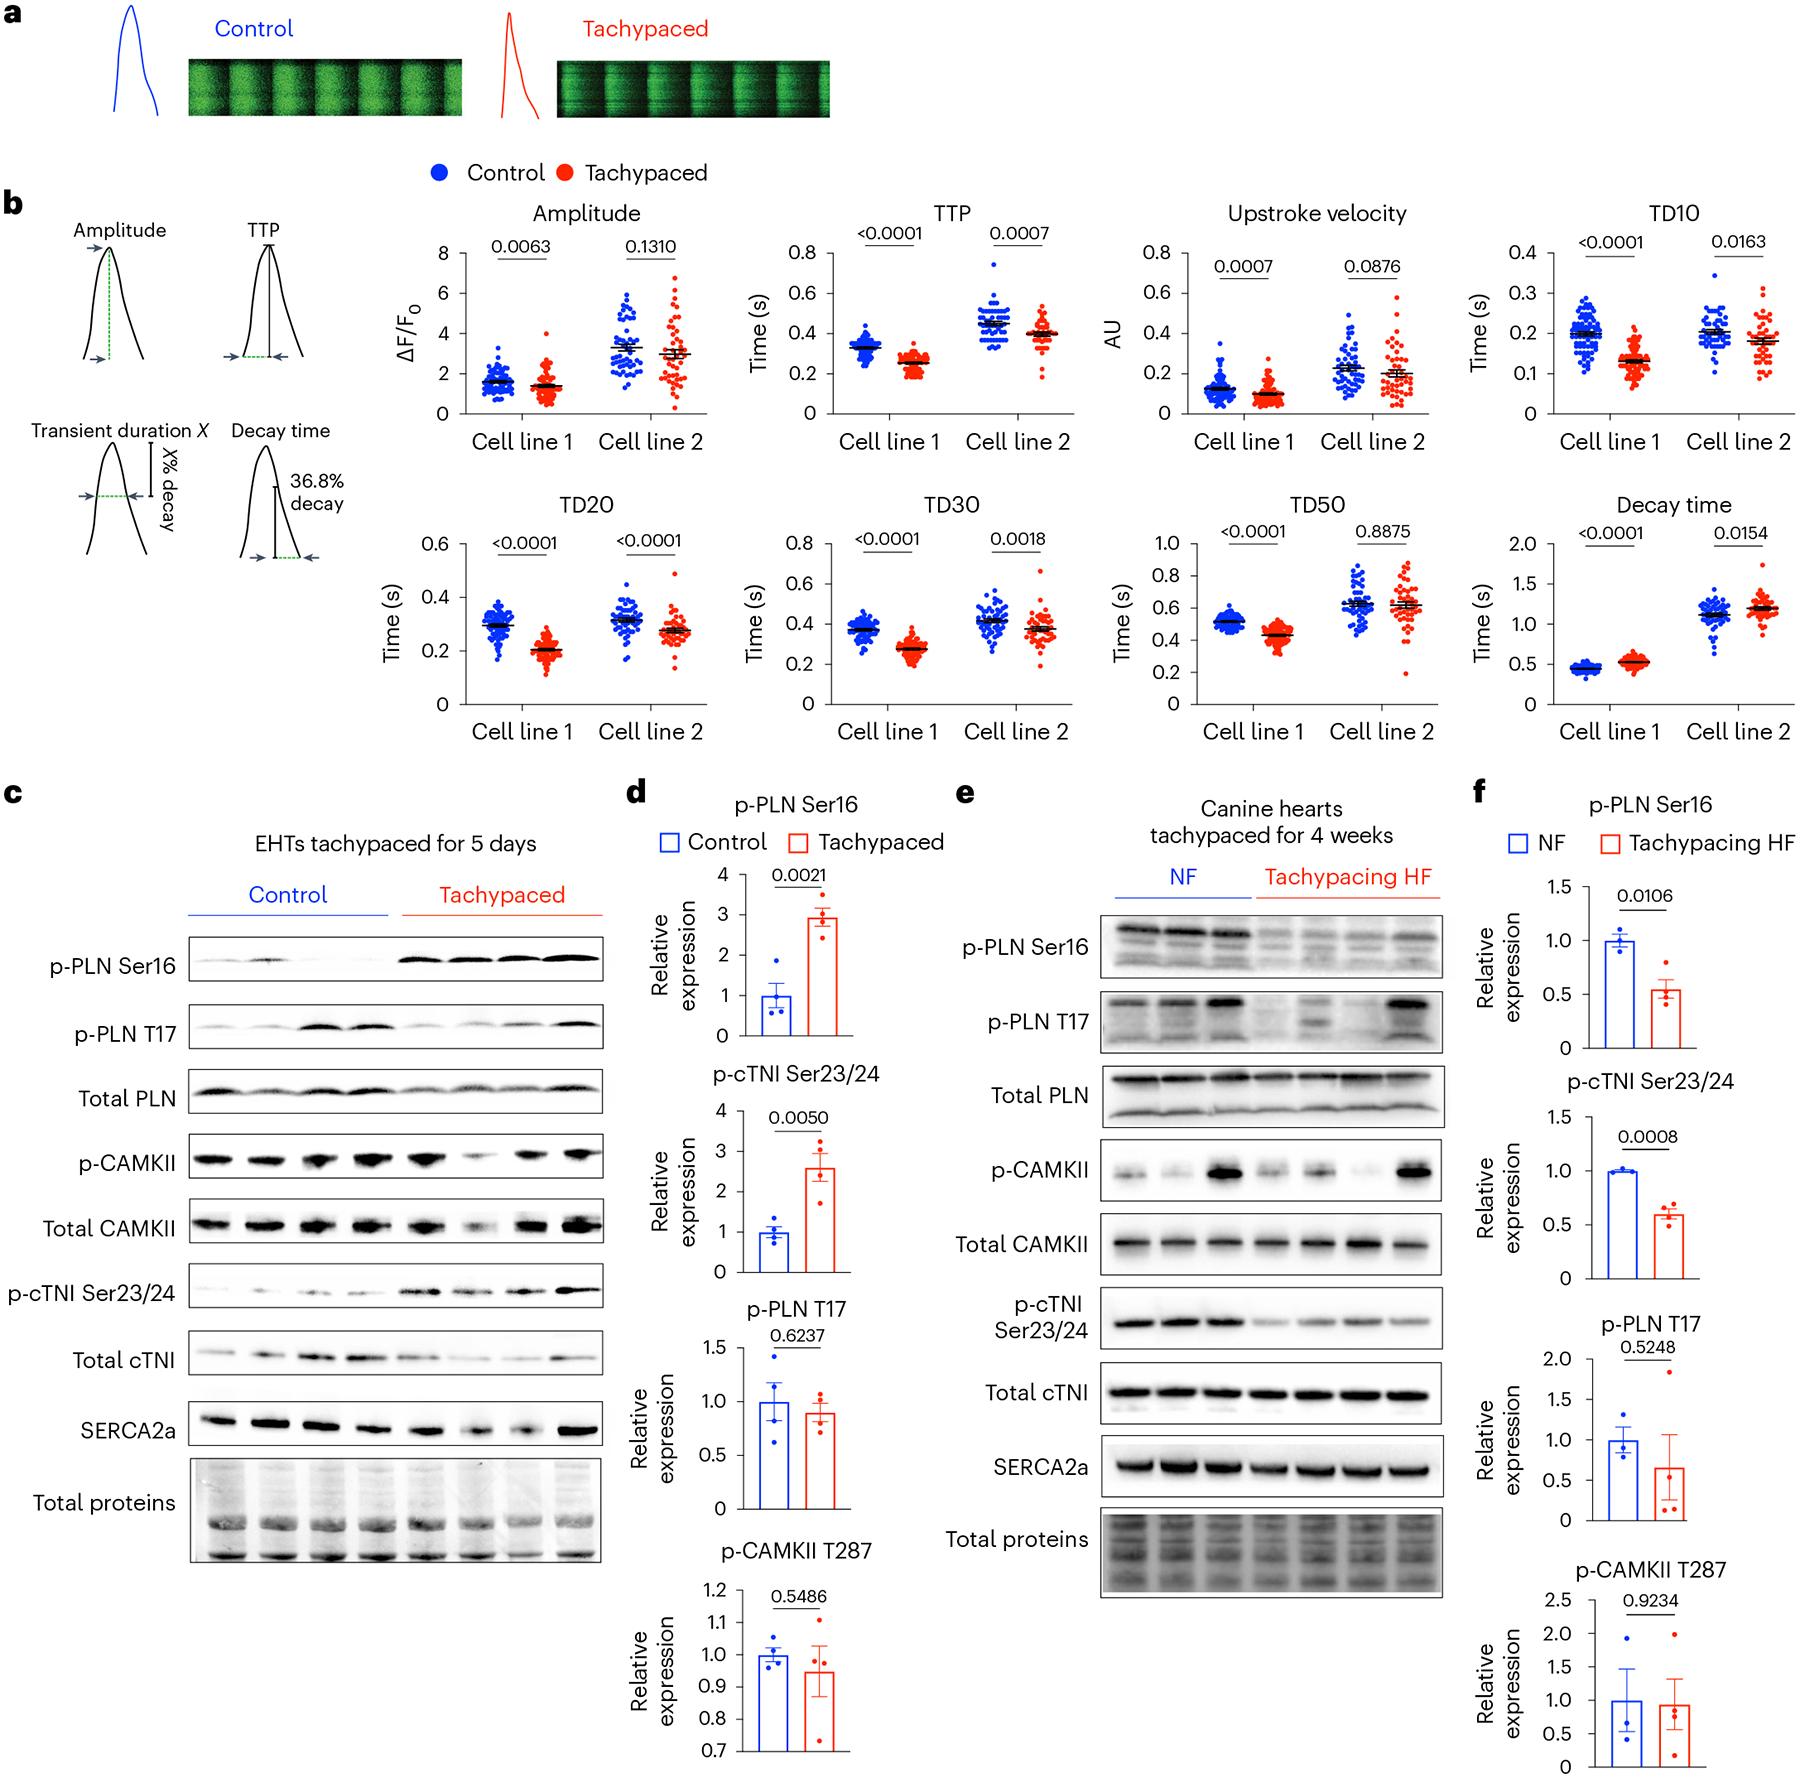
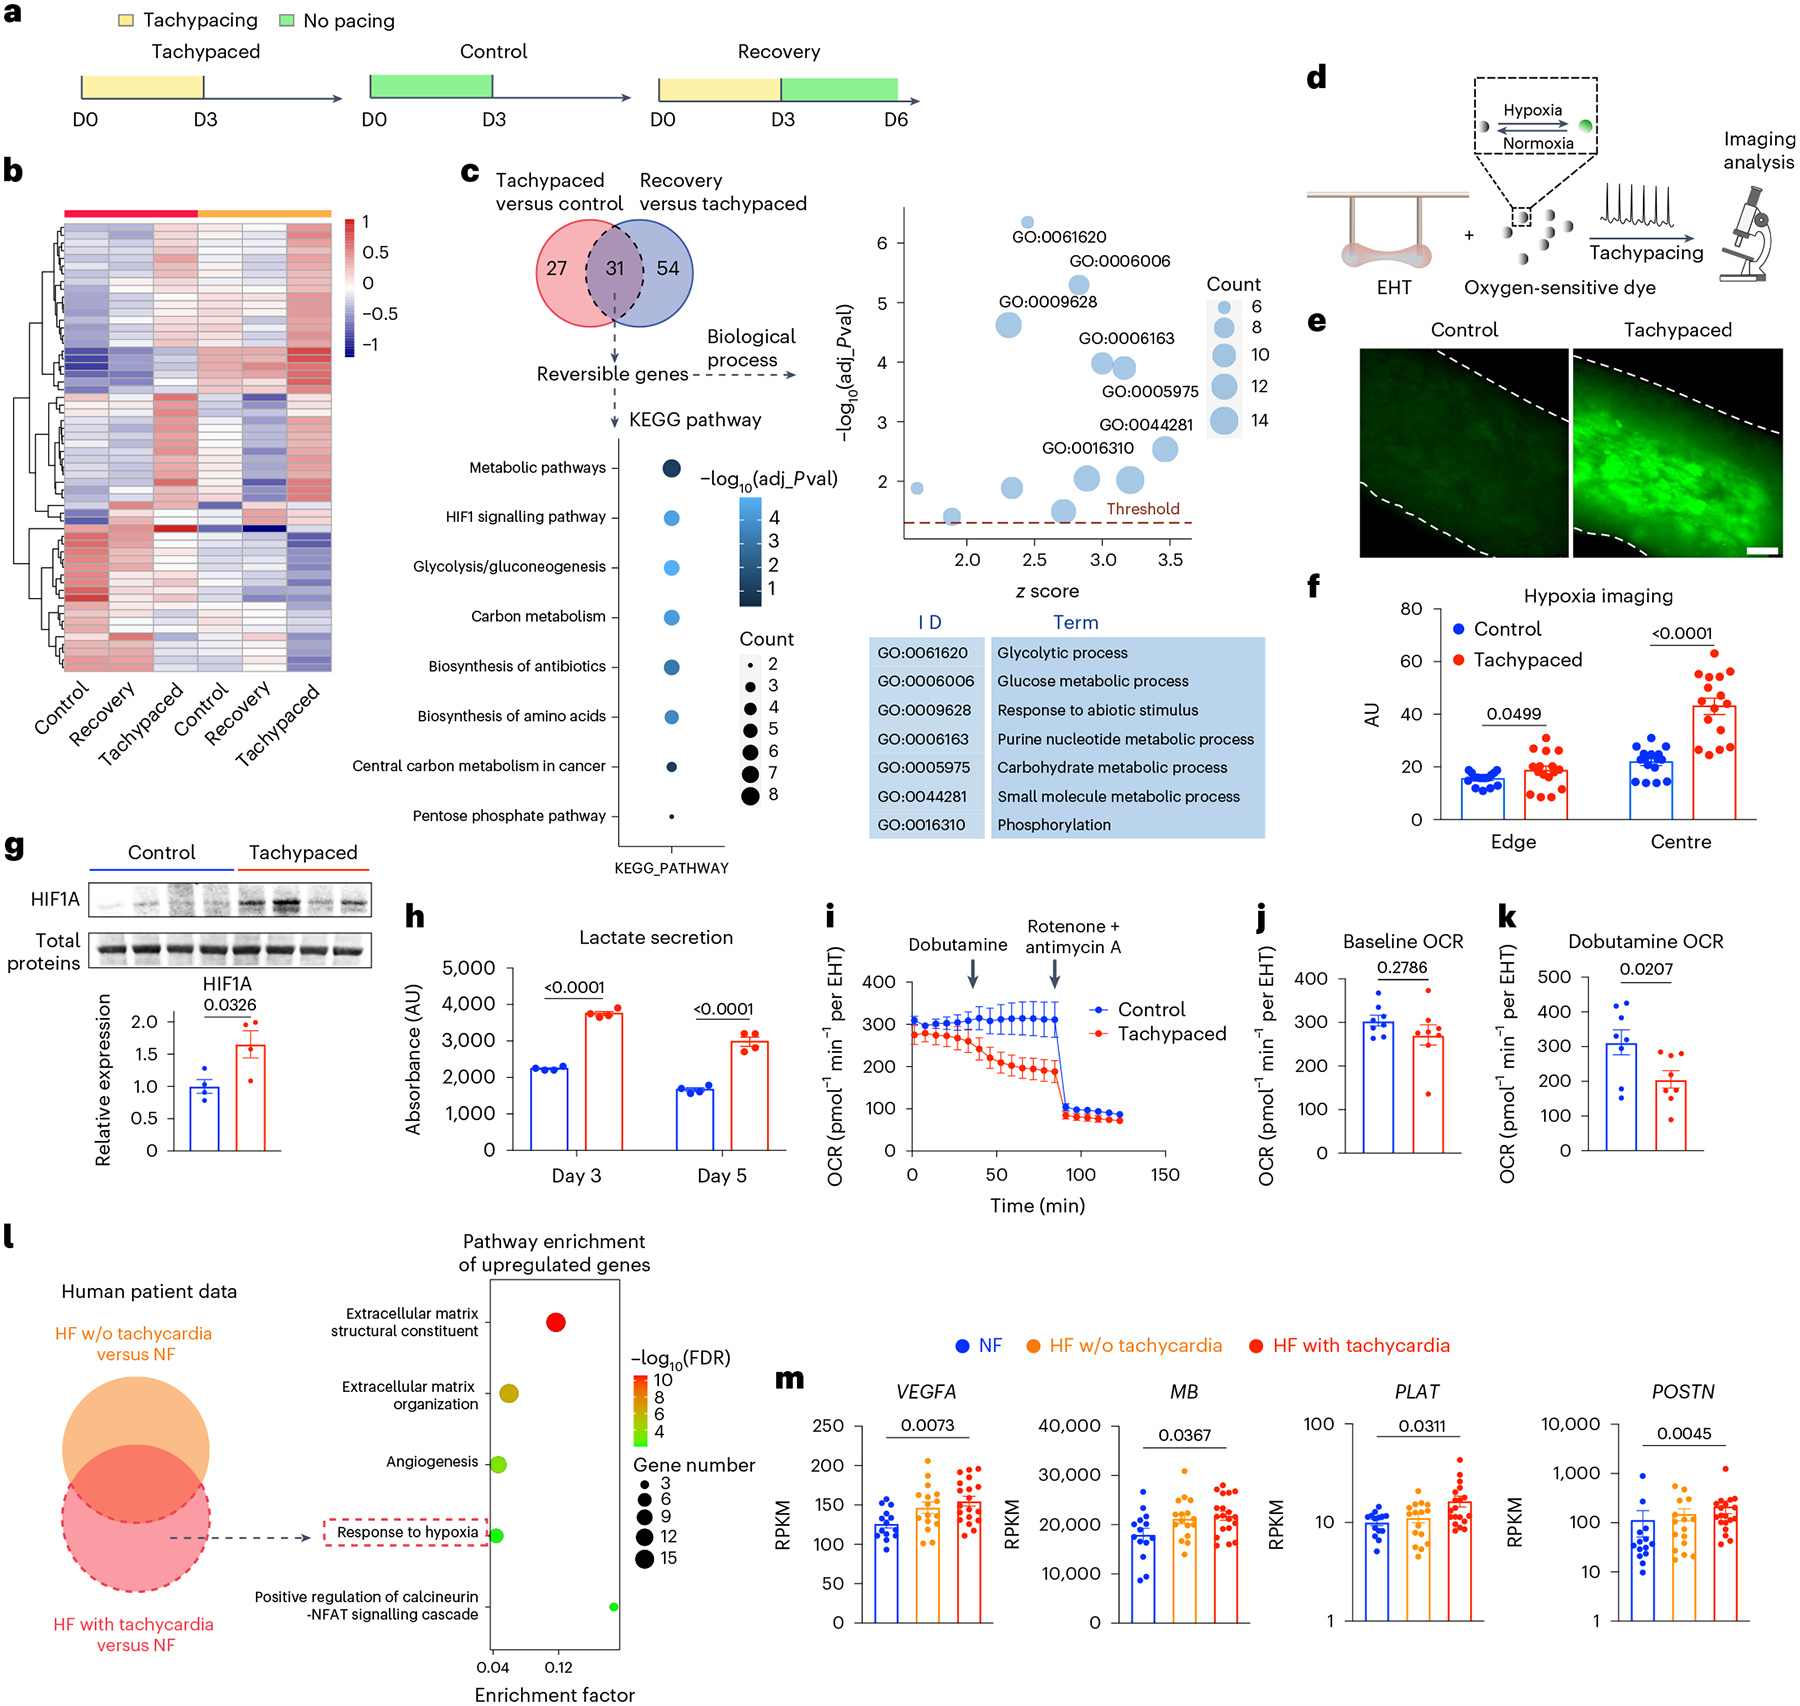
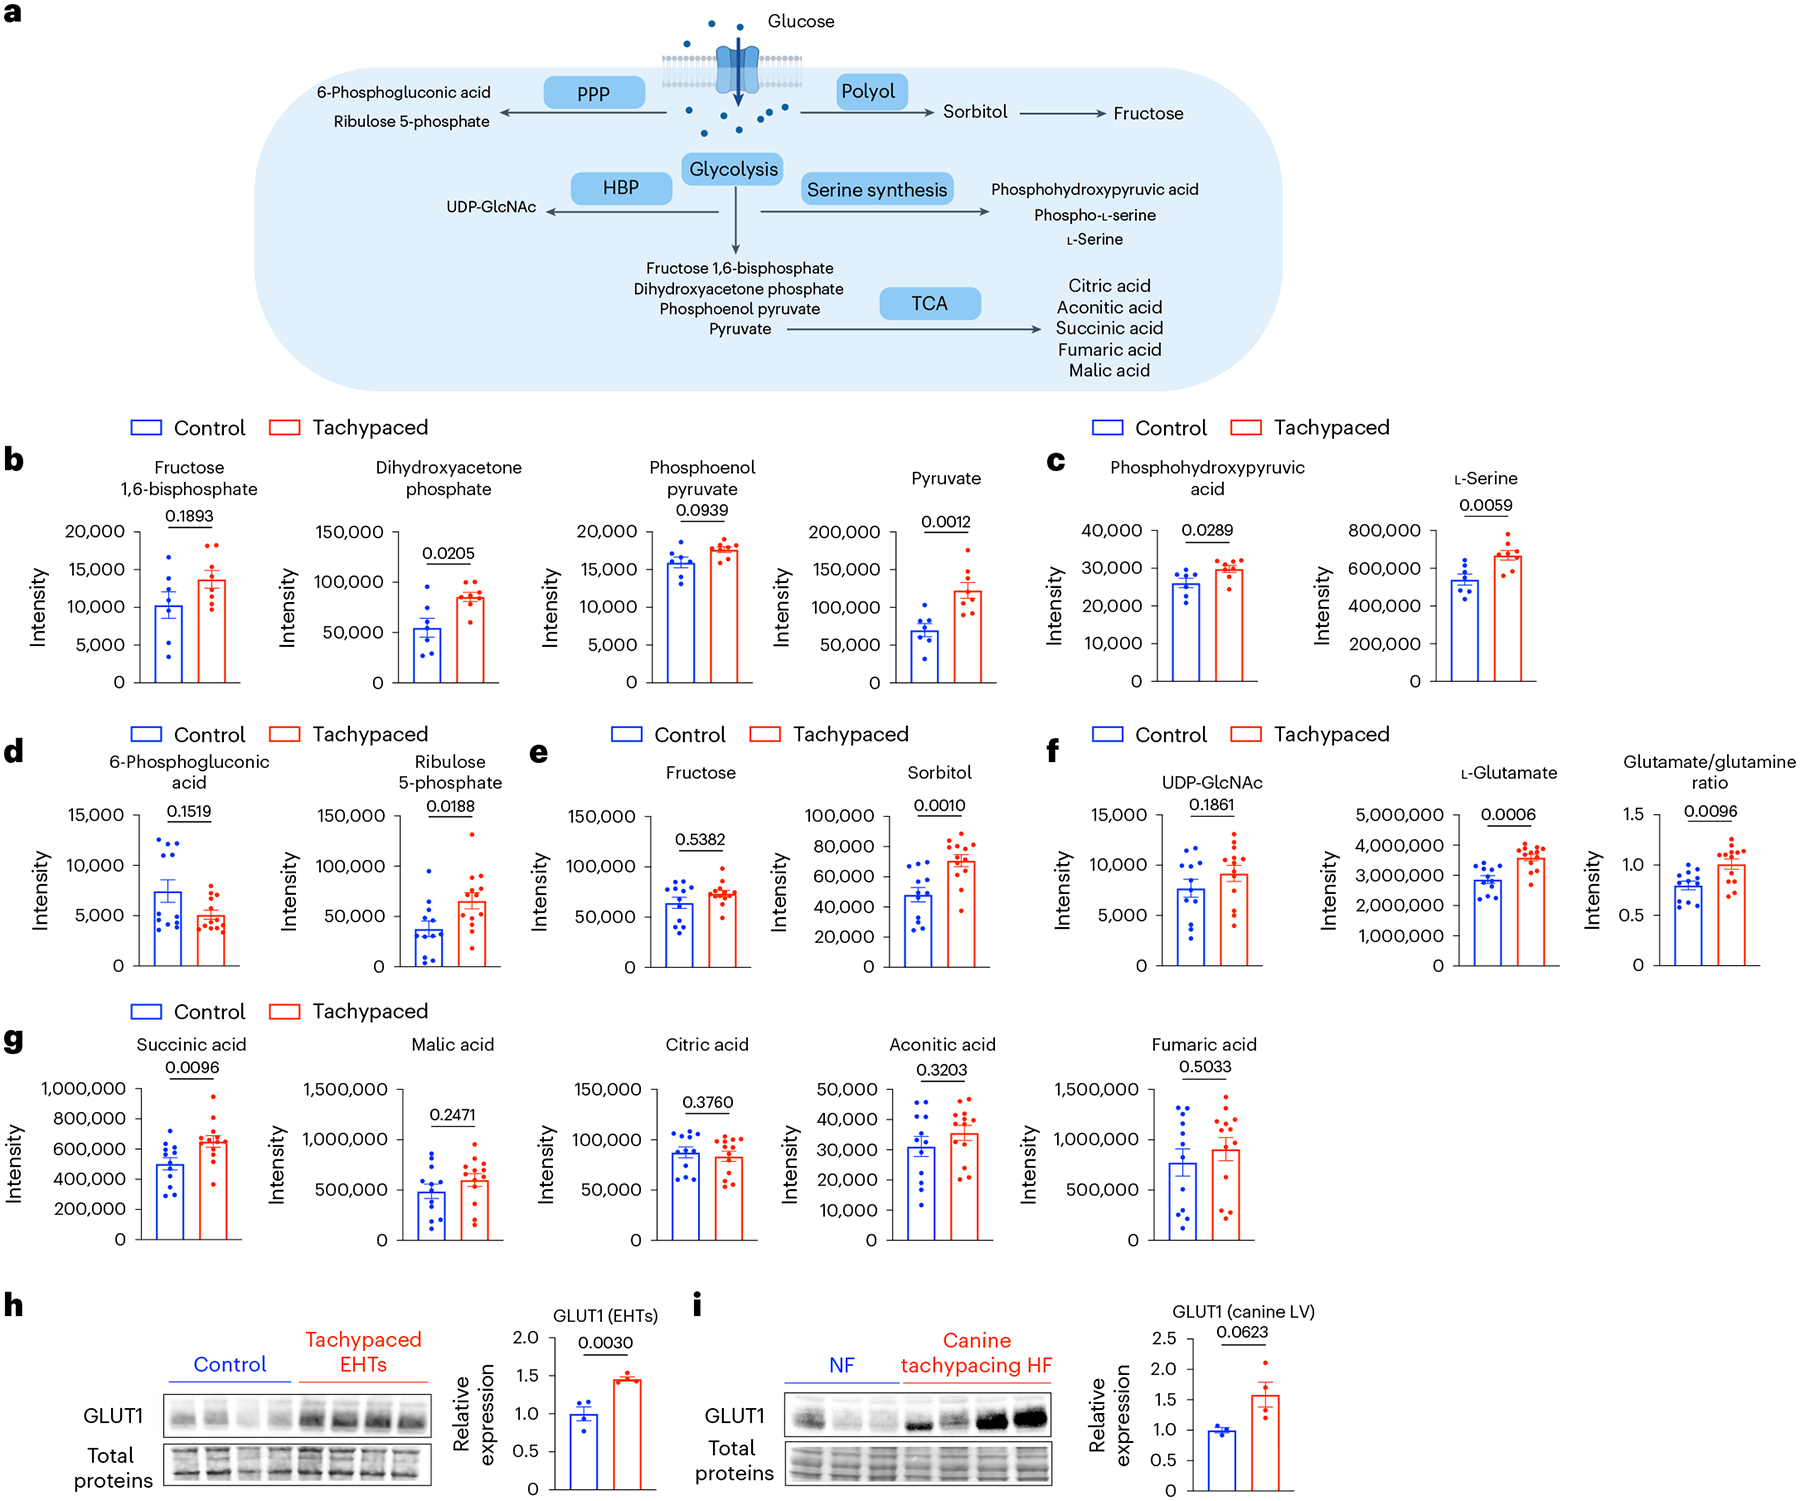
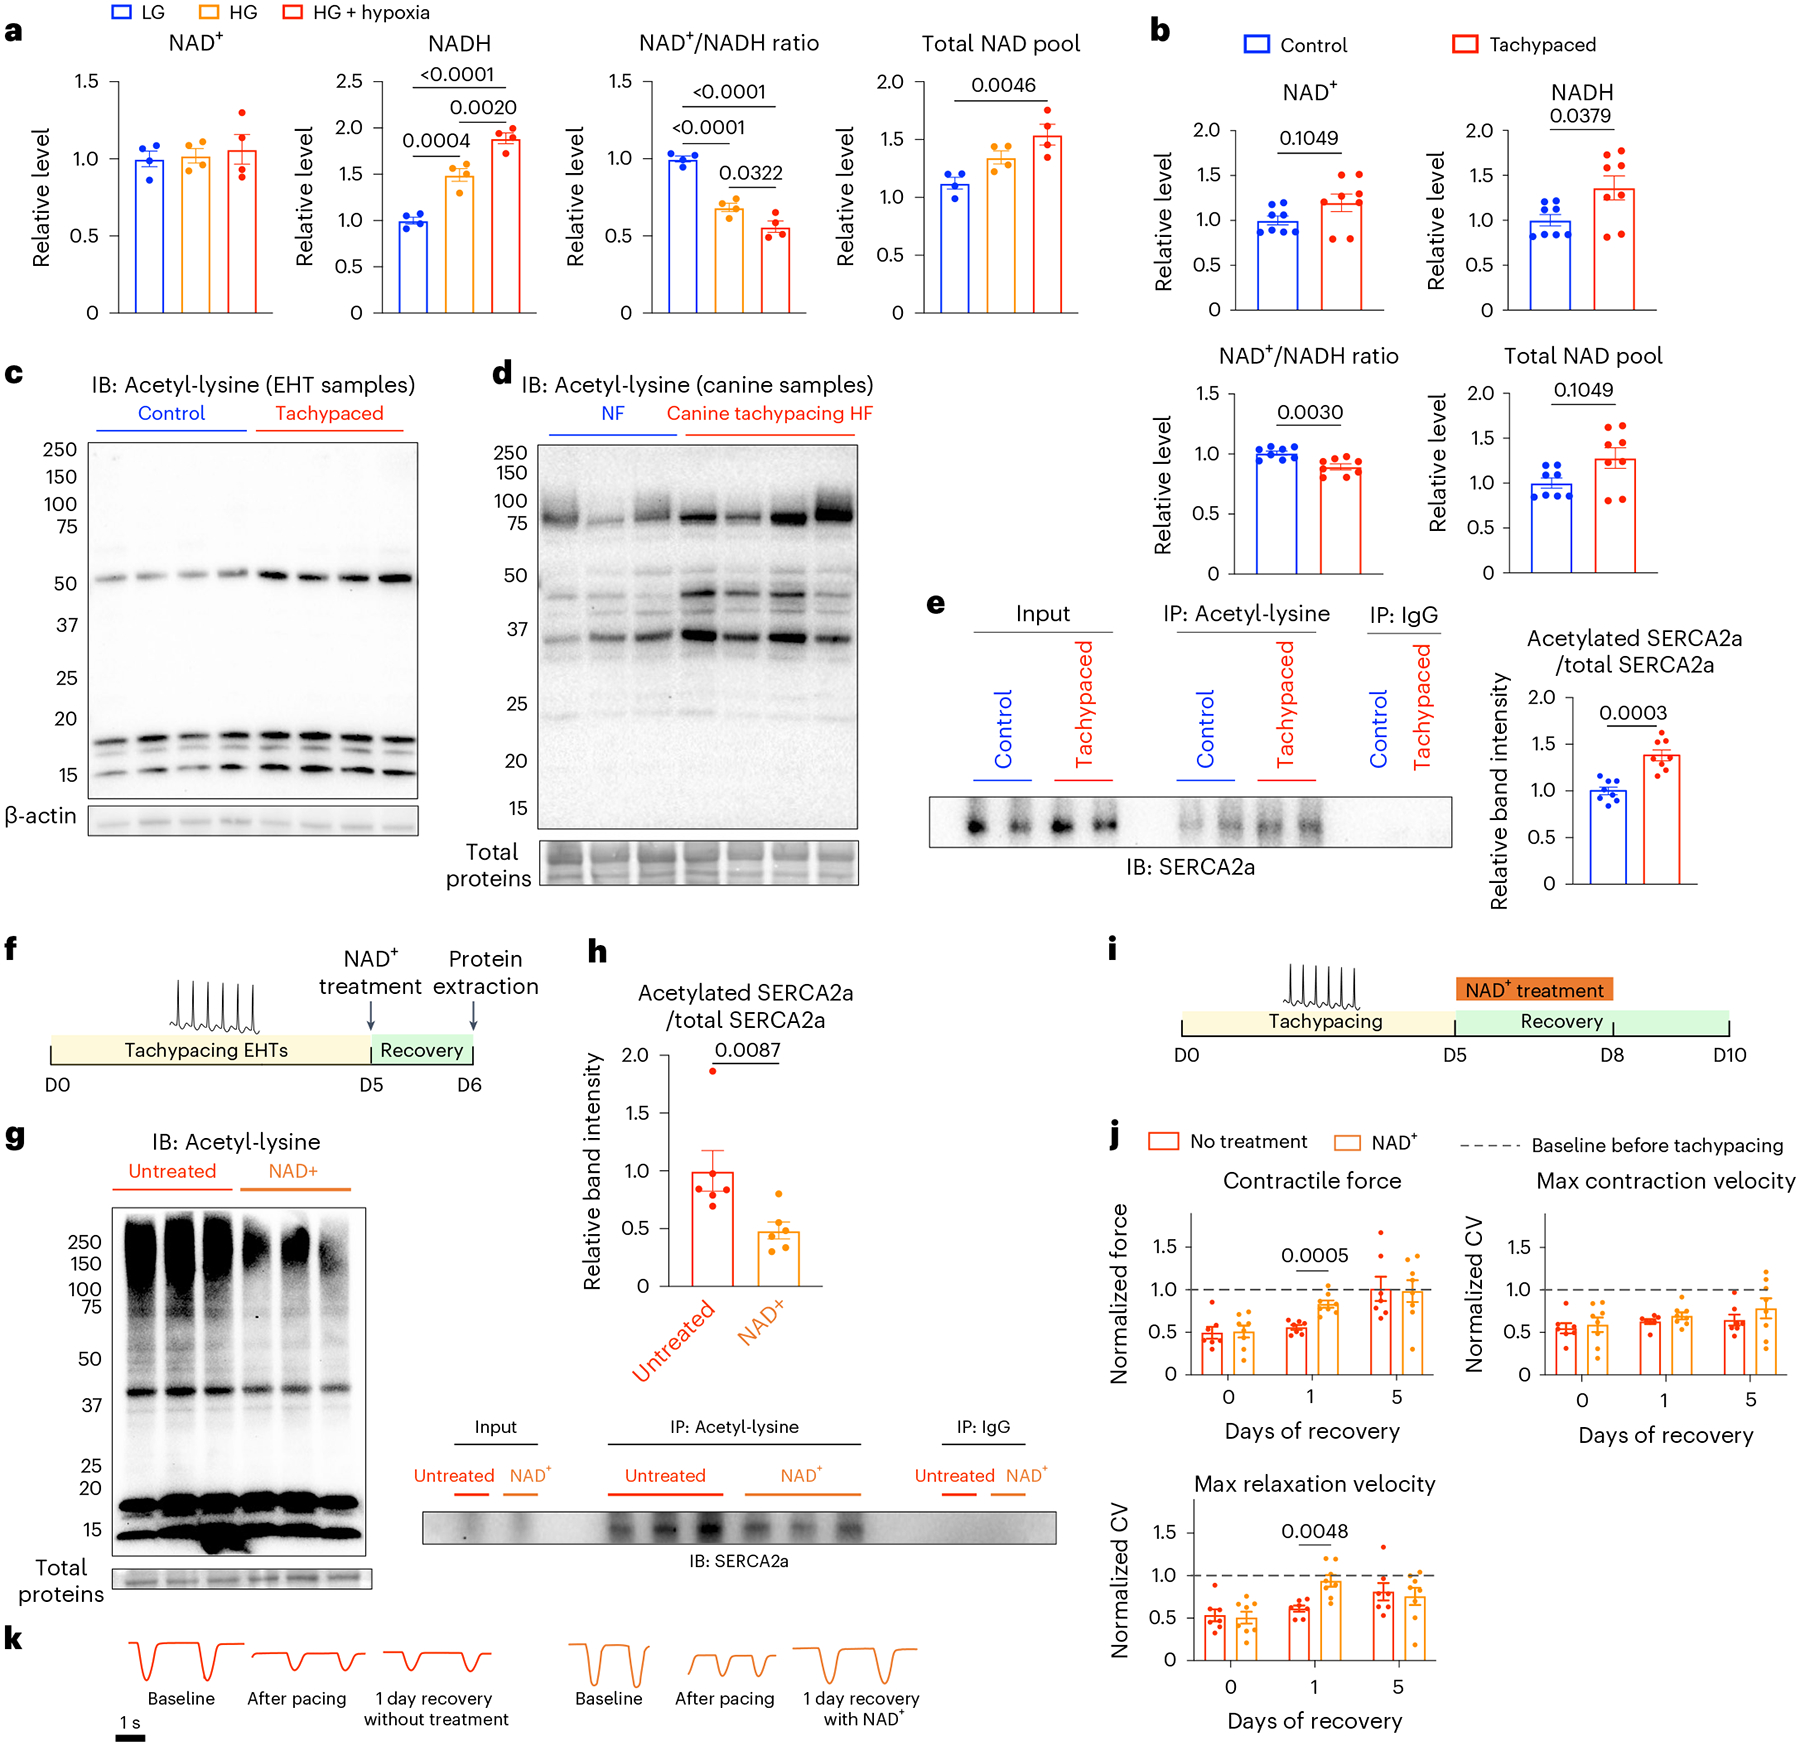
Prolonged tachycardia-a risk factor for cardiovascular morbidity and mortality-can induce cardiomyopathy in the absence of structural disease in the heart. Here, by leveraging human patient data, a canine model of tachycardia and engineered heart tissue generated from human induced pluripotent stem cells, we show that metabolic rewiring during tachycardia drives contractile dysfunction by promoting tissue hypoxia, elevated glucose utilization and the suppression of oxidative phosphorylation. Mechanistically, a metabolic shift towards anaerobic glycolysis disrupts the redox balance of nicotinamide adenine dinucleotide (NAD), resulting in increased global protein acetylation (and in particular the acetylation of sarcoplasmic/endoplasmic reticulum Ca2+-ATPase), a molecular signature of heart failure. Restoration of NAD redox by NAD+ supplementation reduced sarcoplasmic/endoplasmic reticulum Ca2+-ATPase acetylation and accelerated the functional recovery of the engineered heart tissue after tachycardia. Understanding how metabolic rewiring drives tachycardia-induced cardiomyopathy opens up opportunities for therapeutic intervention.


Conflict of interest statement

Competing interests

J.C.W. is a co-founder and scientific advisory board member of Greenstone Biosciences. All other authors declare no competing interests.

Figures

Extended Data Fig. 1 |
Extended Data Fig. 1 |. Clinical characteristics of the patient cohorts.
a, Gender, age, and common co-morbidities of the patients. n = 14 patients without heart failure, 16 patients with heart failure, and 19 patients with heart failure and tachycardia. The number of patients with or without a co-morbidity is indicated by red or blue boxes respectively. b, Summary of medical therapies used on the patients. The number of patients using or not using a therapy is indicated by red or blue boxes respectively.
Extended Data Fig. 2 |
Extended Data Fig. 2 |. Improved iPSC-CM maturation by hormone and fatty acid supplementation.
Treatment of human iPSC-CMs (SCVI-273) with a maturation media containing triiodothyronine (10 nM), dexamethasone (1 μM), oleic acid (30 μM), and palmitic acid (80 μM) for 6 days promoted the maturation of iPSC-CMs. a, qPCR analysis of maturation markers in iPSC-CMs with or without the maturation treatment. n = 3 technical replicates. Unpaired Student’s t-test. b, Western blot analysis of OXPHOS proteins in EHTs with or without the maturation treatment, including NDUFB8, SDHB, ubiquinol-cytochrome c reductase core protein 2 (UQCRC2), MTCO2, and ATP5A. n = 4 EHTs per group. Unpaired Student’s t-test. c, Measurement of oxygen consumption rate (OCR) of iPSC-CMs with or without the maturation treatment. n = 17 wells. 10,000 cells/well. Two-tailed Mann–Whitney test. d, Analysis of calcium handling using Fluo-4 dye in iPSC-CMs with or without the maturation treatment. n = 31 immature cells and n = 30 mature cells. Two-tailed Mann–Whitney test. e, Contractility analysis of EHTs with or without the maturation treatment. n = 8 EHTs per group. Two-tailed Mann–Whitney test. For a, b, and e, data were normalized against the untreated cells or EHTs. Data are displayed as mean ± s.e.m.
Extended Data Fig. 3 |
Extended Data Fig. 3 |. Pacing at a physiological rate does not induce contractile dysfunction in EHTs.
EHTs (SCVI-273) were tachypaced or unpaced for 10 days and contractility measurements were performed on days 0, 2, 7, and 10. Functional parameters generated from the analysis include maximum contraction velocity (a), maximum relaxation velocity (b), spontaneous beating rate (c), and contractile force (d). n = 16 for unpaced EHTs and n = 14 for paced EHTs. Two-way ANOVA with Bonferroni’s multiple comparisons test. Data are displayed as mean ± s.e.m.
Extended Data Fig. 4 |
Extended Data Fig. 4 |. Pharmacological suppression of the beating rate increase blunts the deterioration of EHT contractility.
a, Experimental outline: EHTs (SCVI-273) were tachypaced for 5 days with or without drug treatment. Contractility was measured before and after tachypacing. b, Effect of carvedilol (250 ng/mL) on the beating rate (unpaced or paced) and the contractile force of tachypaced EHTs. n = 4 EHTs per group. c, Effect of FK506 (5 μM) on the beating rate (unpaced or paced) and the contractile force of tachypaced EHTs. n = 8 EHTs for the beating rate measurements and n = 5 EHTs for contractile force measurements. d, Effect of ivabradine (5 μM) on the beating rate (unpaced or paced) and the contractile force of tachypaced EHTs. n = 4 untreated EHTs and n = 8 ivabradine-treated EHTs. Unpaired Student’s t-test. Data are displayed as mean ± s.e.m.
Extended Data Fig. 5 |
Extended Data Fig. 5 |. Hypertrophic cardiomyopathy (HCM) EHTs have increased sensitivity to tachypacing-induced contractile dysfunction.
a, Experimental outline: HCM (MYBPC3 mutation) EHTs (SCVI-591) were tachypaced at 3 Hz for 5 days, then allowed to recover for 5 days. Contractile force (b), maximum contraction velocity (c), maximum relaxation velocity (d), and beating rate (e) were measured before tachypacing, 5 days after tachypacing, 1 day, 2 days, and 5 days after recovery. Data points of beating rates for EHTs that stopped beating were not shown. Data were normalized against the baseline values from day 0. n = 11 EHTs. One-way paired ANOVA with Tukey’s multiple comparison test. Only comparisons with day 0 are shown for statistical significance. *: P < 0.05; **: P < 0.01; ***: P < 0.001. Data are displayed as repeated measures of each EHT’s contractility over time.
Extended Data Fig. 6 |
Extended Data Fig. 6 |. Functional changes in the canine model of tachypacing-induced HF.
Functional parameters including: ejection fraction, heart rate, dp/dt max, systolic pressure, end-diastolic pressure and end-diastolic diameter were measured in healthy (NF) and tachypaced dogs (HF). n = 3 NF dogs and n = 4 HF dogs. Unpaired Student’s t-test. Data are displayed as mean ± s.e.m.
Extended Data Fig. 7 |
Extended Data Fig. 7 |. Reversible activation of glycolysis and hypoxia genes by tachypacing.
Tachypaced EHTs, unpaced control EHTs, and EHTs recovered from tachypacing were subjected to qPCR analysis for DEGs identified through RNA-Seq. Expression levels were normalized against the control EHTs. n = 3 technical replicates. One-way ANOVA with Bonferroni’s multiple comparisons test. EHTs were generated from line SCVI-273. Data are displayed as mean ± s.e.m.
Extended Data Fig. 8 |
Extended Data Fig. 8 |. Hypoxia downregulates oxidative phosphorylation genes.
iPSC-CMs (SCVI-273) were exposed to hypoxia (<1% O2) for 24 hours. Expression of complex I genes was quantified with qPCR analysis, including NFUFAB1, NDUFAF1, NDUFA2, NDUFA3, NDUFB9, NDUFV1, NDUFS5 and NDUFB11. Expression levels were normalized against hypoxia-treated cells. n = 6 wells of cells. Unpaired Student’s t-test. Data are displayed as mean ± s.e.m.
Extended Data Fig. 9 |
Extended Data Fig. 9 |. Effect of NAD+ supplementation on glucose metabolites.
Metabolomic analysis of EHTs (SCVI-273) treated with 1 mM NAD+ or vehicle (water) for 1 day after tachypacing. a, Quantification of glycolysis metabolites: glucose-6-phosphate, pyruvate, fructose-1-phosphate and dihydroxyacetone phosphate. b, Quantification of HBP pathway metabolites: glucosamine-6-phosphate and UDP-GlcNAc. c, Quantification of PPP pathway metabolite: ribulose-5-phosphate. d, Quantification of TCA cycle metabolites: malic acid, aconitic acid, succinic acid, fumaric acid and citric acid. n = 7 untreated EHTs and n = 8 NAD+-treated EHTs. Two-tailed Mann–Whitney test. Data are displayed as mean ± s.e.m.
Extended Data Fig. 10 |
Extended Data Fig. 10 |. Upregulation of ECM remodelling genes in tachypaced EHTs after recovery.
The transcriptome of EHTs recovered from tachypacing was compared with the transcriptome of unpaced control EHTs (SCVI-273). a, Heatmap of the expression of DEGs. Gene ontology analysis for b) biological process, c) cellular component, and d) molecular function of the DEGs.
Fig. 1 |
Fig. 1 |. Tachycardia is associated with the downregulation of OXPHOS, TCA cycle and fatty acid oxidation in patients with HF.
a, Transcriptomic analysis of myocardial samples from human patients with non-failing hearts (NF; n = 14, 49.1 ± 8.6 years old, 11 males and 3 females), HF without (w/o) tachycardia (HF; n = 16, 46.5 ± 14.3 years old, 12 males and 4 females) and HF with tachycardia (n = 19, 51.3 ± 11.9 years old, 16 males and 3 females). Genes exclusively downregulated in patients of HF with tachycardia were analysed for pathway enrichment. Results are shown as a bubble plot. Bubble color and size represent false discovery rate (FDR) and gene number, respectively. b, Expression of OXPHOS genes NDUFAB1, NDUFB3, NDUFB4 and NDUFC1. c, Expression of TCA cycle genes PDHB, SDHB, SUCLG1 and IDH3A. d, Expression of fatty acid oxidation genes ACSL1, FABP3, MCEE and CYC1. In bd, the expression levels are shown in reads per kilobase of transcript per million mapped reads (RPKM). One-way ANOVA with Tukey’s multiple comparisons test. Data are displayed as mean ± s.e.m.
Fig. 2 |
Fig. 2 |. Tachypacing downregulates OXPHOS, TCA cycle and fatty acid oxidation in dogs.
a, Microarray analysis (GSE9794) of LV tissue from dogs with or without tachypacing-induced HF. Genes downregulated in tachypacing-induced HF were subjected to pathway enrichment analysis. b, Expression of OXPHOS genes NDUFAB1, NDUFB3, NDUFV2 and NDUFA2. c, Expression of TCA cycle genes PDHB, SDHB, SUCLA2 and ACO2. d, Expression of fatty acid oxidation genes ACSL1, HADHA, HADHB and ECHS1. In bd, the expression levels are shown as signal intensity. n = 3 dogs for each group. One-way ANOVA with Tukey’s multiple comparisons test. e, Western blot analysis of ACSL1 and OXPHOS proteins including NADH:ubiquinone oxidoreductase subunit B8 (NDUFB8), SDHB, mitochondrially encoded cytochrome c oxidase II (MTCO2) and ATP synthase F1 subunit alpha (ATP5A) in dogs with or without tachypacing-induced HF. Expression levels were normalized against the NF dogs. n = 3 NF dogs and 4 HF dogs, respectively. Unpaired Student’s t-test. Data are displayed as mean ± s.e.m.
Fig. 3 |
Fig. 3 |. Validation of the EHT tachypacing setup.
a, Schematic illustration of the customized pacing setup consisting of a microcontroller, a custom-built circuit and a culture chamber for EHTs. The direction of the stimulation current was altered after each pulse (4 V cm−1 and 6 ms pulse width). Parts of the illustration were created with BioRender. b, EHTs were generated from human iPSCs, matured with a combination of T3, Dex and fatty acids (FAs) supplementation and cultured until day (D) 60–70 for subsequent experimentations. c, Confocal images of an EHT cross-section immunostained for TNNT2 shown in green, and Vim shown in red; cell nuclei were stained by 4,6-diamidino-2-phenylindole (DAPI) shown in blue. Scale bar, 200 μm. d,e, High-speed videos of the beating EHTs from iPSC line SCVI-273 were taken to calculate maximum (max) contraction velocity (CV) (d) and maximum relaxation velocity (RV) (e) while the EHTs were subjected to an increasing stimulation frequency. For d and e, data were normalized against the unpaced control EHTs. f, The beating rate of the EHTs in response to electrical stimulation with an increasing frequency. g, Representative motion velocity traces of EHTs measured during spontaneous beating (control), 2 Hz pacing and 3 Hz pacing. n = 4 EHTs per group. One-way ANOVA with Dunnett’s multiple comparisons test. Data are displayed as mean ± s.e.m.
Fig. 4 |
Fig. 4 |. Tachypacing induces reversible contractile dysfunction in human EHTs.
a, Schematic illustration of the experimental design: human EHTs from line SCVI-273 were tachypaced at 3 Hz for 5 days and allowed to resume the normal beating rate to recover for 5 days. Contractility was recorded at various timepoints (indicated by the arrows). No pacing was applied during the recording so functional parameters were generated under spontaneous beating for all EHTs. b, Representative motion traces and velocity traces of the tachypaced EHTs and the unpaced control EHTs from day 0, day 5 and day 10. c, Maximum contraction velocity, maximum relaxation velocity and contractile force were quantified for tachypaced EHTs (indicated by red) and control unpaced EHTs (indicated by blue) and plotted over time. d, The experiment in c was repeated in a second iPSC cell line (SCVI-15). For c and d, n = 7 EHTs for each group. Two-way ANOVA with Bonferroni’s multiple comparisons test. Control EHTs were compared with the tachypaced EHTs for each timepoint. e, EHTs (SCVI-15) were subjected to irregular pacing with either a fast-irregular regimen (3 Hz/1 Hz, 5 s/5 s) or a slow-irregular regimen (1.5 Hz/0.5 Hz, 10 s/10 s). Contractility was measured before and after 5 days of pacing and normalized against the unpaced EHTs. n = 8 EHTs. Paired Student’s t-test. Data are displayed as mean ± s.e.m.
Fig. 5 |
Fig. 5 |. PKA signalling is dysregulated by tachypacing in a biphasic manner.
a, Monolayers of iPSC–CMs were tachypaced at 3 Hz for 5 days and imaged with the Fluo-4 dye using confocal line-scanning microscopy. Cells were paced at 0.5 Hz or 1 Hz during imaging. Representative images of calcium transients from single tachypaced iPSC–CMs (indicated by red) or unpaced control (indicated by blue). This experiment was independently performed in two different iPSC lines. b, Parameters of calcium handling were quantified in control and tachypaced iPSC–CMs, including calcium amplitude, TTP, upstroke velocity, TD10, TD20, TD30, TD50 and decay time (36.8% decay to the end of the transient). For cell line 1 (SCVI-273), n = 75 cells for the control group and n = 86 cells for the tachypaced group; for cell line 2 (SCVI-15), n = 53 cells for the control group and n = 46 cells for the tachypaced group. Two-tailed Mann–Whitney test. Data are displayed as mean ± s.e.m. c, EHTs were tachypaced for 5 days at 3 Hz (SCVI-273), followed by protein extraction and western blot analysis of phosphorylated PLN at Ser16 (p-PLN Ser16), phosphorylated PLN at Thr17 (p-PLN T17), total PLN, phosphorylated CAMKII at T287 (p-CAMKII T287), total CAMKII, phosphorylated cardiac troponin I at Ser23/24 (p-cTNI Ser23/24), total cTNI and SERCA2a. d, Expression of p-PLN Ser16, p-PLN T17, p-cTNI Ser23/24 and p-CAMKII in EHTs. Data were normalized against the unpaced EHTs. n = 4 EHTs per group. e, Western blot analysis of p-PLN Ser16, p-PLN T17, total PLN, p-CAMKII, total CAMKII, p-cTNI Ser23/24, total cTNI and SERCA2a in dogs with non-failing hearts (NF) or with tachypacing-induced HF. f, Expression of p-PLN Ser16, p-PLN T17, p-cTNI Ser23/24 and p-CAMKII in the canine samples. Data were normalized against the NF group. n = 3 NF dogs and n = 4 HF dogs. For d and f, an unpaired Student’s t-test was applied. Data are displayed as mean ± s.e.m.
Fig. 6 |
Fig. 6 |. Tachycardia promotes tissue hypoxia.
a, RNA-seq analysis of three groups of EHTs: tachypaced EHTs, unpaced EHTs and tachypaced EHTs after recovery. b, Heat map of DEGs between tachypaced and unpaced EHTs are shown in six samples from two independent batches (SCVI-273). c, Pathway analysis and GO analysis of genes reversibly affected by tachypacing. The cutoff of adjusted p-value (adj_pval) was 0.05. d, Schematic illustration of hypoxia imaging: EHTs (SCVI-273) were incubated with an oxygen-sensitive dye and then subjected to tachypacing at 3 Hz or no pacing for 3 h, followed by fluorescence imaging. e, Representative fluorescence images of unpaced control EHTs and tachypaced EHTs. Scale bar, 200 μm. f, Quantification of the fluorescence intensity from unpaced control EHTs (indicated by blue) and tachypaced EHTs (indicated by red) at the edge of the tissue or the centre of the tissue. n = 16 regions of interest. Two-tailed Mann–Whitney test. g, Western blot analysis of HIF1A in unpaced EHTs or EHTs tachypaced for 5 days. Expression levels were normalized against the unpaced EHTs. n = 4 EHTs per group (SCVI-273). Unpaired Student’s t-test. h, Lactate was measured from the extracellular medium of unpaced EHTs (indicated by blue) and tachypaced EHTs (indicated by red) on day 3 and day 5 of pacing. n = 4 samples per group. Unpaired Student’s t-test. i, OCR measurement of unpaced or tachypaced EHTs by Seahorse analysis. n = 8 EHTs per group (SCVI-273). j, OCR of control and tachypaced EHTs at baseline. k, OCR of unpaced and tachypaced EHTs measured after dobutamine (10 μM) treatment. Two-tailed Mann–Whitney test. l, Analysis of human data identifies tachycardia-specific genes exclusively upregulated in failing hearts with tachycardia but not in those without. The results of pathway enrichment analysis are presented in a bubble diagram. m, Expression of hypoxia genes VEGF, MB, tissue-type plasminogen activator (PLAT) and periostin (POSTN) in patients with non-failing hearts (n = 14), patients with HF (n = 16) or patients with HF and tachycardia (n = 19). The y axes were shown in a linear scale for VEGF and MB and a log scale for PLAT and POSTN. One-way ANOVA with Tukey’s multiple comparisons test (for VEGF and MB) or Kruskal–Wallis with Dunn’s multiple comparisons test (for PLAT and POSTN). Data are displayed as mean ± s.e.m.
Fig. 7 |
Fig. 7 |. Increased glucose utilization in tachypaced EHTs.
a, Key pathways and metabolites of glucose metabolism. EHTs from line SCVI-273 were tachypaced (indicated by red) or unpaced (indicated by blue) for 5 days at 3 Hz, followed by metabolomic analysis. Parts of the illustration were created with BioRender. b, Quantification of glycolysis metabolites: fructose 1,6-biphosphate, dihydroxyacetone phosphate, phosphoenol pyruvate and pyruvate (n = 7 control EHTs and n = 8 tachypaced EHTs). c, Quantification of serine biosynthesis pathway metabolites: phosphohydroxypyruvic acid and serine (n = 7 control EHTs and n = 8 tachypaced EHTs). d, Quantification of the PPP pathway metabolites: 6-phosphogluconic acid and ribulose 5-phosphate (n = 12 control EHTs and n = 13 tachypaced EHTs). e, Quantification of the polyol pathway metabolites: fructose and sorbitol (n = 12 control EHTs and n = 13 tachypaced EHTs). f, Quantification of the HBP pathway metabolites: UDP-GlcNAc, glutamate and the glutamate/glutamine ratio (n = 12 control EHTs and n = 13 tachypaced EHTs). g, Quantification of TCA cycle metabolites: succinic acid, malic acid, citric acid, aconitic acid and fumaric acid (n = 12 control EHTs and n = 13 tachypaced EHTs). For bg, a two-tailed Mann–Whitney test was applied. h, Western blot analysis of GLUT1 in unpaced or tachypaced EHTs. n = 4 EHTs per group. i, Western blot analysis of GLUT1 in canine left ventricle tissue with or without tachypacing-induced HF. n = 3 NF dogs and n = 4 HF dogs. For h and i, data were normalized against the control EHTs and the NF dogs, respectively. Unpaired Student’s t-test. Data are displayed as mean ± s.e.m.
Fig. 8 |
Fig. 8 |. Disrupted NAD homeostasis and SERCA2a acetylation underlie tachycardia-induced cardiac dysfunction.
a, Measurement of NAD+ and NADH in iPSC–CMs (SCVI-273) subjected to low glucose (2.5 mM glucose), high glucose (25 mM glucose, HG) or HG with hypoxia (<1% O2) for 24 h. Data were normalized against the LG group. n = 4 wells of cells for each condition. One-way ANOVA with Tukey’s multiple comparisons test. b, Measurement of NAD+ and NADH in unpaced control or tachypaced EHTs (SCVI-273). Data were normalized against the unpaced EHTs. n = 8 EHTs for each group. Two-tailed Mann–Whitney test. c, Immunoblot (IB) analysis of total proteins from unpaced control or tachypaced EHTs for lysine acetylation. n = 4 samples for each group with each sample pooled from two EHTs (SCVI-273). d, Immunoblot analysis of total proteins from dogs with tachypacing-induced HF or dogs without HF (NF) for lysine acetylation. n = 3 NF dogs and n = 4 HF dogs. e, EHTs (SCVI-273 and SCVI-15) unpaced or tachypaced for 5 days were lysed for protein extraction and IP for acetylated lysine, and the IP samples were blotted for SERCA2a. Acetylated SERCA2a was quantified and normalized against the total SERCA2a detected in the input samples. n = 8 samples for each group and each sample was pooled from two EHTs. Two-tailed Mann–Whitney test. f, EHTs (SCVI-273 and SCVI-15) were tachypaced for 5 days at 3 Hz, allowed to recover for 24 h with or without 1 mM NAD+ followed by protein extraction. g, Immunoblot analysis of global lysine acetylation from tachypaced EHTs with or without NAD+ treatment. n = 3 samples for each group with each sample pooled from two EHTs. h, Tachypaced EHTs with or without NAD+ treatment were lysed for protein extraction, followed by IP for acetylated lysine, and the IP samples were blotted for SERCA2a. Acetylated SERCA2a was quantified and normalized against the total SERCA2a detected in the input samples. n = 6 samples for each group and each sample was pooled from two EHTs. Two-tailed Mann–Whitney test. i, EHTs (SCVI-273) were tachypaced for 5 days at 3 Hz, then allowed to recover with or without 1 mM NAD+, followed by contractility measurement. j, Quantification of contractile force, maximum contraction velocity and relaxation velocity in NAD+-treated or untreated EHTs on day 0, day 1 and day 5 of recovery. Data were normalized against the baseline values before pacing. n = 7 untreated EHTs and n = 8 NAD+-treated EHTs. Two-way ANOVA with Bonferroni’s multiple comparisons test. k, Representative motion traces of EHTs at baseline, after tachypacing and 1 day after recovery with or without NAD+. Data are displayed as mean ± s.e.m.

References

    1. Fox K et al. Heart rate as a prognostic risk factor in patients with coronary artery disease and left-ventricular systolic dysfunction (BEAUTIFUL): a subgroup analysis of a randomised controlled trial. Lancet 372, 817–821 (2008). - PubMed
    1. Nanchen D et al. Resting heart rate and the risk of heart failure in healthy adults the rotterdam study. Circ. Heart Fail 6, 403–410 (2013). - PubMed
    1. Böhm M et al. Heart rate as a risk factor in chronic heart failure (SHIFT): the association between heart rate and outcomes in a randomised placebo-controlled trial. Lancet 376, 886–894 (2010). - PubMed
    1. Hori M & Okamoto H Heart rate as a target of treatment of chronic heart failure. J. Cardiol 60, 86–90 (2012). - PubMed
    1. Komajda M Heart rate in chronic heart failure: an overlooked risk factor. Eur. Heart J 36, 648–649 (2015). - PubMed

Publication types