. 2023 Dec;20(12):2048-2057.
doi: 10.1038/s41592-023-02068-7. Epub 2023 Nov 27.

Next-generation MRI scanner designed for ultra-high-resolution human brain imaging at 7 Tesla

Affiliations

Next-generation MRI scanner designed for ultra-high-resolution human brain imaging at 7 Tesla

David A Feinberg et al. Nat Methods. 2023 Dec.

Abstract

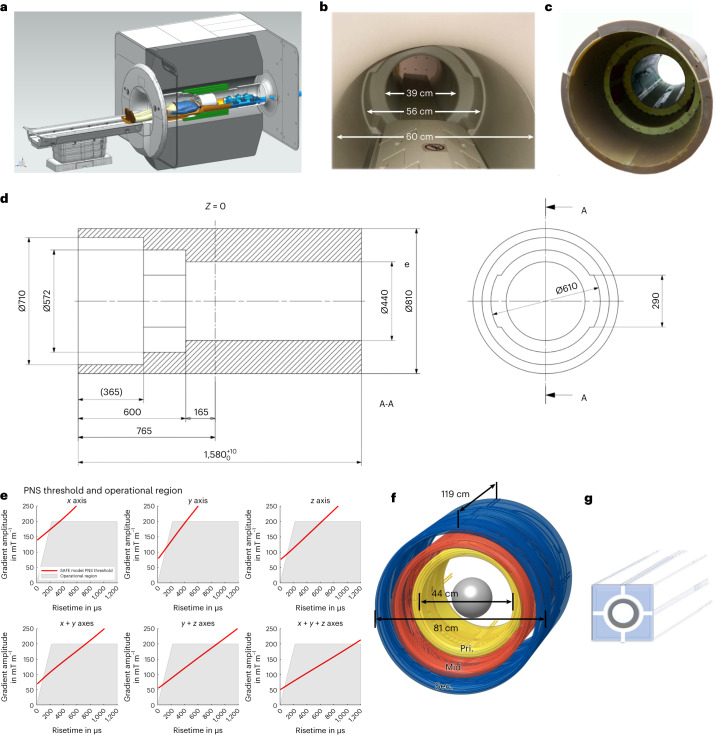
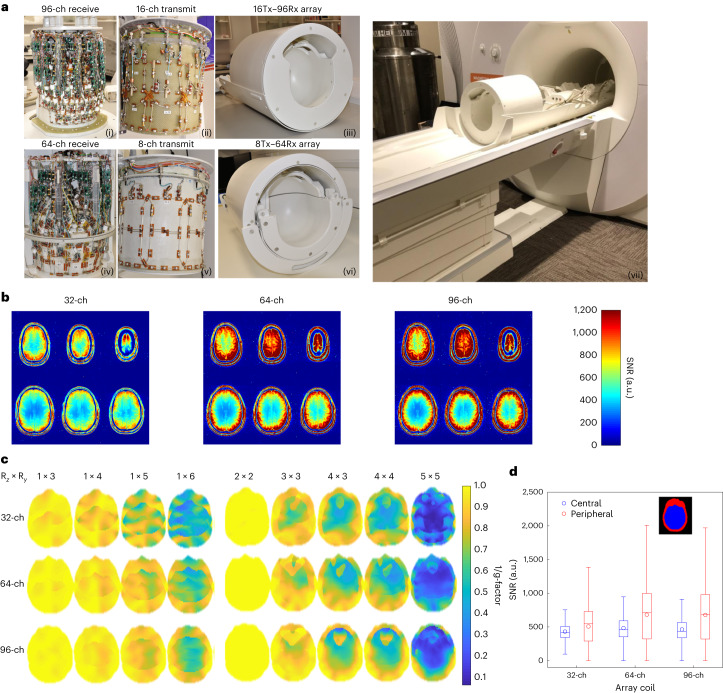
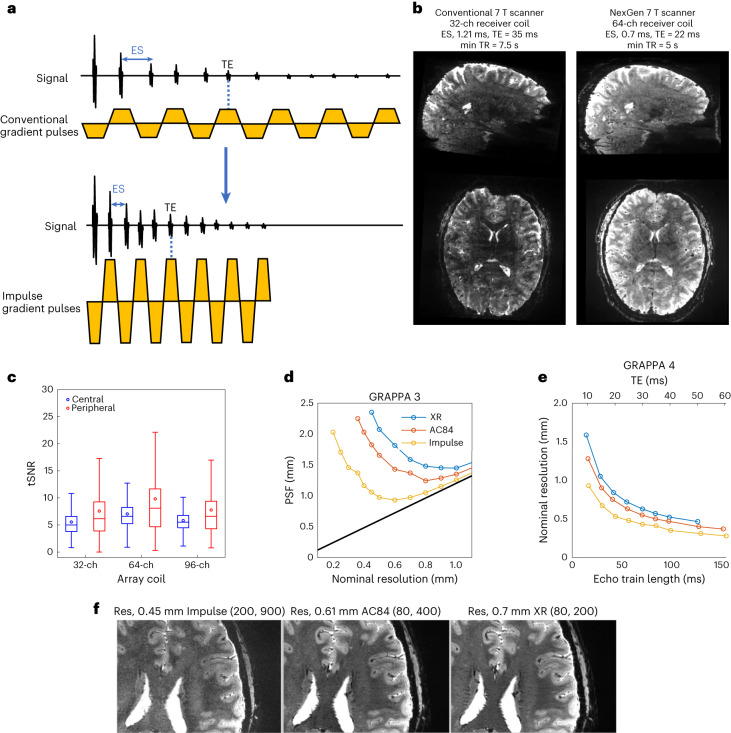
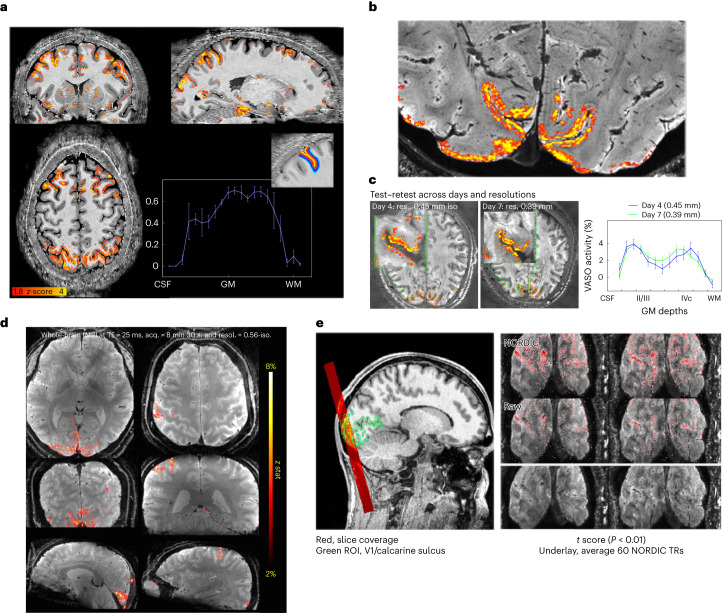
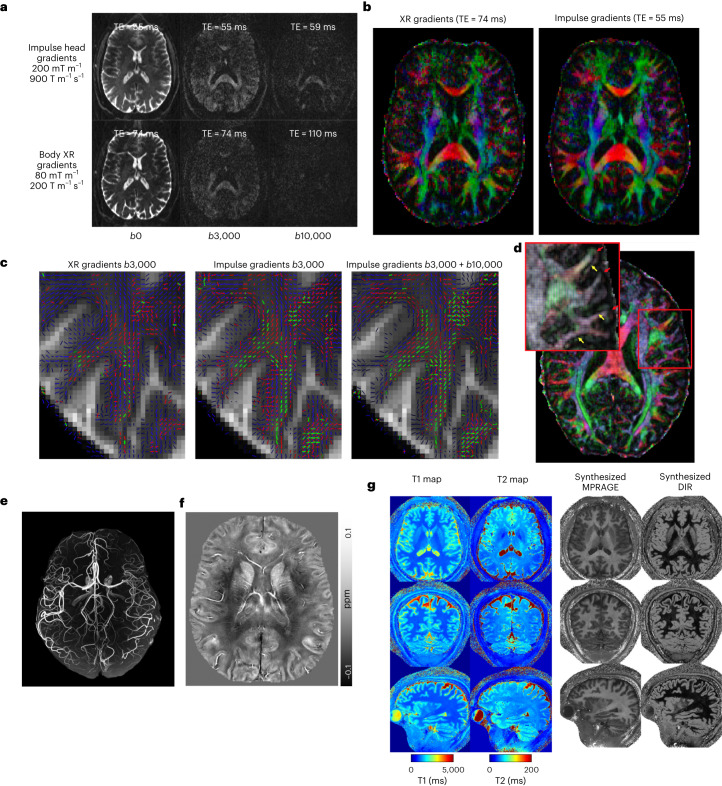
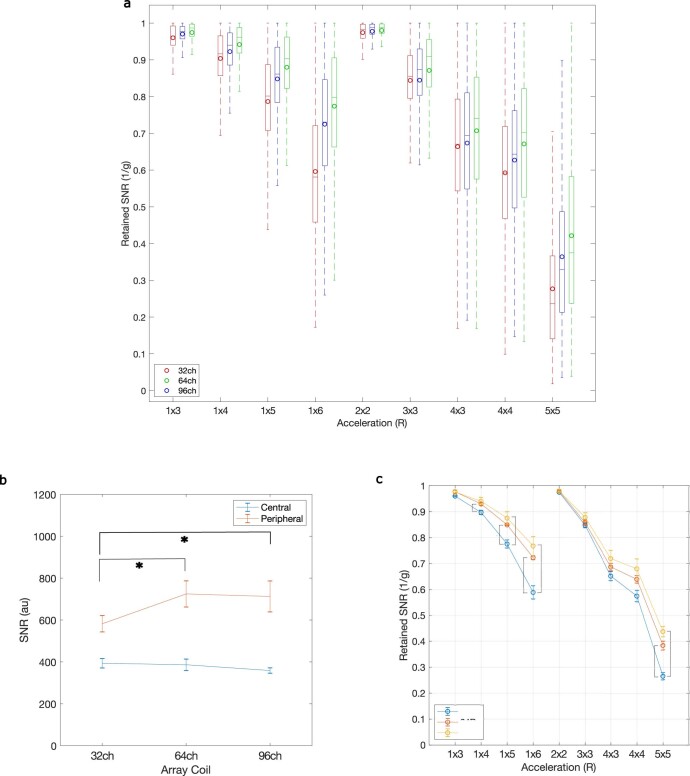
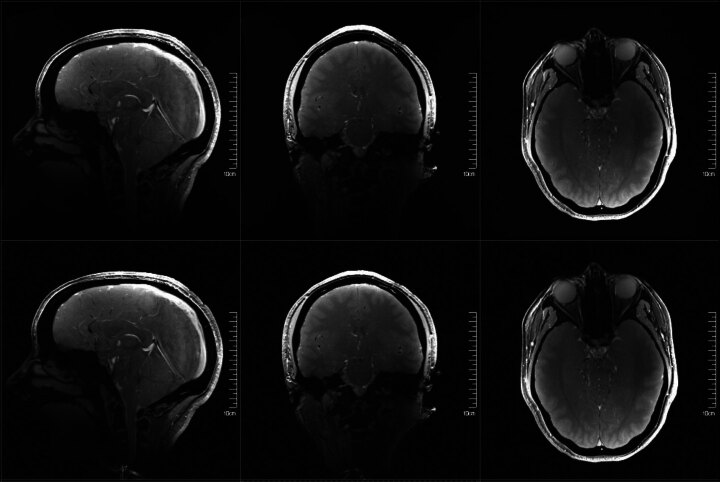
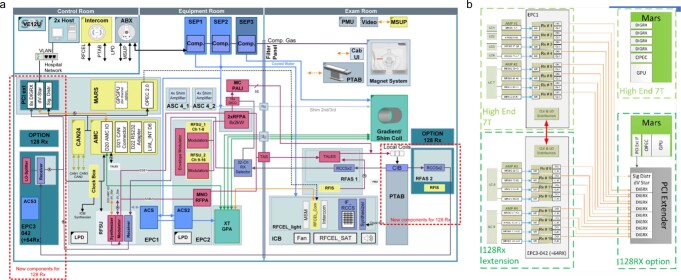
To increase granularity in human neuroimaging science, we designed and built a next-generation 7 Tesla magnetic resonance imaging scanner to reach ultra-high resolution by implementing several advances in hardware. To improve spatial encoding and increase the image signal-to-noise ratio, we developed a head-only asymmetric gradient coil (200 mT m-1, 900 T m-1s-1) with an additional third layer of windings. We integrated a 128-channel receiver system with 64- and 96-channel receiver coil arrays to boost signal in the cerebral cortex while reducing g-factor noise to enable higher accelerations. A 16-channel transmit system reduced power deposition and improved image uniformity. The scanner routinely performs functional imaging studies at 0.35-0.45 mm isotropic spatial resolution to reveal cortical layer functional activity, achieves high angular resolution in diffusion imaging and reduces acquisition time for both functional and structural imaging.


Conflict of interest statement

A.P., I.G.-I., S.S., E.R. and P.D. are employees of Siemens Healthineers. S.M. and P.B. are employees of Siemens Medical Solutions USA, Inc. S.G. is an employee of MR CoilTech Limited, LLC. A.J.S.B. and D.A.F. are employees of Advanced MRI Technologies. D.A.F. has equity in Advanced MRI Technologies. L.W. has consulting and equity with Neuro42 Inc., a low-field MRI start-up company, research support from Siemens Healthineers, equity in Reveal Pharmaceuticals, an MR contrast agent start-up, and patents related to MRI assigned to MGH that have been licensed and/or could be potentially licensed. M.D. has consulting with Neuro42 Inc.

Figures

Fig. 1
Fig. 1. NexGen 7 T scanner.
a, Cross-sectional rendering of the scanner showing the Impulse gradient coil (green), the receiver–transmit coil connectors attached to the coil interface box with energy chain extending out of the magnet (blue) and a receiver–transmit coil (white) resting on extension of the movable bed (brown). b, Photo of the scanner with the acoustic bore liner giving a 39 cm diameter head region, 56 cm wide shoulder spaces and 60 cm diameter body bore. c, Photograph of the Impulse gradient coil. d, Cross-sectional dimensions of the Impulse gradient coil showing key dimensions (mm). The three coil axes are combined in each of the three layers of windings (primary (Pri.), middle (Mid.), secondary (Sec.)) and the shoulder cutouts are in the y axis middle layer. e, PNS threshold limits in scanner operational region determined by maximum gradient amplitude and rise time (SR) below PNS thresholds. The red line shows the SAFE model threshold used during normal scanner operation. f, A 3D layout of the gradient coil showing the three layers of coil winding (primary, middle, secondary). g, Diagrammatic rendering of a segment of the (gray) stainless-steel cooling tubes integrated into conductive windings surrounded by copper filament conductors.
Fig. 2
Fig. 2. High-density receiver array coils and transmit array coils.
a, The top row shows a 16-ch Tx and 96-ch Rx coil: a photograph of the completed 96-ch array (i), the 16-ch dual-row transmit array (ii) and the fully assembled 16-ch Tx, 96-ch Rx coil (iii). The bottom row shows an 8-ch Tx, 64-ch Rx coil: a photograph of the 64-ch receive array (iv), the 8-ch transmit array (v) and the fully assembled 8-ch Tx, 64-ch Rx coil (vi). The scanner’s movable table is specially designed to incorporate the RF array coils (vii). b, Comparison of receiver coil SNR maps between standard 32-ch coil and the 64- and 96-ch coil measured in the same participant. c, Retained SNR (1/g maps) for a range of accelerations (R) on the 64-ch Rx and 96-ch Rx array compared to a standard 32-ch array. d, Boxplots of SNR distributions in a central and peripheral ROI (n = 363,171 and 422,316 voxels, respectively) for each array coil (right panel). Boxes show the median, 25th and 75th percentile values. Circles show mean values. Whiskers show 1.5 times the interquartile range.
Fig. 3
Fig. 3. EPI on the NexGen 7 T.
a, EPI pulse sequence diagram shows readout gradient pulses with conventional versus higher amplitude and faster SR that reduces ES. b, Comparison of EPI image quality at 0.6 mm isotropic resolution covering the brain on the conventional 7 T scanner (MAGNETOM 7 T Plus) and the NexGen 7 T scanner with the Impulse head gradient coil using the same acquisition parameters: GRAPPA × SMS = 4 × 3, partial Fourier 6/8, 216 slices, matrix size 320 × 320. The left shows the conventional 7 T (80 mT m−1, 200 T m−1 s−1, 32-ch Rx, 8-ch Tx). The right shows the NexGen 7 T (200 mT m−1, 900 T m−1 s−1, 64-ch Rx, 8-ch Tx coil). c, Box plot of temporal SNR within a central and peripheral ROI (n = 3,333,301 and 3,980,755 voxels, respectively). Boxes show median, 25th and 75th percentile values. Circles show mean values. Whiskers show 1.5 times the interquartile range. d, PSF on EPI image phase-encoded axis due to T2* decay for a given resolution achievable at three different gradient coil performances using GRAPPA acceleration of 3. e, Achievable nominal resolution at a given TE with same echo train duration with the same T2* signal decay for three different gradient coil performances using GRAPPA acceleration of 4 and 6/8 partial Fourier. f, EPI images, at maximum achievable resolution (Res) at TE 26 ms for three different gradient coils. The highest achievable isotropic volumetric resolutions are 0.09 μl (0.45 mm isotropic voxel), 0.23 μl (0.61 mm isotropic) and 0.343 μl (0.7 mm isotropic). Differences in Gmax and SR are noted (mT m−1, T m−1 s−1) for different gradient coils.
Fig. 4
Fig. 4. VASO and BOLD 3D EPI.
a, Whole-brain VASO layer fMRI acquired at 0.64 mm resolution. A seed-based correlation map from a video watching task after layer-based smoothing displayed on the temporally averaged T1-weighted VASO volume. Activity across the gray matter ribbon (from CSF to white matter (WM)) is plotted with corresponding layer profiles displayed in the inset. Error bars refer to the variance of the signal within each layer across estimated columnar units spanning across approximately 30 mm of cortical ribbon of the sulci depicted in the layer mask. Adapted from ref. . b, Layer fMRI combining 0.45 mm and 0.39 mm isotropic resolution data (in 2-mm-thick V1 human cortex) differentiates activation in cortical layers (double stripes of activity) in supra- and infra-granular layers from a flashing checkerboard task. Activations overlaid on high-resolution GRE anatomical image. c, Test–retest of layer fMRI results in V1 across resolutions and days. Error bars defined as for a, across approximately 8 mm of cortical ribbon in the calcarine sulcus. Adapted from ref. . d, BOLD fMRI acquired (acq.) with whole-brain coverage at 0.56 mm isotropic (iso.) resolution (resol.) using 3D EPI with random k-space sampling scheme, to increase SNR. e, BOLD fMRI with 3D EPI at ultra-high resolution acquired at 0.35 mm isotropic resolution, imaging visual cortex using stimulation checkerboard for 20 min. Activation maps thresholded at P < 0.01 (one side, no correction for multiple comparisons). NORDIC denoising was applied. Adapted from ref. .
Fig. 5
Fig. 5. Diffusion and structural imaging.
a, Diffusion-weighted MRI at various b values. Comparing images acquired with NexGen 7 T gradient coil performance in the top row to conventional gradient coil performance (80 mT m−1, 200 T m−1 s−1) in the bottom row. b, Improvement in color principal fiber orientation maps with shorter TE and higher SNR using NexGen 7 T gradient coil performance. c, Improvement in crossing fiber detection in complex white matter regions: primary (blue), secondary (red) and tertiary (green) fiber crossings in centrum semiovale white matter. The vector color intensities are modulated by the fiber’s respective volume fraction. Only fibers with volume fractions greater than 5% are shown. d, Pushing the spatial resolution to 0.8 mm using NexGen 7 T gradient coil. The primary diffusion direction map is overlaid onto fractional anisotropy for this 0.8 mm data. Yellow arrows indicate where white matter tracts turn sharply into the cortex and red arrows denote gyral crowns where the white matter tracts continue straight into the gray matter. Adapted from ref. . e, Time-of-flight 3D MRA at 0.4 mm isotropic. f, 3D QSM with tenfold acceleration. QSM map of a representative axial slice with a resolution of 0.21 × 0.21 × 1.5 mm3, reconstructed using the software STI Suite (UC Berkeley). g, Whole-brain quantitative mapping and synthesized images using MR fingerprint spiral imaging provided multiple image contrasts at 0.56 mm isotropic in a 4-min acquisition time. From left to right: acquired whole-brain T1 and T2 maps and several derived 3D image sets with different contrasts. MPRAGE (magnetization prepared-rapid GRE), double inversion recovery (DIR).
Extended Data Fig. 1
Extended Data Fig. 1. Sound pressure levels.
Measured using a high-resolution EPI sequence using two gradient strengths, typically used for neuroimaging studies, at a range of echo spacings using three orthogonal readout directions, and showed sound levels within prescribed safety limits ( < 99 dB) when using 33 dB attenuation earplugs. (*)Approximate dB measures at 0.55 ms echo spacing (E/S) due to sound meter clipping and HF 76 did not run at 0.55 ms E/S due to stimulation warning.
Extended Data Fig. 2
Extended Data Fig. 2. RF Array Coil Performance.
A) Histogram of retained SNR (1/G) for different accelerations for 3 arrays coils (32 ch, 64ch, 96ch). Boxes show median, 25th and 75th percentile values (n = 219233 voxels across a whole brain ROI). Circles show mean values. Whiskers show 1.5 times the interquartile range. B) Across 3 subjects, the 64Rx (paired sample t-test, p = .0144) and 96Rx (paired sample t-test, p = .0272) showed significantly higher SNR in the periphery of the brain when compared to the 32Rx. The central ROI did now show higher SNR for higher channel count arrays. Data are presented as mean values +/- standard deviation (SD). C) Across 3 subjects, the 64Rx showed higher retained SNR (1/g) than the 32Rx at accelerations of 1×4, 1×5, 1×6 and 5×5 (paired sample t-tests, p = .0433,.0114,.0085,.0067, Bonferroni corrected). The 96Rx showed higher retained SNR (1/g) than the 32Rx at accelerations of 1×5, 1×6 and 5×5 (paired sample t-test, p = .0371,.0202,.0022, Bonferroni corrected). Data are presented as mean values +/- SD.
Extended Data Fig. 3
Extended Data Fig. 3. Gradient coil performance.
Table of achievable resolutions with corresponding echo time, echo spacing and bandwidth for two different gradient coil performances.
Extended Data Fig. 4
Extended Data Fig. 4. Gradient coil performance and distortions in EPI.
Measures of distortion in high-resolution EPI using two different gradient coil performances. Distortion is measured as the level of non-linear warping required to bring two images with opposite phase encode (showing equal but opposite levels of distortion) into alignment. The distortion is expressed as a warp field map, showing the amount of distortion in mm experienced at each voxel, with the sign of the map value showing the direction of distortion along an image axis. Values near zero show little distortion, with more positive or negative values indicating greater distortion.
Extended Data Fig. 5
Extended Data Fig. 5. Gradient coil performance and EPI.
(a), Simulation of the effects of Echo Time (TE) and echo spacing on SNR in EPI. (b), achievable nominal resolution for different minimum TEs for three different gradient coil performances when using GRAPPA acceleration of 4. (c), Point Spread Function (PSF) on image phase encoded axis (FWHM of Fourier transform of the modulation transfer function associated with T2* decay across the image readout, modeled using a T2* of 25 ms) versus nominal resolution for 3 different gradient coil performances for GRAPPA 3 combined with In-plane Segmentation (for an equivalent acceleration of 6). Dashed black line shows minimum achievable PSF for a given nominal resolution assuming no T2* blurring. (d) Comparison of SNR for central (blue) and peripheral (red) regions of the brain. Gmax, SR (mT/m, T/m/s) XR and SC72 whole-body gradient (80,200), AC84 head only gradient (80,400), Impulse head-only gradient (200, 900).
Extended Data Fig. 6
Extended Data Fig. 6. Multi-echo EPI imaging.
Early TE of initial echo reduces susceptibility drop out of signal in optimally combined images. When compared to standard gradient performance, the Impulse gradient coil allows either an increase in resolution at equivalent TEs (1.16 mm isotropic versus 1.6 mm isotropic), or an earlier TE for the first echo and one additional echo in the same overall acquisition window (4 echoes versus 3 echoes).
Extended Data Fig. 7
Extended Data Fig. 7. Effect of resolution on resolving laminar fMRI.
Results down-sampled from acquired 0.39 mm isotropic voxels to lower resolutions.
Extended Data Fig. 8
Extended Data Fig. 8. Head coverage of Impulse gradient coil.
Shown in 3 perpendicular image planes with FLASH images, with and without distortion correction.
Extended Data Fig. 9
Extended Data Fig. 9. Hardware Developments for NexGen 7 T.
a, Diagram overview of the whole scanner systems showing the incorporated components of the 128-channel system. b, Diagrams of scanner’s measurement and acquisition (MaRS) computer showing adaptation for higher channel receiver.

References

    1. Huber, L. et al. Layer-dependent functional connectivity methods. Prog. Neurobiol.207, 101835 (2021). - PMC - PubMed
    1. Feinberg, D. A. et al. Inner volume MR imaging: technical concepts and their application. Radiology156, 743–747 (1985). - PubMed
    1. Schluppeck, D., Sanchez-Panchuelo, R.-M. & Francis, S. T. Exploring structure and function of sensory cortex with 7T MRI. Neuroimage164, 10–17 (2018). - PubMed
    1. Yacoub, E., Harel, N. & Ugurbil, K. High-field fMRI unveils orientation columns in humans. Proc. Natl Acad. Sci. USA105, 10607–10612 (2008). - PMC - PubMed
    1. Yacoub, E., Shmuel, A., Logothetis, N. & Ugurbil, K. Robust detection of ocular dominance columns in humans using Hahn Spin Echo BOLD functional MRI at 7 Tesla. Neuroimage37, 1161–1177 (2007). - PMC - PubMed