. 2024 Jan;31(1):106-118.
doi: 10.1038/s41418-023-01244-8. Epub 2023 Nov 27.

H3K36 methyltransferase NSD1 protects against osteoarthritis through regulating chondrocyte differentiation and cartilage homeostasis

Affiliations

H3K36 methyltransferase NSD1 protects against osteoarthritis through regulating chondrocyte differentiation and cartilage homeostasis

Rui Shao et al. Cell Death Differ. 2024 Jan.

Abstract

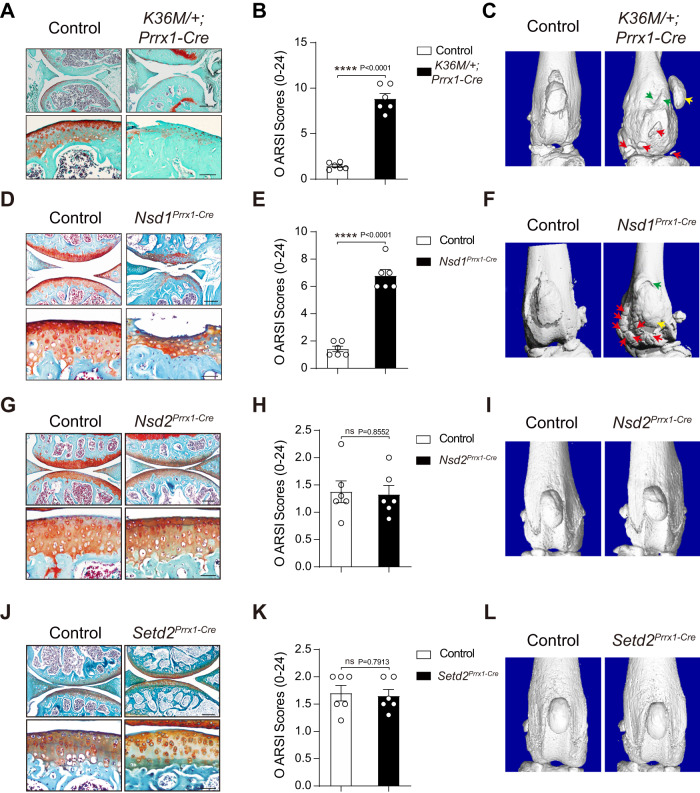
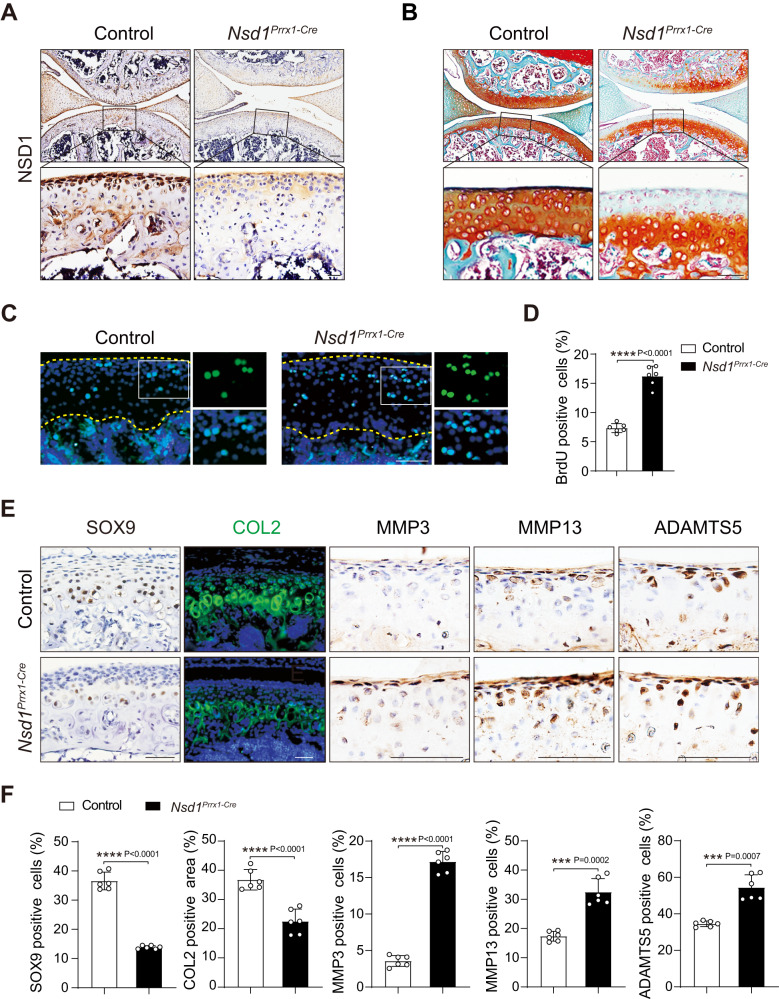
Osteoarthritis (OA) is one of the most common joint diseases, there are no effective disease-modifying drugs, and the pathological mechanisms of OA need further investigation. Here, we show that H3K36 methylations were decreased in senescent chondrocytes and age-related osteoarthritic cartilage. Prrx1-Cre inducible H3.3K36M transgenic mice showed articular cartilage destruction and osteophyte formation. Conditional knockout Nsd1Prrx1-Cre mice, but not Nsd2Prrx1-Cre or Setd2Prrx1-Cre mice, replicated the phenotype of K36M/+; Prrx1-Cre mice. Immunostaining results showed decreased anabolic and increased catabolic activities in Nsd1Prrx1-Cre mice, along with decreased chondrogenic differentiation. Transcriptome and ChIP-seq data revealed that Osr2 was a key factor affected by Nsd1. Intra-articular delivery of Osr2 adenovirus effectively improved the homeostasis of articular cartilage in Nsd1Prrx1-Cre mice. In human osteoarthritic cartilages, both mRNA and protein levels of NSD1 and OSR2 were decreased. Our results indicate that NSD1-induced H3K36 methylations and OSR2 expression play important roles in articular cartilage homeostasis and OA. Targeting H3K36 methylation and OSR2 would be a novel strategy for OA treatment.


Conflict of interest statement

The authors declare no competing interests.

Figures

Fig. 1
Fig. 1. H3K36 methylations decreased in aged cells and articular cartilage.
A SA-β-Gal staining results of ATDC5 cells treated with DMSO or Etoposide. Scale bar = 200 μm. B Western blot results of H3K36 methylations in ATDC5 cells treated with DMSO or Etoposide. Safranin O staining results (C) and OARSI Scores (D) of knee joint sections from two-month-old (Young) and two-year-old (Aged) mice (Young, n = 6; Aged, n = 6). Scale bar (top) = 200 μm, scale bar (bottom) = 50 μm. Immunohistochemistry results of H3K36me1 (E), H3K36me2 (G), and H3K36me3 (I) and quantification of positive cells ((F) for H3K36me1, (H) for H3K36me2, (J) for H3K36me3) in the articular cartilages from young and aged mice (Young, n = 6; Aged, n = 6). Scale bar (top) = 200 μm, scale bar (bottom) = 50 μm. Data are expressed as mean ± SD. Unpaired t test (D, F, H, J).
Fig. 2
Fig. 2. Mice with K36M transgenic or Nsd1 knockout developed osteoarthritis.
Safranin O staining results (A, D, G, J), OARSI Scores (B, E, H, K), and CT images (C, F, I, L) of six-month-old K36M/+; Prrx1-Cre mice (AC), Nsd1Prrx1-Cre mice (D, E), Nsd2Prrx1-Cre mice (GI), Setd2Prrx1-Cre mice (JL), and littermates (control, n = 6; K36M/+; Prrx1-Cre, n = 6; Nsd1Prrx1-Cre, n = 6; Nsd2Prrx1-Cre, n = 6; Setd2Prrx1-Cre, n = 6). Scale bar (top) = 200 μm, scale bar (bottom) = 50 μm. Yellow arrow indicates dislocation of the patella. Green arrows indicate twisted subchondral bone. Red arrows indicate osteophytes. Data are expressed as mean ± SD. Unpaired t test (B, E, H, K).
Fig. 3
Fig. 3. Nsd1 deficiency disrupted articular cartilage homeostasis.
A NSD1 IHC results in the articular cartilage sections from one-month-old mice. Scale bar (top) = 100 μm, scale bar (bottom) = 50 μm. B Safranin O staining results of knee joint sections from one-month-old Nsd1Prrx1-Cre mice and littermates. Scale bar (top) = 100 μm, scale bar (bottom) = 50 μm. BrdU staining (C) and quantification (D) results of knee joint sections from one-month-old Nsd1Prrx1-Cre mice and littermates. Scale bar (top) = 100 μm, scale bar (bottom) = 50 μm. E Immunostaining results of SOX9 (first column), COL2 (second column), MMP3 (third column), MMP13 (fourth column), ADAMTS5 (fifth column) on knee joint sections from one-month-old mice. Scale bar = 50 μm. F Quantification of cells or areas positively stained for SOX9, COL2, MMP3, MMP13, and ADAMTS5 (control, n = 6; Nsd1Prrx1-Cre, n = 6). Data are expressed as mean ± SD. Unpaired t test (D, F).
Fig. 4
Fig. 4. Disturbed cell proliferation, differentiation and metabolism after NSD1 knockout.
Volcano plot (A) and heatmap (B) showing transcriptome changes of immortalized Nsd1fl/fl cells infected with Egfp or Cre virus. Fold change >= 2. Enriched GO terms (C) and KEGG pathways (D) analysis of downregulated genes in Cre cells. GSEA plots (E, F) showing enrichment of GO BP between Egfp and Cre cells. G RT-PCR analysis of candidate genes expression levels in RNA-seq samples. Data represent the mean ± SD (n = 4). *P < 0.05, **P < 0.01, ***P < 0.001, unpaired t test was performed.
Fig. 5
Fig. 5. Osr2 was regulated by NSD1 through H3K36 methylation.
A Boxplot showing the binding levels of decreased H3K36me2 binding peaks in Cre samples based on H3K36me2 ChIP-seq with Egfp and Cre cells. B Venn diagram showing the overlap of genes with decreased expression and decreased H3K36me2 occupancy in Cre cells. C Quantitative expression analysis of four transcription factors in the RNA-seq samples. Western blot (D) and IHC (E) results of OSR2 in articular cartilage of one-month-old Nsd1Prrx1-Cre mice and littermates. Scale bar = 50 μm. F Alcian blue staining of wildtype chondroprogenitor cells infected with Egfp shRNA or Osr2 shRNA. Scale bar = 2 mm. G qRT-PCR results showing the knockdown efficiency of Osr2 (n = 4 for each treatment). qRT-PCR results showing the levels of genes related to chondrogenic differentiation and anabolic metabolism (H) and catabolic metabolism (I) in cells infected with Egfp shRNA or Osr2 shRNA (n = 4 for each treatment). J H3K36me2 binding peaks from the H3K36me2 ChIP-seq of immortalized Nsd1fl/fl cells infected with Egfp or Cre virus. K ChIP-qPCR analysis of H3K36me1 and H3K36me2 bindings in immortalized Nsd1fl/fl cells infected with Egfp or Cre virus (n = 4 for each assay). Data are expressed as mean ± SD. One-way ANOVA (G, HI, K).
Fig. 6
Fig. 6. Osr2 complement could rescue the defect in chondrogenic differentiation and cartilage homeostasis caused by Nsd1 knockout.
A Alcian blue staining results of micromass with chondroprogenitor cells from control and Nsd1Prrx1-Cre mice, infected with Egfp or Osr2 lentivirus. Scale bar = 2 mm. B qRT-PCR results showing the overexpression efficiency of Osr2 (control, n = 4; Nsd1Prrx1-Cre + Egfp, n = 4; Nsd1Prrx1-Cre + Osr2, n = 4). C qRT-PCR results showing the levels of genes related to chondrogenic differentiation and anabolic metabolism (control, n = 4; Nsd1Prrx1-Cre + Egfp, n = 4; Nsd1Prrx1-Cre + Osr2, n = 4). D Distribution of OSR2-positive cells in the articular cartilage of mice with intra-articular injection of Flag-Osr2 adenovirus. Scale bar = 50 μm. E Safranin O staining results of knee joint sections from wildtype and Nsd1Prrx1-Cre mice intra-articularly injected with Egfp or Osr2 adenovirus. Scale bar (top) = 100 μm, scale bar (bottom) = 50 μm. F COL2 IF results of knee joint sections from control and Nsd1Prrx1-Cre mice intra-articularly injected with Egfp or Osr2 adenovirus. Scale bar = 50 μm. Data are expressed as mean ± SD. One-way ANOVA (B, C).
Fig. 7
Fig. 7. NSD1 and OSR2 were decreased in osteoarthritic cartilage.
A Safranin O staining results of normal and osteoarthritic cartilage from knee joint replacement samples. Scale bar = 100 μm. Immunohistochemistry results of NSD1 (B) and OSR2 (C) in normal and osteoarthritic cartilage from knee joint replacement samples. Scale bar = 100 μm. qRT-PCR results of NSD1 (D) and OSR2 (E) in normal and osteoarthritic cartilage from knee joint replacement samples (Normal, n = 15; OA, n = 15). F Correlation analysis between the expression level of NSD1 and OSR2 in all samples. The coefficient value was labeled. G Schematic model of NSD1-H3K36me1/2-Osr2 in the regulation of chondrocyte differentiation and cartilage metabolism. Data are expressed as mean ± SEM. Unpaired t test (D, E).

References

    1. Hunter DJ, March L, Chew M. Osteoarthritis in 2020 and beyond: a Lancet Commission. Lancet. 2020;396:1711–2. doi: 10.1016/S0140-6736(20)32230-3. - DOI - PubMed
    1. Sharma L. Osteoarthritis of the Knee. N Engl J Med. 2021;384:51–9. doi: 10.1056/NEJMcp1903768. - DOI - PubMed
    1. Mahmoudian A, Lohmander LS, Mobasheri A, Englund M, Luyten FP. Early-stage symptomatic osteoarthritis of the knee - time for action. Nat Rev Rheumatol. 2021;17:621–32. doi: 10.1038/s41584-021-00673-4. - DOI - PubMed
    1. Simkin PA. A biography of the chondrocyte. Ann Rheum Dis. 2008;67:1064–8. doi: 10.1136/ard.2007.084574. - DOI - PubMed
    1. Carballo CB, Nakagawa Y, Sekiya I, Rodeo SA. Basic science of articular cartilage. Clin Sports Med. 2017;36:413–25. doi: 10.1016/j.csm.2017.02.001. - DOI - PubMed

Publication types

Substances

LinkOut - more resources