. 2023 Nov 28;42(1):323.
doi: 10.1186/s13046-023-02883-y.

Inhibiting NR5A2 targets stemness in pancreatic cancer by disrupting SOX2/MYC signaling and restoring chemosensitivity

Affiliations

Inhibiting NR5A2 targets stemness in pancreatic cancer by disrupting SOX2/MYC signaling and restoring chemosensitivity

Quan Zheng et al. J Exp Clin Cancer Res. .

Abstract

Background: Pancreatic ductal adenocarcinoma (PDAC) is a profoundly aggressive and fatal cancer. One of the key factors defining its aggressiveness and resilience against chemotherapy is the existence of cancer stem cells (CSCs). The important task of discovering upstream regulators of stemness that are amenable for targeting in PDAC is essential for the advancement of more potent therapeutic approaches. In this study, we sought to elucidate the function of the nuclear receptor subfamily 5, group A, member 2 (NR5A2) in the context of pancreatic CSCs.

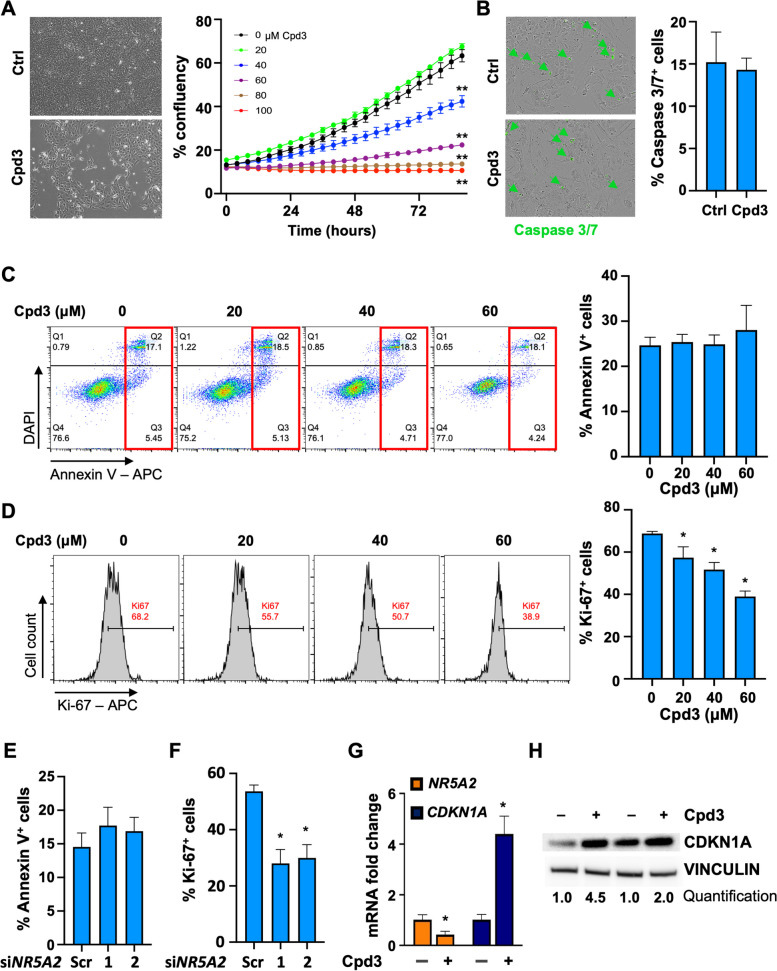
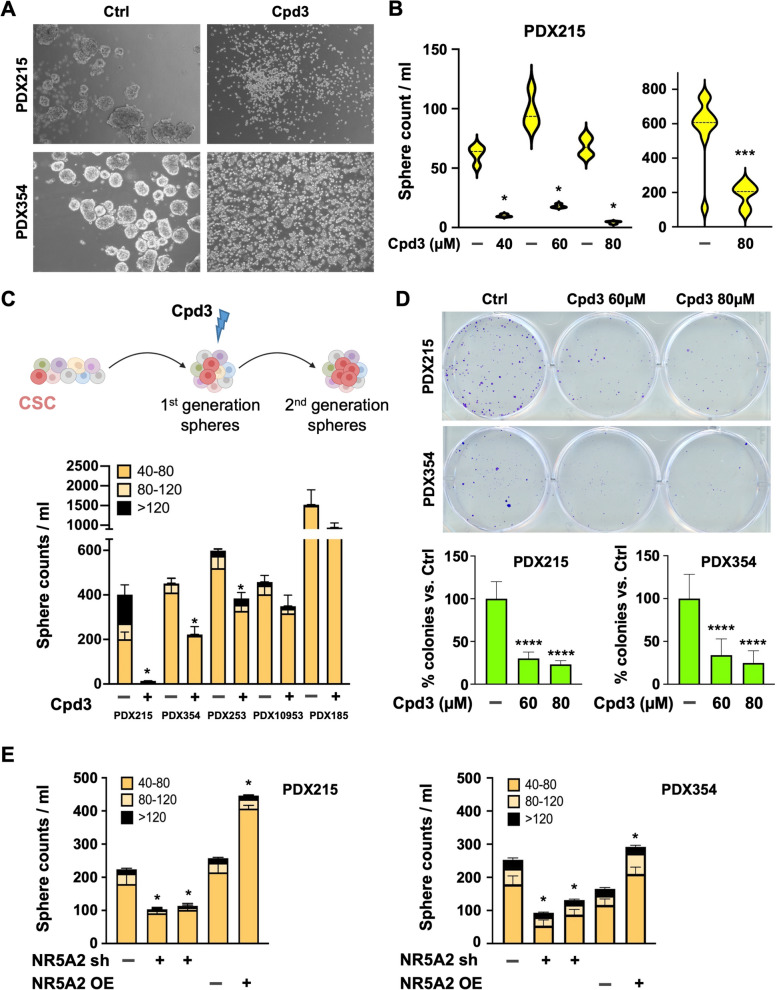
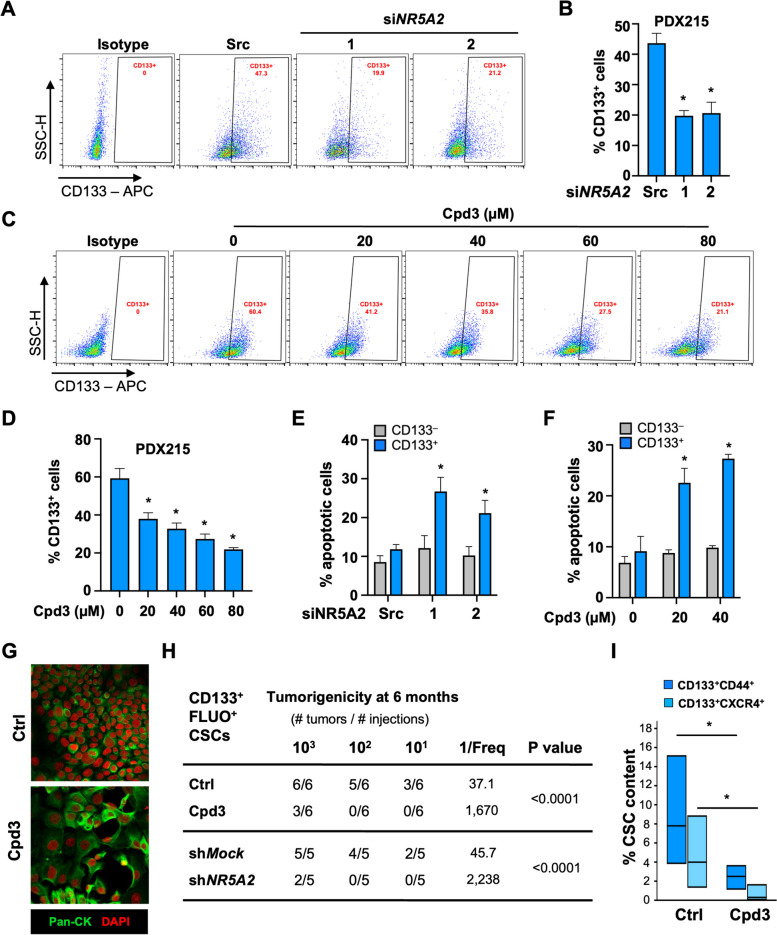
Methods: We modeled human PDAC using primary PDAC cells and CSC-enriched sphere cultures. NR5A2 was genetically silenced or inhibited with Cpd3. Assays included RNA-seq, sphere/colony formation, cell viability/toxicity, real-time PCR, western blot, immunofluorescence, ChIP, CUT&Tag, XF Analysis, lactate production, and in vivo tumorigenicity assays. PDAC models from 18 patients were treated with Cpd3-loaded nanocarriers.

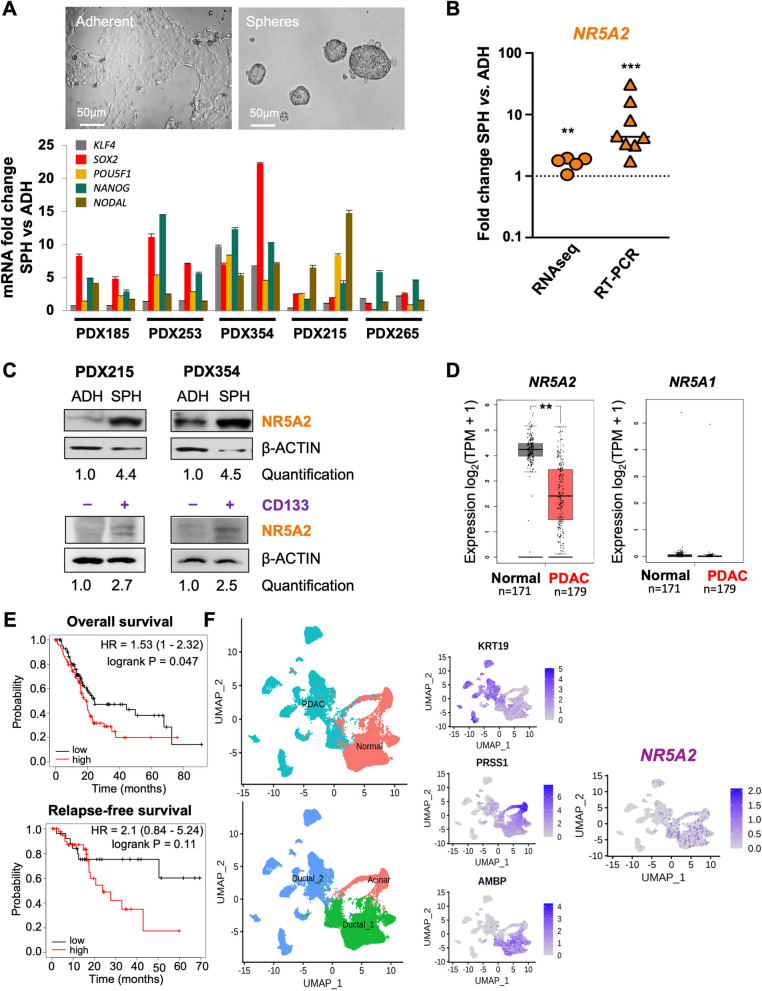
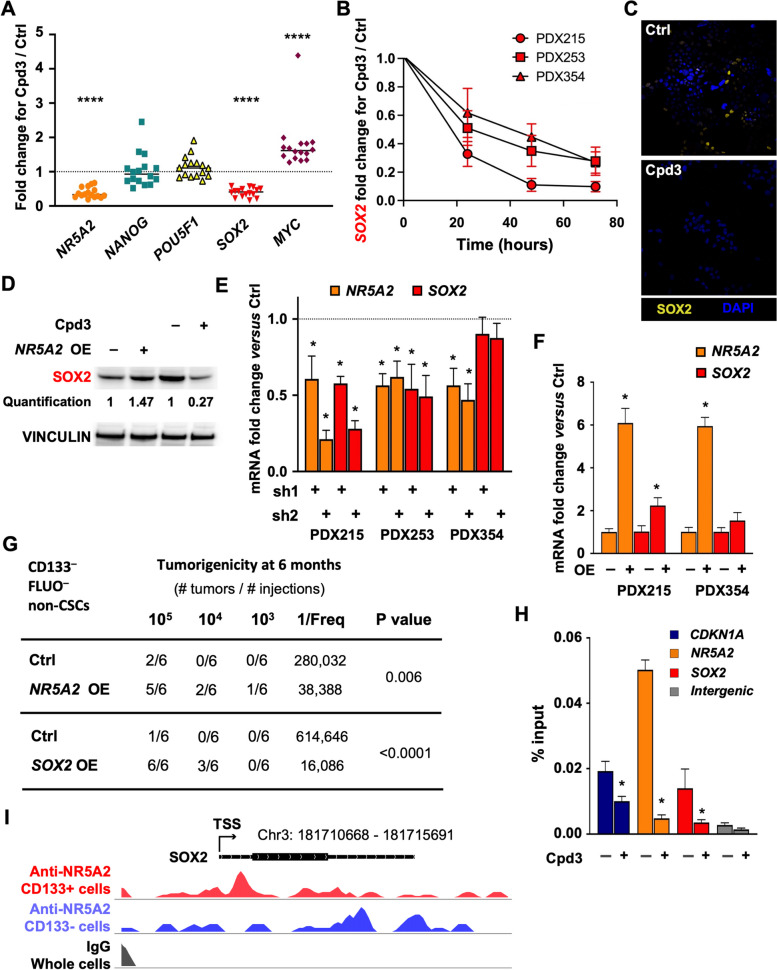
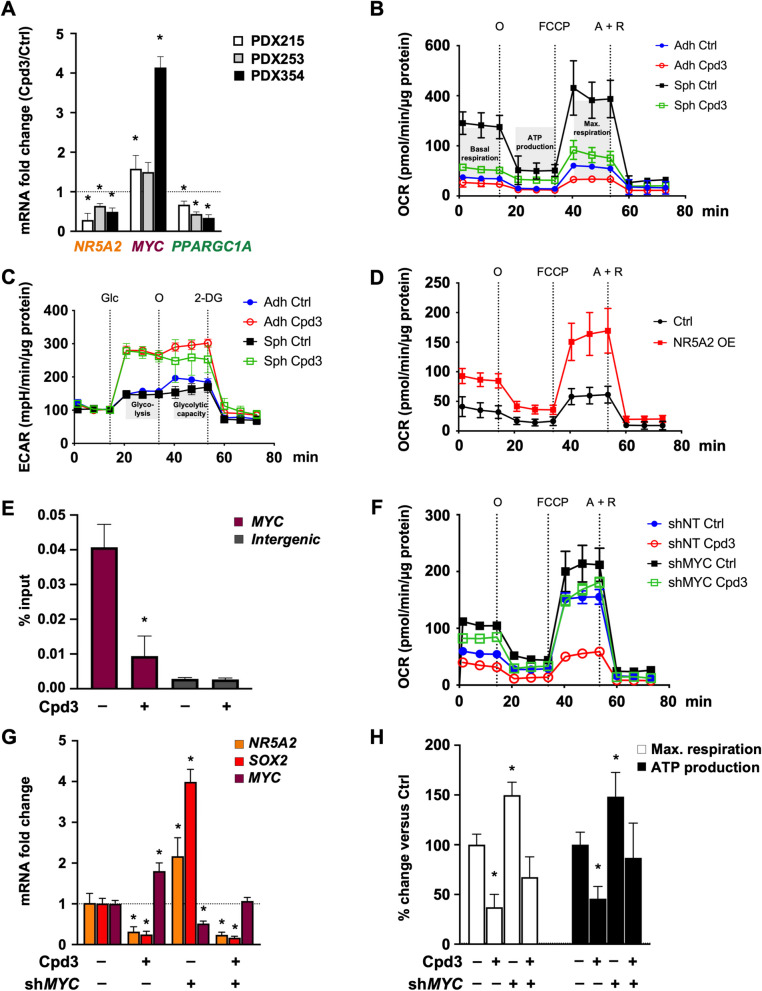
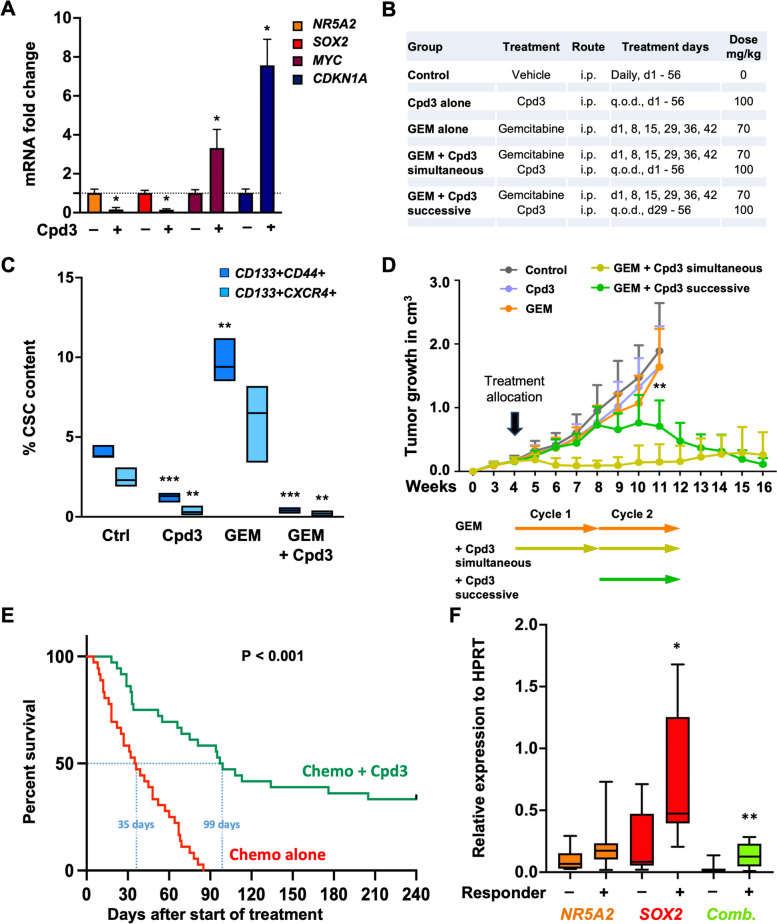
Results: Our findings demonstrate that NR5A2 plays a dual role in PDAC. In differentiated cancer cells, NR5A2 promotes cell proliferation by inhibiting CDKN1A. On the other hand, in the CSC population, NR5A2 enhances stemness by upregulating SOX2 through direct binding to its promotor/enhancer region. Additionally, NR5A2 suppresses MYC, leading to the activation of the mitochondrial biogenesis factor PPARGC1A and a shift in metabolism towards oxidative phosphorylation, which is a crucial feature of stemness in PDAC. Importantly, our study shows that the specific NR5A2 inhibitor, Cpd3, sensitizes a significant fraction of PDAC models derived from 18 patients to standard chemotherapy. This treatment approach results in durable remissions and long-term survival. Furthermore, we demonstrate that the expression levels of NR5A2/SOX2 can predict the response to treatment.

Conclusions: The findings of our study highlight the cell context-dependent effects of NR5A2 in PDAC. We have identified a novel pharmacological strategy to modulate SOX2 and MYC levels, which disrupts stemness and prevents relapse in this deadly disease. These insights provide valuable information for the development of targeted therapies for PDAC, offering new hope for improved patient outcomes. A Schematic illustration of the role of NR5A2 in cancer stem cells versus differentiated cancer cells, along with the action of the NR5A2 inhibitor Cpd3. B Overall survival of tumor-bearing mice following allocated treatment. A total of 18 PDX models were treated using a 2 x 1 x 1 approach (two animals per model per treatment); n=36 per group (illustration created with biorender.com ).

Keywords: Cancer stem cells; MYC; Metabolism; Pancreatic ductal adenocarcinoma; SOX2.


Conflict of interest statement

The authors have no competing interests to disclose.

Figures

Fig. 1
Fig. 1
NR5A2 is overexpressed in pancreatic cancer stem cells. A Upregulation of stemness-related mRNAs in CSC-enriched sphere (SPH) versus adherent (ADH) cultures derived from a diverse set of primary PDAC tumors. Representative images of adherent and sphere cultures are shown in the upper panel. The lower panel represents the quantification of mRNA expression. Each sample was analyzed in biological duplicates, which are displayed side by side. The error bars indicate the mean ± standard deviation (SD) from technical duplicates. B RNA sequencing and qPCR validation for NR5A2 expression expressed as fold-change for adherent (ADH) versus sphere (SPH) cultures. The dotted line indicates reference levels for adherent cells, set as 1.0. RNA sequencing data are displayed as pooled data from n = 5 different PDAC cultures using biological duplicates. The qPCR validation was performed from pooled data derived from n = 8 different PDAC cultures. C Western blot analysis for NR5A2 protein levels in adherent (ADH) versus sphere (SPH) cultures in PDX215 and PDX354 cells (upper panel), as well as in CD133 + versus CD133– sorted PDAC cultures (lower panel). β-Actin was used as the loading control. D NR5A2 and NR5A1 mRNA expression in PDAC versus normal tissue as analyzed by GEPIA 2. E Prognostic significance of NR5A2 mRNA expression levels for overall survival (OS) and relapse-free survival (RFS) for PDAC as analyzed by Kaplan–Meier Plotter databases. F UMAP projections of single-cell RNA-seq data consisting of 24 PDAC tumor samples and 11 control pancreases without any treatment, as described by Peng et al. [24]. The UMAP plots illustrate the clustering of PDAC tumor samples into two distinct groups: cancer cells versus normal cells (left, upper panel) and ductal cells versus acinar cells (left, lower panel). Ductal cells were characterized by the expression of KRT19 and AMBP, while acinar cells exhibited high expression of PRSS1. The UMAP plot on the right visualizes the distribution of NR5A2 expression within the ductal and acinar cell clusters. Asterisks indicate significance at the indicated levels: ** p < 0.01, *** p < 0.001. Please also see Supplementary Fig. 1
Fig. 2
Fig. 2
NR5A2 controls proliferation in differentiated cancer cells and is drugable. A Cell density and morphology were assessed after 72 h of treatment with Cpd3 (40 µM) versus control (Ctrl). Representative results for PDX215 cultures are shown (left). Additionally, the overall cell confluency was monitored over an 80-h period using the IncuCyte® platform (right). B Caspase 3/7 staining for cells treated with control or Cpd3 (40 µM) for 72 h. Quantification and representative images for PDX215 from n = 5 experiments are presented. C Apoptosis analysis was performed using DAPI/Annexin V flow cytometry in PDX215 cells treated with graded doses of Cpd3. The lower right quadrant indicates early apoptosis, while the upper right quadrant represents late apoptosis (marked by the red rectangle). Quantification reveals the percentage of combined early and late apoptotic cells (n = 3). D Flow cytometric dot blot analyses were carried out to examine Ki-67 expression after 72 h of treatment with graded doses of Cpd3 in PDX215 cells. The quantification depicts the percentage of Ki-67+ cells (n = 3). E Apoptosis analysis, measured by DAPI/Annexin V flow cytometry, and the measurement of proliferation (F), indicated by the number of Ki67+ cells, were conducted in PDX215 cells treated with scramble siRNA and the two most effective siNR5A2 variants (#1 and #2) for 72 h. Quantification of four biological replicates is displayed. G qPCR fold change of NR5A2 and CKDN1A (p21) mRNA following 72-h treatment with Cpd3 (80 µM) in PDX215 cells. H Western blot analysis of CDKN1A protein levels following 72 h treatment with Cpd3 (80 µM) in PDX215 cells. Data were presented as mean ± SD and statistically analyzed using two-tailed Mann–Whitney tests. Asterisks indicate significance at the indicated levels: * p < 0.05 and ** p < 0.01. Please also see Supplementary Fig. 2
Fig. 3
Fig. 3
NR5A2 controls stemness in PDAC. A Sphere formation capacity on day 7 following Cpd3 treatment. Representative images for PDX215 and PDX354 following treatment with Cpd3 (60 µM). B Quantification of primary sphere formation capacity on day 7 of Cpd3 treatment for PDX215 (n = 4 biological replicates) and PDX354 (n = 10 biological replicates). Data are shown as violin plots with dotted lines indicating the median. C The schematic (created with biorender.com) illustrates the process of forming first-generation spheres over 7 days. This is succeeded by the disintegration of the formed spheres into a single-cell suspension, and then the commencement of second-generation spheres over another 7-day period, with or without Cpd3 treatment (upper panel). The lower panel shows the secondary sphere formation of cells treated with Cpd3 (60 µM) for five different PDAC cultures. D Colony formation capacity of cells treated with Cpd3 for 72 h. Representative pictures (top), quantification of colony formation (bottom). E Secondary sphere formation capacity following knockdown or overexpression (OE) of NR5A2 for PDX215 and PDX354. In panels C, D, and E data are presented as mean ± SD and statistically analyzed using two-tailed Mann–Whitney tests to compare two groups (n = 4 biological replicates). Asterisks indicate significance at the indicated levels: * p < 0.05, *** p < 0.001, and **** p < 0.0001. Please also see Supplementary Fig. 3
Fig. 4
Fig. 4
Inhibition of NR5A2 specifically eliminates pancreatic cancer stem cells. A Flow cytometry analysis of CD133+ CSCs following 72 h of treatment with siNR5A2 variants #1 and #2; 'src' indicates siScramble. Representative flow cytometry dot plots are displayed. B Quantification of n = 3 biological replicates. C Flow cytometry analysis of CD133+ CSCs following 72 h of treatment with graded doses of Cpd3. Representative data are depicted. D Quantification of CD133+ CSCs in n = 3 biological replicates. E Percentage of apoptotic Annexin V positive cells among CD133 differentiated cancer cells (grey) and CD133+ CSC (blue) following treatment with siNR5A2 variants #1 and #2, and F the percentage among CD133 differentiated cancer cells (grey) and CD133+ CSC (blue) following treatment with 20 and 40 µM Cpd3 in n = 3 biological replicates. G Immunofluorescence for Pan-cytokeratin (green) following 48 h of treatment with 80 µM Cpd3. Nuclei were stained with DAPI (red). H In vivo tumorigenicity of decreasing numbers of highly enriched CD133+ FLUO+ CSCs following pharmacological or genetic targeting of NR5A2. I Flow cytometry for CD133+ CD44+ and CD133+ CXCR4+ CSCs in harvested tumors. In panels A to F, data are presented as mean ± SD and statistically analyzed using two-tailed Mann–Whitney tests to compare two groups (n = 3 biological replicates). In panel I, data are presented as floating bars, and statistically analyzed using two-tailed Mann–Whitney tests to compare two groups (n = 3–6 tumors). Asterisks indicate significance at the indicated levels: * p < 0.05. Please also see Supplementary Fig. 4
Fig. 5
Fig. 5
NR5A2 promotes stemness via direct binding to the SOX2 promoter/enhancer. A qPCR analysis for mRNA levels of stemness-associated genes following 24 h of treatment with Cpd3 (40 µM, n = 4 biological replicates with four technical replicates). The dotted line indicates baseline expression levels, set as 1.0. B Time course for SOX2 RNA levels following Cpd3 treatment (40 µM) at 24, 48, and 72 h. C Immunofluorescence for SOX2 (yellow) following control (Ctrl) DMSO (top) or Cpd3 (bottom) treatment (40 µM) for 72 h. Nuclei are stained with DAPI (blue). D Western blot for SOX2 protein levels following NR5A2 overexpression (left) or 72 h of treatment with Cpd3 (40 µM) (right). E qPCR analysis of mRNA levels for NR5A2 and SOX2 in response to knockdown of NR5A2 using two different shNR5A2 (sh) in three different PDAC cultures. The dotted line indicates baseline expression levels, set as 1.0. F qPCR analysis of mRNA levels for NR5A2 and SOX2 in response to NR5A2 overexpression (OE) in two different PDAC cultures. G In vivo tumorigenicity of decreasing numbers of the most differentiated CD133FLUO pancreatic cancer cells following overexpression (OE) of NR5A2 or SOX2. H Percent input of immunoprecipitated DNA at CDKN1A positive control enhancer, NR5A2 and SOX2 promoters. The intergenic region is used as a negative ChIP control. I CUT&Tag analysis of NR5A2 protein binding at the SOX2 locus. WashU Epigenome browser tracks showing CUT&TAG signals at the SOX2 locus with the indicated transcription start site (TSS). Red signals represent NR5A2 binding in CD133+ PDAC cells (upper track), and purple signals represent NR5A2 binding in CD133- PDAC cells (middle tracks). The black tracks represent the control, consisting of IgG binding in unsorted cells. In panels B, E, F, G, and I, data are presented as mean ± SD and statistically analyzed using two-tailed Mann–Whitney tests to compare two groups (n = 4 biological replicates). Asterisks indicate significance at the indicated levels: * p < 0.05 and **** p < 0.0001
Fig. 6
Fig. 6
NR5A2 promotes stemness by diminishing MYC expression. A qPCR analysis for NR5A2, MYC and PPARGC1A mRNA levels following 72 h of treatment with Cpd3 (40 µM). B Change in oxygen consumption rate (OCR) indicative of mitochondrial respiration following 72 h of treatment with Cpd3 (40 µM) for adherent cultures (Adh, differentiated cancer cells) or sphere cultures (Sph, enriched for CSCs). C Change in extracellular acidification rate (ECAR) indicative of glycolysis following 72 h of treatment with Cpd3 (40 µM) in Adh or Sph cultures. D Change in OCR following overexpression (OE) of NR5A2 in differentiated cancer cells. E Percent input of immuno-precipitated DNA at the MYC promoter following treatment with Cpd3 (40 µM). The intergenic region is used as a negative ChIP control. F OCR levels for shNT or shMYC, following 72 h treatment with DMSO (Ctrl) or Cpd3 (40 µM). G qPCR of mRNA levels for NR5A2, SOX2 and MYC in shNT or shMYC cells, following 72 h of treatment with DMSO (–) or Cpd3 (40 µM). H Changes in maximal (max.) respiration and ATP production in shNT or shMYC cells, following 72 h treatment with DMSO Ctrl (–) or Cpd3 (40 µM). In panels A, E, G, and H data are presented as mean ± SD and statistically analyzed using two-tailed Mann–Whitney tests to compare two groups (n = 4 biological replicates). The asterisk * indicates significance for p < 0.05. Please also see Supplementary Fig. 5
Fig. 7
Fig. 7
NR5A2 inhibition targets CSCs in vivo and extends survival in preclinical PDAC models. A qPCR analysis for NR5A2, SOX2, MYC and CDKN1A mRNA levels following 72 h of treatment with Cpd3 (100 mg/kg body weight) in vivo. Data are presented as mean ± SD (n = 4 biological replicates). B Dosing and timing of allocated treatments for tumor-bearing mice. C CSC content following seven days of allocated treatments. CSCs were defined as CD133+ CD44+ cells or CD133+ CXCR4+ cells as assessed by flow cytometry. Data are presented as floating bars with lines indicating the median for n = 3 tumors per group and statistically analyzed using two-tailed t-tests to compare versus control. D Tumor growth in cm3 according to allocated treatments with two treatment cycles of 28 days each as outlined in (B), with n = 8–9 mice per group. Each mouse carried two tumors. Data are presented as mean ± SD. The arrows below depict treatment cycles, rather than specific treatment intervals or durations within each cycle. E Overall survival of tumor-bearing mice following allocated treatment. A total of 18 PDX models were treated using a 2 × 1 × 1 approach (two animals per model per treatment); n = 36 per group. F qPCR analysis of baseline NR5A2 and SOX2 mRNA levels (n = 8–10 biological replicates). Combined gene expression represents the mathematical product of NR5A2 and SOX2 mRNA levels. Data are presented as box and whisker plots with the center line denoting the median value. In panels A, D, and F data are statistically analyzed using two-tailed Mann–Whitney tests to compare two groups. Asterisks indicate significance at the indicated levels: * p < 0.05, ** p < 0.01, and *** p < 0.001. Please also see Supplementary Fig. 6

References

    1. Neoptolemos JP, Kleeff J, Michl P, Costello E, Greenhalf W, Palmer DH. Therapeutic developments in pancreatic cancer: current and future perspectives. Nat Rev Gastroenterol Hepatol. 2018;15(6):333–348. doi: 10.1038/s41575-018-0005-x. - DOI - PubMed
    1. Collaborators GBDPC The global, regional, and national burden of pancreatic cancer and its attributable risk factors in 195 countries and territories, 1990–2017: a systematic analysis for the Global Burden of Disease Study 2017. Lancet Gastroenterol Hepatol. 2019;4(12):934–47. doi: 10.1016/S2468-1253(19)30347-4. - DOI - PMC - PubMed
    1. Conroy T, Desseigne F, Ychou M, Bouche O, Guimbaud R, Becouarn Y, et al. FOLFIRINOX versus gemcitabine for metastatic pancreatic cancer. N Engl J Med. 2011;364(19):1817–1825. doi: 10.1056/NEJMoa1011923. - DOI - PubMed
    1. Siegel RL, Miller KD, Jemal A. Cancer statistics, 2019. CA Cancer J Clin. 2019;69(1):7–34. doi: 10.3322/caac.21551. - DOI - PubMed
    1. Von Hoff DD, Ervin T, Arena FP, Chiorean EG, Infante J, Moore M, et al. Increased survival in pancreatic cancer with nab-paclitaxel plus gemcitabine. N Engl J Med. 2013;369(18):1691–1703. doi: 10.1056/NEJMoa1304369. - DOI - PMC - PubMed

MeSH terms

Substances

Supplementary concepts