[Preprint]. 2023 Nov 13:arXiv:2311.07791v1.

Comprehensive Overview of Bottom-Up Proteomics using Mass Spectrometry

Affiliations

Comprehensive Overview of Bottom-Up Proteomics using Mass Spectrometry

Yuming Jiang et al. ArXiv. .

Update in

  • Comprehensive Overview of Bottom-Up Proteomics Using Mass Spectrometry.
    Jiang Y, Rex DAB, Schuster D, Neely BA, Rosano GL, Volkmar N, Momenzadeh A, Peters-Clarke TM, Egbert SB, Kreimer S, Doud EH, Crook OM, Yadav AK, Vanuopadath M, Hegeman AD, Mayta ML, Duboff AG, Riley NM, Moritz RL, Meyer JG. Jiang Y, et al. ACS Meas Sci Au. 2024 Jun 4;4(4):338-417. doi: 10.1021/acsmeasuresciau.3c00068. eCollection 2024 Aug 21. ACS Meas Sci Au. 2024. PMID: 39193565 Free PMC article. Review.

Abstract

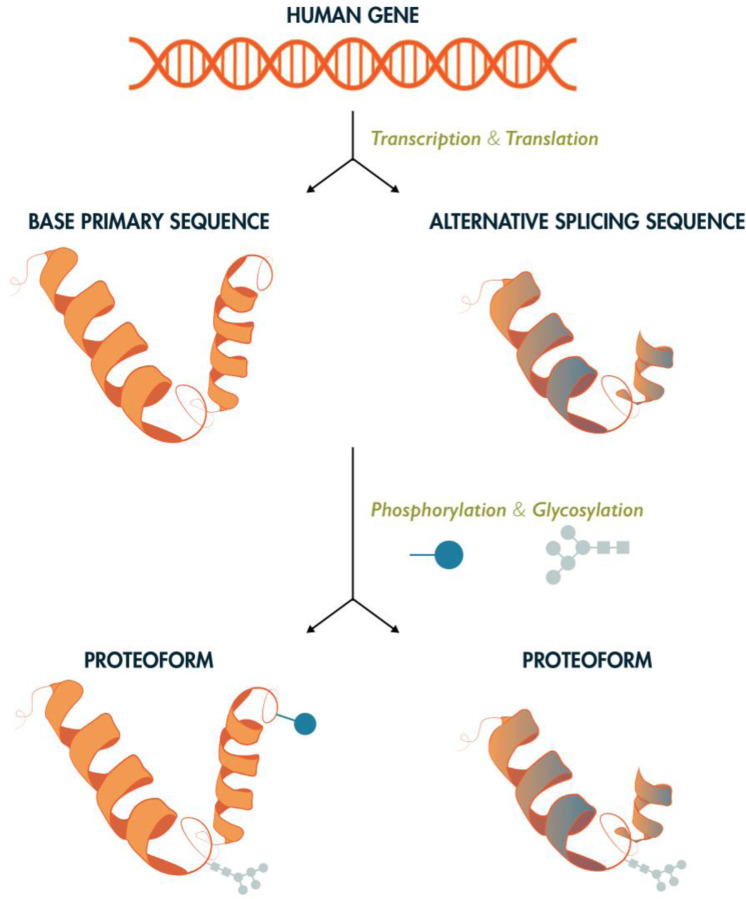
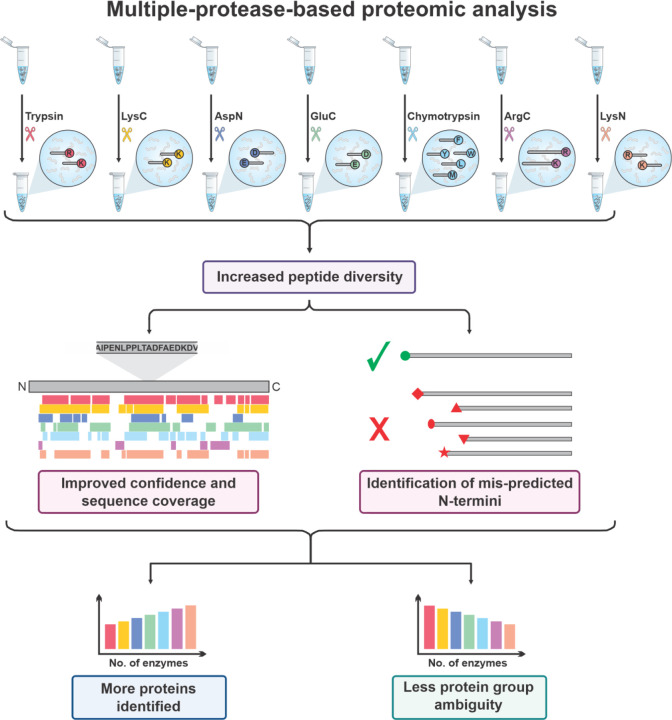
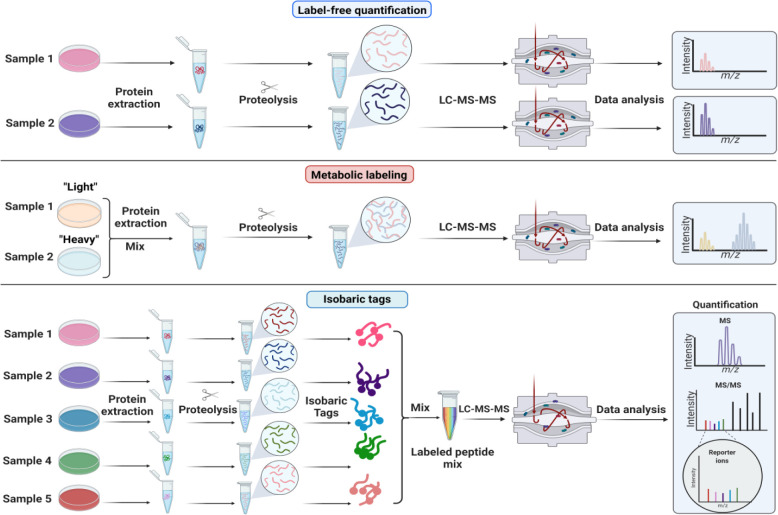
Proteomics is the large scale study of protein structure and function from biological systems through protein identification and quantification. "Shotgun proteomics" or "bottom-up proteomics" is the prevailing strategy, in which proteins are hydrolyzed into peptides that are analyzed by mass spectrometry. Proteomics studies can be applied to diverse studies ranging from simple protein identification to studies of proteoforms, protein-protein interactions, protein structural alterations, absolute and relative protein quantification, post-translational modifications, and protein stability. To enable this range of different experiments, there are diverse strategies for proteome analysis. The nuances of how proteomic workflows differ may be challenging to understand for new practitioners. Here, we provide a comprehensive overview of different proteomics methods to aid the novice and experienced researcher. We cover from biochemistry basics and protein extraction to biological interpretation and orthogonal validation. We expect this work to serve as a basic resource for new practitioners in the field of shotgun or bottom-up proteomics.


Figures

Figure 1:
Figure 1:. Proteome Complexity.
Each gene may be expressed in the form of multiple protein products, or proteoforms, through alternative splicing and incorporation of post-translational modifications. As such, there are many more unique proteoforms than genes. While there exist 20,000 – 23,000 coding genes in the human genome, upwards of 1,000,000 unique human proteoforms may exist. The study of the structure, function, and spatial and temporal regulation of these proteins is the subject of mass spectrometry-based proteomics
Figure 2:
Figure 2:. Multiple protease proteolysis improves protein inference
The use of other proteases beyond Trypsin such as Lysyl endopeptidase (Lys-C), Peptidyl-Asp metallopeptidase (Asp-N), Glutamyl peptidase I, (Glu-C), Chymotrypsin, Clostripain (Arg-C) or Peptidyl-Lys metalloendopeptidase (Lys-N) can generate a greater diversity of peptides. This improves protein sequence coverage and allows for the correct identification of their N-termini. Increasing the number of complimentary enzymes used will increase the number of proteins identified by single peptides and decreases the ambiguity of the assignment of protein groups. Therefore, this will allow more protein isoforms and post-translational modifications to be identified than using Trypsin alone.
Figure 3:
Figure 3:. Quantitative strategies commonly used in proteomics.
A) Label-free quantitation. Proteins are extracted from samples, enzymatically hydrolyzed into peptides and analyzed by mass spectrometry. Chromatographic peak areas from peptides are compared across samples that are analyzed sequentially. B) Metabolic labelling. Stable isotope labeling with amino acids in cell culture (SILAC) is based on feeding cells stable isotope labeled amino acids (“light” or “heavy”). Samples grown with heavy or light amino acids are mixed before cell lysis. The relative intensities of the heavy and light peptide are used to compute protein changes between samples. C) Isobaric or chemical labelling. Proteins are isolated separately from samples, enzymatically hydrolyzed into peptides, and then chemically tagged with isobaric stable isotope labels. These isobaric tags produce unique reporter mass-to-charge (m/z) signals that are produced upon fragmentation with MS/MS. Peptide fragment ions are used to identify peptides, and the relative reporter ion signals are used for quantification.
Figure 4:
Figure 4:
Example chemical structure of isobaric tags “Tandem Mass Tags (TMT)”.
Figure 5:
Figure 5:. Solid phase extraction (SPE).
SPE is a sample preparation technique that uses a solid adsorbent contained most commonly in a cartridge device to selectively adsorb certain molecules from solution. The first step is the conditioning of the cartridge which involves wetting the adsorbent to solvate its functional groups and filling the void spaces with solvent thereby removing any air in the column. This is necessary to produce a suitable environment for adsorption and thus ensure reproducible interaction with the analytes. After conditioning, the sample is loaded in the cartridge. This can be performed with the aid of positive or negative pressure to ensure a constant flow rate. In this step molecules bind the adsorbent and interferences pass through. Next, the column is washed with the mobile phase to eliminate the contaminants while ensuring the analyte remains bound. Finally, peptides are eluted in an appropriate buffer solution with polarity or charge that competes with interaction with the solid phase.
Figure 6:
Figure 6:. MALDI
The analyte-matrix mixture is irradiated by a laser source, leading to ablation. Desorption and proton transfer ionize the analyte molecules that can then be accelerated into a mass spectrometer.
Figure 7:
Figure 7:. Electrospray Ionization
Charged droplets are formed, their size is reduced due to evaporation until charge repulsion leads to Coulomb fission and results in charged analyte molecules.
Figure 8:
Figure 8:. Diagram of typical mass spectrometer modules.
Systems must have an ion source, mass analyzer, detector, vacuum system, and control system.
Figure 9:
Figure 9:. Schematic diagram of typical QqQ system.
Three quadrupoles enable precursor selection, fragmentation, and the fragment ion selection.
Figure 10:
Figure 10:. Schematic diagram of a typical quadrupole time-of-flight mass spectrometer.
Like a QQQ, a Q-TOF will have two quadrupoles for selection and fragmentation followed by the TOF for the final higher resolution separation and detection.
Figure 11:
Figure 11:. Schematic diagram of orbitrap.
(A) Close up of an Orbitrap. (B) General schematic of complete Q-Orbitrap system.
Figure 12:
Figure 12:. Schematic of FT-ICR.
(A) Typical FT-ICR cell. (B) Example of complete FT-ICR system.
Figure 13:
Figure 13:. Ion Mobility.
(A) Conceptional diagram of three types of ion mobility strategies. (B) Schematic of drift tube ion mobility spectrometry. (C) Schematic of high field asymmetric waveform ion mobility spectrometry (FAIMS). (D) Schematic of trapped ion mobility spectrometry (TIMS).
Figure 14:
Figure 14:. Peptide Fragmentation Methods.
(A) Sequence-informative fragment ions are termed a/x-, b/y-, and c/z-type fragments depending on which bond along the peptide backbone breaks. Fragments that explain the intact N-terminus of the peptide are a-, b-, and c-type ions, while x-, y-, and z-type ions explain the intact C-terminus of the peptide. Other panels show common dissociation methods, including collision, electron, and photon-based fragmentation. (B) Resonant collision-induced dissociation (resCID) and beam-type CID (beamCID) both produce mainly b/y-type sequencing ions through collisions with background gases like helium and nitrogen that increase the internal energy of peptide cations. (C) Electron capture and electron transfer dissociation (ECD and ETD) generate mainly c/z-type fragments through electron-mediated radical driven cleavage of the peptide backbone. (D) Infrared multi-photon dissociation (IRMPD) is a slow heating method similar in dissociation mechanism to resCID, but very different in implementation due to the IR lasers required (often with lower energy 10.6 micron photons). Ultraviolet photodissociation (UVPD) can use a range of wavelengths (popular options shown) to introduce higher energy photons to peptide cations, causing vibrational and electronic excitation that can generate all major fragment ion types depending on wavelength used.
Figure 15:
Figure 15:. Types of DIA.
A) SRM/MRM. Peptides are ionized by ESI and although there are many peptides entering the mass spectrometer at any time, the first quadrupole (Q1) isolates one mass, which is then fragmented by HCD. Fragment masses from the peptide are then selected in the third quadrupole (Q3). This leads to very low noise and high sensitivity. B) PRM. Like MRM, peptides are selected in the first quadrupole, but this analysis is done on a high-resolution instrument like an Orbitrap or TOF. Selectivity is gained by exploiting the high mass accuracy and resolution to monitor multiple fragment ions. C) uDIA/SWATH. Like MRM and PRM, peptides are isolated with Q1, but in this case a much wider isolation window is used. This usually results in co-isolation of many peptides simultaneously. Fragments from many peptides are measured with high resolution and high mass accuracy. Special software is used to get peptide identities and quantities from the fragment ions.
Figure 16:
Figure 16:. Proteomics Data Analysis and Biological Interpretation.
The process begins with protein identification and quantification using tools such as Proteome Discoverer, Spectronaut, Spectromine, MS Fragger, MaxQuant, and Skyline. Quality control measures ensure data integrity, leading to a biological interpretation of the results. Differential expression analyses may include relative abundance charts, heat maps, and volcano plots. Functional analysis encompasses gene ontology, protein-protein interactions, and signaling pathways.
Figure 17:
Figure 17:. The Human PeptideAtlas as of 2023.
A) The current total search space and identified elements of the 2023 Human PeptideAtlas. B) Historical cumulative plot of the identified total proteins (blue vertical bars) and the unique proteins identified per dataset (red vertical bars) over the total period of 2005–2023.
Figure 18:
Figure 18:. Analysis of a simple network using different centrality measurements.
Nodes are colored according to each metric using a yellow-to-red gradient (yellow: lowest value, red: highest value). Network visualization and analysis were performed in Cytoscape.
Figure 19:
Figure 19:. Types of functional enrichment methods.
In the volcano plot (left), proteins with altered values are colored blue or red according to arbitrarily chosen cut-off values for significance and fold change. Black bars or thick-bordered nodes indicate members of a GO category.

References

    1. Enzyme-less nanopore detection of post-translational modifications within long polypeptides Martin-Baniandres Pablo, Lan Wei-Hsuan, Board Stephanie, Romero-Ruiz Mercedes, Garcia-Manyes Sergi, Qing Yujia, Bayley Hagan Nature Nanotechnology (2023-July-27) https://doi.org/gs3f47 DOI: 10.1038/s41565-023-01462-8 - DOI - PMC - PubMed
    1. Nanopore Detection Using Supercharged Polypeptide Molecular Carriers Wang Xiaoyi, Thomas Tina-Marie, Ren Ren, Zhou Yu, Zhang Peng, Li Jingjing, Cai Shenglin, Liu Kai, Ivanov Aleksandar P, Herrmann Andreas, Edel Joshua B Journal of the American Chemical Society (2023-March-10) https://doi.org/gs3f46 DOI: 10.1021/jacs.2c13465 - DOI - PMC - PubMed
    1. Real-time shape approximation and fingerprinting of single proteins using a nanopore Yusko Erik C, Bruhn Brandon R, Eggenberger Olivia M, Houghtaling Jared, Rollings Ryan C, Walsh Nathan C, Nandivada Santoshi, Pindrus Mariya, Hall Adam R, Sept David, … Mayer Michael Nature Nanotechnology (2016-December-19) https://doi.org/gfx2jk DOI: 10.1038/nnano.2016.267 - DOI - PubMed
    1. Nanopore-Based Protein Identification Bakshloo Mazdak Afshar, Kasianowicz John J, Pastoriza-Gallego Manuela, Mathé Jérôme, Daniel Régis, Piguet Fabien, Oukhaled Abdelghani Journal of the American Chemical Society (2022-February-04) https://doi.org/gr9grc DOI: 10.1021/jacs.1c11758 - DOI - PubMed
    1. Highly parallel single-molecule identification of proteins in zeptomole-scale mixtures Swaminathan Jagannath, Boulgakov Alexander A, Hernandez Erik T, Bardo Angela M, Bachman James L, Marotta Joseph, Johnson Amber M, Anslyn Eric V, Marcotte Edward M Nature Biotechnology (2018-October-22) https://doi.org/gfg4bk DOI: 10.1038/nbt.4278 - DOI - PMC - PubMed

Publication types