

This is a preprint.
It has not yet been peer reviewed by a journal.
The National Library of Medicine is
running a pilot
to include preprints that result from research funded by NIH in PMC and PubMed.
[Preprint]. 2023 Sep 29:2023.09.09.556388.
doi: 10.1101/2023.09.09.556388.
C4 induces pathological synaptic loss by impairing AMPAR trafficking
Affiliations
- PMID: 38014001
- PMCID: PMC10680816
- DOI: 10.1101/2023.09.09.556388
Item in Clipboard
C4 induces pathological synaptic loss by impairing AMPAR trafficking
bioRxiv.
.
Update in
-
The schizophrenia risk gene C4 induces pathological synaptic loss by impairing AMPAR trafficking.Mol Psychiatry. 2025 Feb;30(2):796-809. doi: 10.1038/s41380-024-02701-7. Epub 2024 Sep 3. Mol Psychiatry. 2025. PMID: 39227431 Free PMC article.
Abstract
During development, activation of the complement pathway, an extracellular proteolytic cascade, results in microglia-dependent synaptic elimination via complement receptor 3 (CR3). Here, we report that decreased connectivity caused by overexpression of C4 (C4-OE), a schizophrenia-associated gene, is CR3 independent. Instead, C4-OE triggers GluR1 degradation through an intracellular mechanism involving endosomal trafficking protein SNX27, resulting in pathological synaptic loss. Moreover, the connectivity deficits associated with C4-OE were rescued by increasing levels of SNX27, linking excessive complement activity to an intracellular endolysosomal recycling pathway affecting synapses.
Figures

(A) Representative images (60X) showing GFP-positive dendritic spine (white), SNX27 (green) and C4 (magenta) of DIV 14 cultured prefrontal cortical neurons. White dotted line indicates spine morphology. Scale bar = 0.5 μm. (B) Normalized intensity profile of a line drawn through a spine head and colocalizing SNX27 and C4 clusters in panel (A) showing intensities of GFP (grey line), SNX27 (green) and C4 (magenta). (C) Orthogonal views of panel (A) are shown (XY, YZ and XZ). Yellow arrowhead indicates an instance of SNX27 and C4 colocalization in the spine. (D) Representative images (60X) showing GFP-positive dendrites (white), SNX27 (green) and C4 (magenta) of DIV 14 cultured prefrontal cortical neurons, were used for colocalization analysis. All channels of the image were individually thresholded to calculate area colocalization of C4 and SNX27 in the dendrite. White dotted line indicates dendritic morphology. Scale bar = 2 μm. (E) Analysis of cluster signals of overexpressed C4 and SNX27 showed that approximately 41% of C4 area colocalized with SNX27 and approximately 44% of SNX27 area colocalized with C4 in dendrites. N=7 dendritic segments, from 3 cells. All graphs, Mean ± SEM.

(A) C4-OE did not lead to any change in average cluster volume of GluR1 (left panel) or Rab11a (right panel). (B, C) Cluster radii distribution of GluR1 (green) and Rab11a (magenta) in GFP-control (B) and C4-OE (C) respectively. (D) C4-OE did not lead to any change in average cluster volume of GluR1 (left panel) or LAMP1 (right panel). (E, F) Cluster radius distribution of GluR1 (green) and LAMP1 (magenta) in GFP-control (E) and C4-OE (F) respectively. (A-C) N=8 dendrites, 3 animals for GFP-control and C4-OE. (D-F) N=7 dendrites, 3 animals for GFP-control and N=8 dendrites, 3 animals C4-OE. GluR1 was co-stained in the same brain slice with Rab11a (GluR1+Rab11a) or with LAMP1 (GluR1+LAMP1). All statistics are with student’s t test. All graphs, Mean ± SEM.

(A) Left: In utero electroporation (IUE) procedure performed on E16 embryos. GFP-control (Con) represents the transfection of a single plasmid (GFP under the CAG promoter), while C4-OE represents the transfection of two plasmids (GFP and C4, both under the CAG promoter). Right: Representative 60X confocal image of P21–23 L2/3 mPFC neurons transfected with GFP (green). DAPI, cytoarchitecture. White dotted line, pia. Scale bar = 100 μm. (B) Model depicting the mechanism of spine removal through C3b recognition by the microglia expressing CR3. (C) Left: Representative confocal image (60X) of CR3KO-control (blue squares) and CR3KO C4-OE (red circles). GFP, white signal. Scale bar = 2 μm. Right: C4-OE in mice lacking the CR3 showed decreased dendritic spine density relative to control CR3-KO mice. t test. *p<0.05. (D) Structure of wt C4 and C4 mutants (C4-ΔC345C and C4-GFP). C4 comprises three main chains (β, α and γ) and a highly conserved C-terminal domain known as C345C (cyan). (E) Left: Representative confocal image (60X) of Control and C4 mutants. Right: OE of wt C4 and mutants C4-GFP-OE and ΔC345C-OE caused a decrease in dendritic spine density relative to GFP-control. One-way ANOVA. **p<0.01, ***p<0.001, ****p<0.0001. Scale bar = 2 μm. (F) Western blot (WB) showing co-IP from HEK293T cells transfected with SNX27 and either C4, C4-ΔC345C or C4-GFP plasmids. The presence of C4, SNX27 and GAPDH proteins was detected by Western blotting in HEK293T cell lysates (Input). Interaction of wt C4 and C4 mutants with SNX27 was detected by Western blotting of co-IP against FLAG-tagged SNX27 (IB: FLAG). Protein molecular weights are indicated in kilodaltons (kDa) on the left. + indicated presence of wild type protein. (G) HEK293T cells were transfected with either no plasmid (Control, blue circle), Snx27 only (Snx27, yellow squares), Snx27 with scr-shRNA (scrambled control, gray triangles) or Snx27 with Snx27 shRNA (shSnx27, cyan circles). Compared to Snx27 and scr-shRNA control, shSnx27 led to approximately 85% knockdown, normalized to GAPDH loading control. t test. **p<0.01. (H) Left: Representative confocal image (60X) of scr-shRNA control (solid blue triangles) and shSNX27 (solid red triangles). GFP, white signal. Scale bar = 2 μm. Right: SNX27 KD led to a decrease in spine density relative to scr-shRNA. t test. **p<0.01. (C) N=13 CR3KO-control dendrites, 3 animals; N=12 CR3KO-C4-OE dendrites, 3 animals, (E) N=9 GFP-control dendrites, N=10 C4-OE and C4-ΔC345C-OE dendrites, N=11 C4-GFP dendrites, 3 animals each. (H) N=10 scr-shRNA control and shSNX27 dendrites, 3 animals each. All graphs, Mean ± SEM.
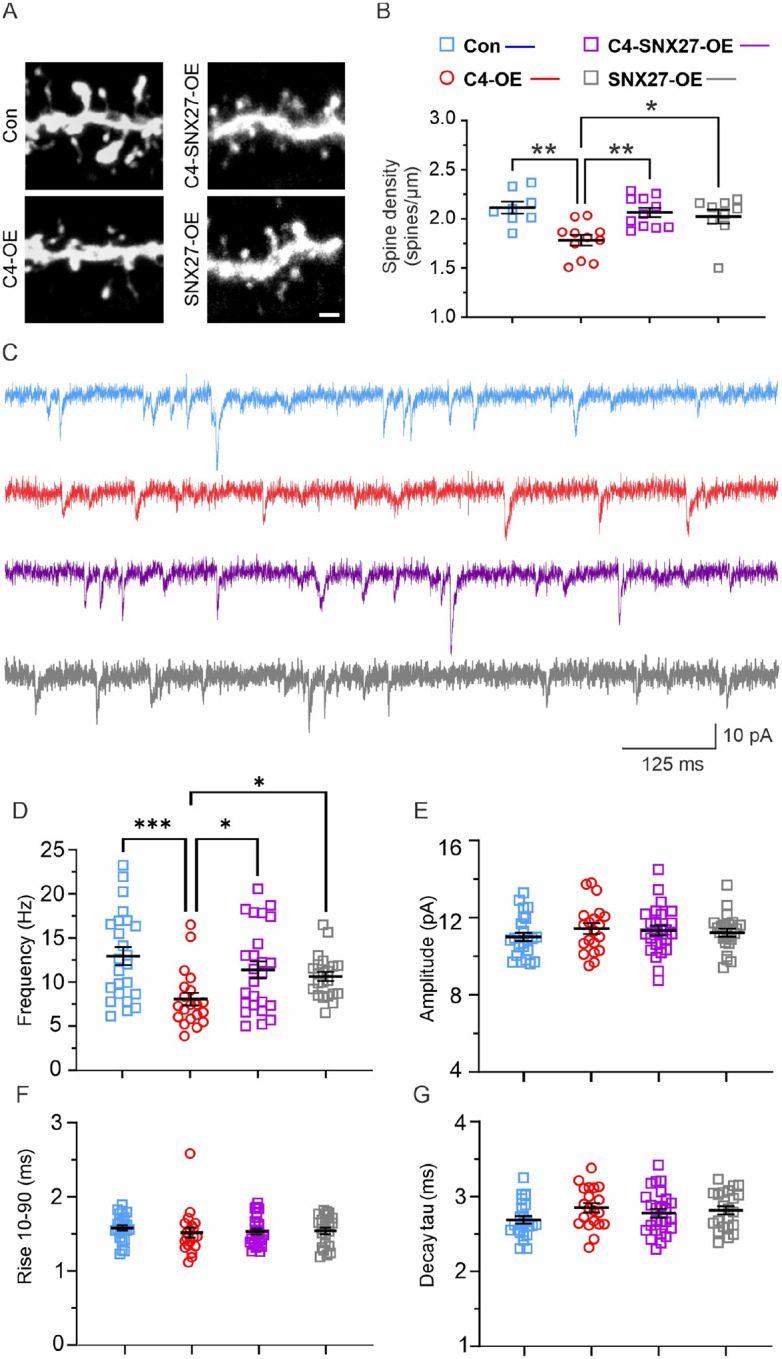
(A) Representative confocal image (60X) of GFP-positive P21–23 L1 apical tufts in GFP-control (Con, blue squares), C4-OE (red circles), C4-SNX27-OE (purple squares) and SNX27-OE (gray square) in the mPFC. GFP, white signal. Scale bar = 2 μm. (B) C4-OE led to decreased dendritic spine density relative to GFP-control. However, this synaptic pathology was rescued by simultaneous OE of SNX27 (C4-SNX27-OE). SNX27-OE on its own did not lead to changes in dendritic spine density. One-way ANOVA. *p<0.05, **p<0.01. (C) Representative traces of mEPSCs in GFP-control (blue), C4-OE (red), C4-SNX27-OE, (purple), and SNX27-OE (gray) L2/3 mPFC pyramidal neurons from P20–25 animals. Scale bars, 125 ms,10 pA. (D) mEPSC frequency was decreased in C4-OE relative to GFP-control (Kruskal-Wallis one-way ANOVA. **p<0.01; GFP-control vs. C4-OE, Dunn’s multiple comparison test. ***p<0.001) but was rescued when C4 and SNX27 were co-overexpressed (C4-OE vs. C4-SNX27-OE, Dunn’s multiple comparison test. *p<0.05). SNX27-OE alone did not alter mEPSC frequency relative to GFP-control (Con vs. SNX27-OE, Dunn’s multiple comparison test. p>0.9999) but was significantly greater than in C4-OE (C4-OE vs. SNX27-OE, Dunn’s multiple comparison test. *p<0.05). Hz; Hertz. (E–G) There were no differences in the amplitude (E, One-way ANOVA. p=0.6241), Rise 10–90 (F, Kruskal-Wallis One-way ANOVA. p=0.4346), and Decay tau (G, One-way ANOVA. p=0.2122). N=24 GFP-control cells, from 6 animals. N=20 C4-OE cells, from 4 animals. (B) N=8 control dendrites, N=9 C4-SNX27-OE dendrites, N=11 C4-OE and SNX27-OE dendrites, 3 animals each. (D–G) N=25 C4-SNX27-OE cells, from 4 animals. N=22 SNX27-OE cells, from 5 animals. All graphs, Mean ± SEM.

(A) Model depicting effects of C4 overexpression on GluR1 recycling in dendritic spines. (B) Representative images (60X) showing a GFP-positive dendritic spine (white), GluR1 (green) and Rab11a (magenta) of P21–23 apical tufts in GFP-controls (blue frame). Orthogonal views are shown (XY, YZ and XZ). Yellow arrowhead indicates an instance of GluR1 or Rab11a clusters in spines. White-filled arrowhead indicates an instance of GluR1/Rab11a colocalization. Spine silhouette, white dotted line. Scale bar = 2 μm. (C) Representative images (60X) showing a dendritic spine identified with GFP signal (white), GluR1 (green) and Rab11a (magenta) in C4-OE (red frame). Orthogonal views are shown (XY, YZ and XZ). Yellow arrowhead indicates an instance of GluR1 or Rab11a clusters in spines. White empty arrowhead indicates an instance of non-colocalized GluR1/Rab11a. Spine silhouette, white dotted line. Scale bar = 2 μm. (D) C4-OE caused a 47% decrease in the amount of GluR1 colocalized with Rab11a compared to GFP-control. (E) There was no change in the amount of Rab11a colocalized with GluR1 in C4-OE relative to GFP-control. (F) C4-OE increased the minimum distance between GluR1 and Rab11a clusters by 35% relative to GFP-control. Green circle: GluR1, Magenta circle: Rab11a. (G) C4-OE led to a 25% decrease in the overlapping volume between GluR1 and Rab11a relative to GFP-control. Green circle: GluR1, Magenta circle: Rab11a. (H) Schematic showing the effects of C4-OE on GluR1 degradation in dendritic spines. (I) Representative images (60X) showing a GFP-positive spine (white), GluR1 (green) and LAMP1 (magenta) in GFP-control (blue frame). Orthogonal views are shown (XY, YZ and XZ). Yellow arrowheads indicate instances of GluR1 or LAMP1 clusters present in spines. White empty arrowhead indicates an instance of non-colocalized GluR1/LAMP1. Spine silhouette, white dotted line. Scale bar = 2 μm. (J) Representative images (60X) showing a GFP-positive spine (white), GluR1 (green) and LAMP1 (magenta) in C4-OE (red frame). Orthogonal views are shown (XY, YZ and XZ). Yellow arrowhead indicates an instance of GluR1 or Rab11a clusters in spines. White-filled arrowhead indicates an instance of GluR1/LAMP1 colocalization. Spine silhouette, white dotted line. Scale bar = 2 μm. (K) C4-OE led to a 145% increase in the amount of GluR1 colocalized with LAMP1. (L) C4-OE caused a 103% increase in the amount of LAMP1 colocalized with GluR1. (M) C4-OE induced a 31% decrease in the minimum distance between GluR1 and LAMP1 clusters. Green circle: GluR1, Magenta circle: LAMP1. (N) Compared to GFP-control, C4-OE did not alter the overlapping volume between GluR1 and LAMP1. Green circle: GluR1, Magenta circle: LAMP1. (D–E, K–L) N=8 dendrites, 3 animals for Con and C4-OE. (F–G, M–N) N=7 dendrites, 3 animals for Con and N=8 dendrites, 3 animals C4-OE. (D–G, K–N) t test. *p<0.05, **p<0.01, ***p<0.001. All graphs, Mean ± SEM.
References
-
- Schafer D. P.; Lehrman E. K.; Kautzman A. G.; Koyama R.; Mardinly A. R.; Yamasaki R.; Ransohoff R. M.; Greenberg M. E.; Barres B. A.; Stevens B. Microglia Sculpt Postnatal Neural Circuits in an Activity and Complement-Dependent Manner. Neuron 2012, 74 (4), 691–705. 10.1016/j.neuron.2012.03.026. - DOI - PMC - PubMed
-
- Stevens B.; Allen N. J.; Vazquez L. E.; Howell G. R.; Christopherson K. S.; Nouri N.; Micheva K. D.; Mehalow A. K.; Huberman A. D.; Stafford B.; Sher A.; Litke A. M. M.; Lambris J. D.; Smith S. J.; John S. W. M.; Barres B. A. The Classical Complement Cascade Mediates CNS Synapse Elimination. Cell 2007, 131 (6), 1164–1178. 10.1016/j.cell.2007.10.036. - DOI - PubMed
Publication types
Grants and funding
LinkOut - more resources
Full Text Sources
Research Materials
Miscellaneous