[Preprint]. 2023 Nov 17:rs.3.rs-3471275.
doi: 10.21203/rs.3.rs-3471275/v1.

Integrated multi-omics single cell atlas of the human retina

Affiliations

Integrated multi-omics single cell atlas of the human retina

Jin Li et al. Res Sq. .

Abstract

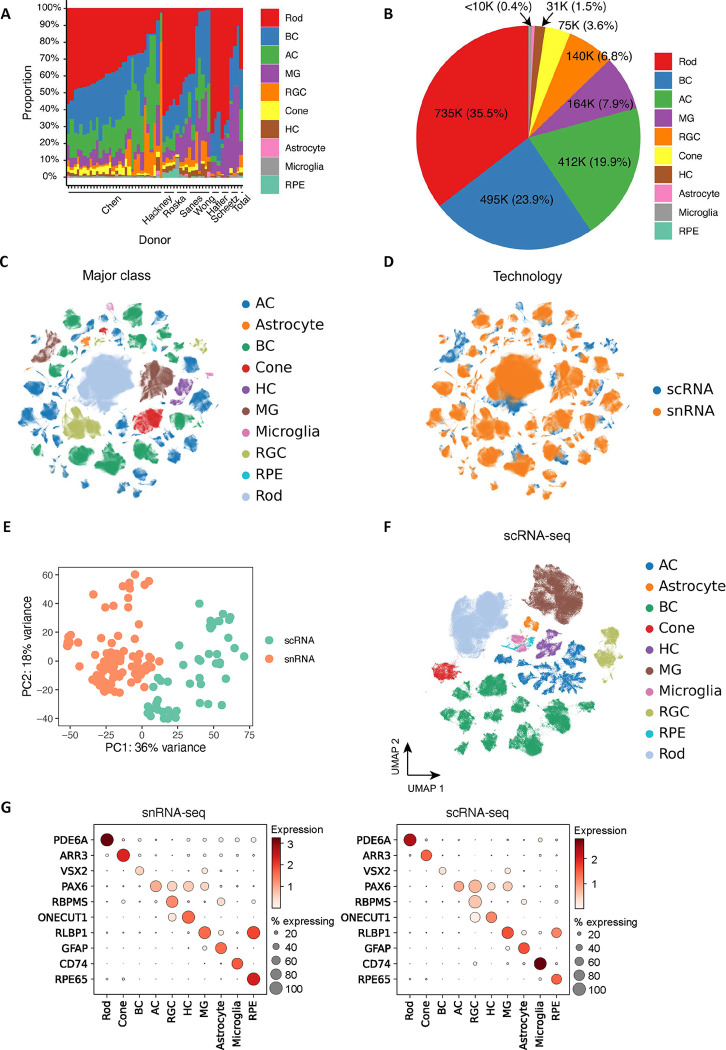
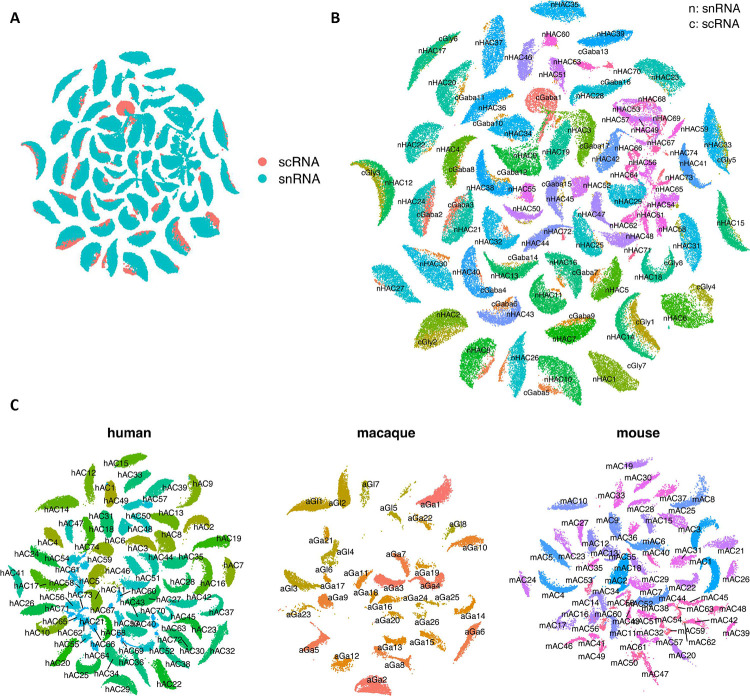
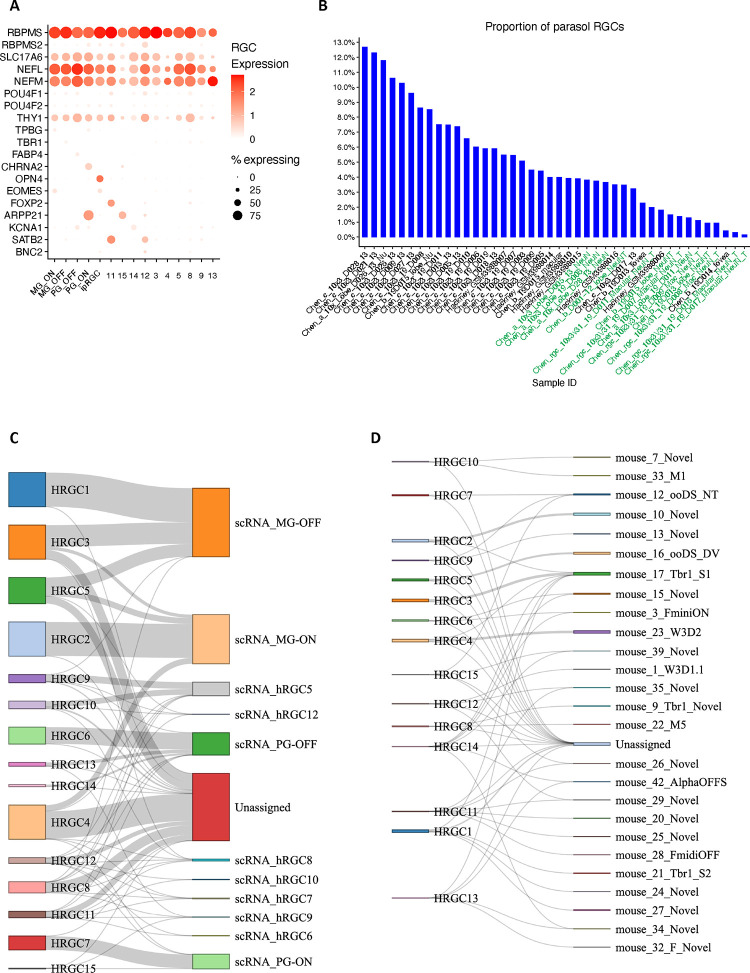
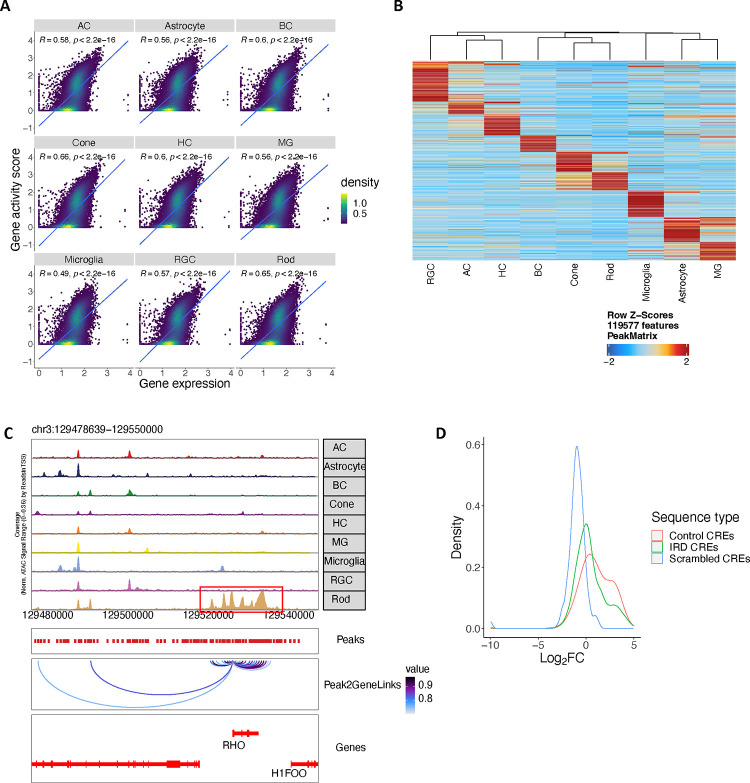
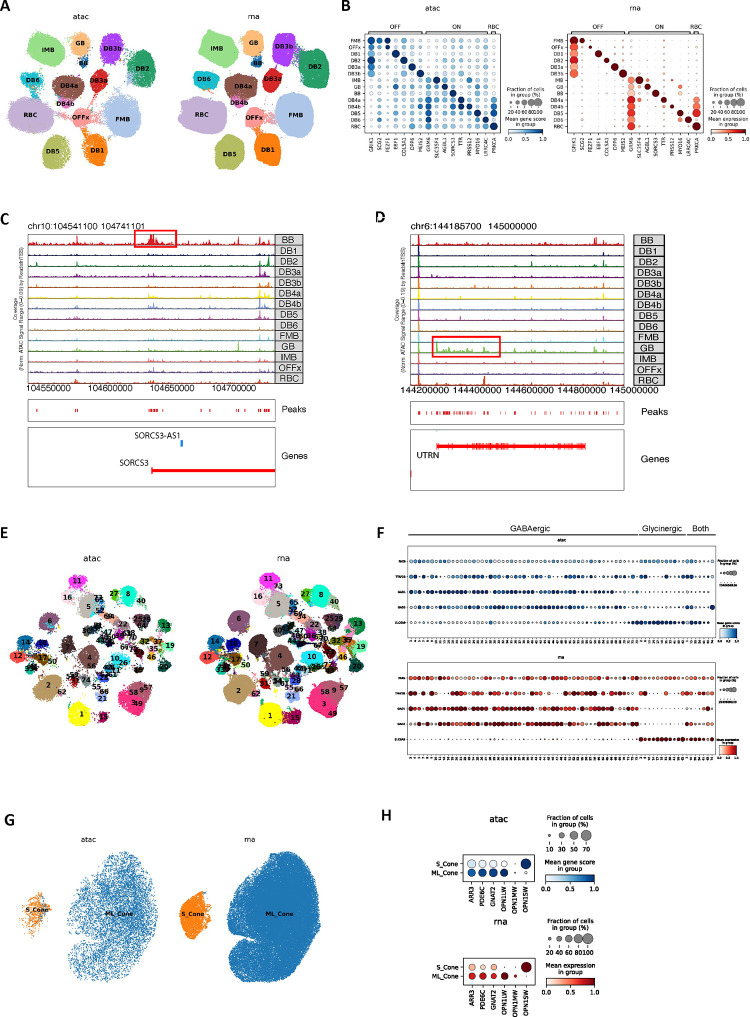
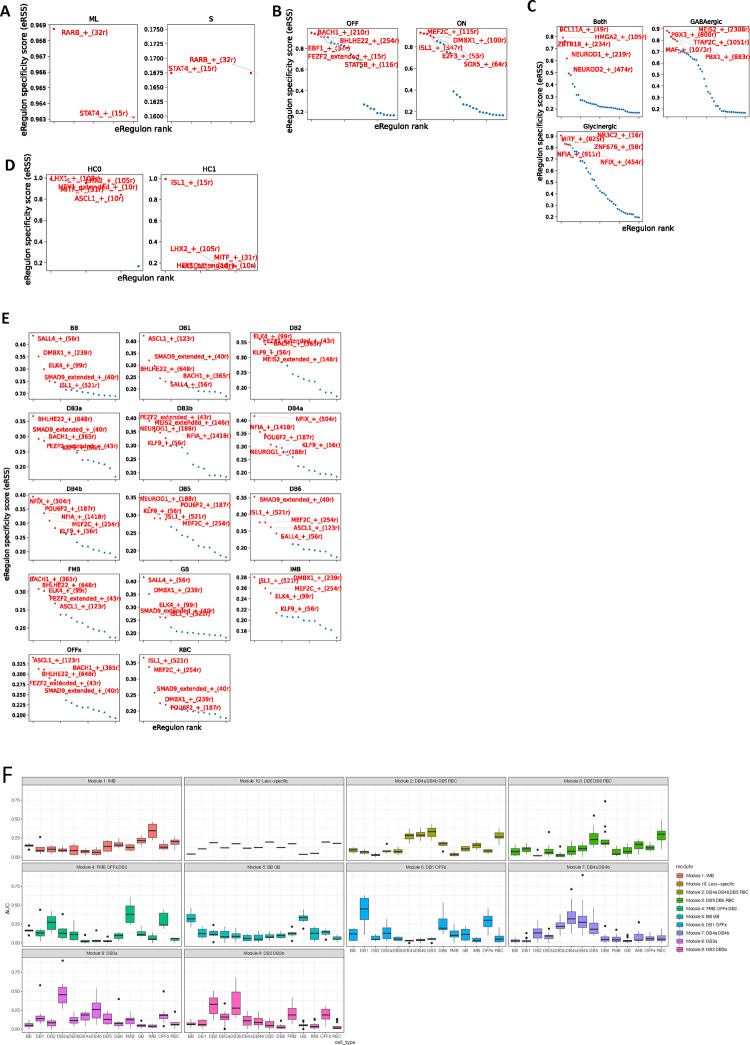
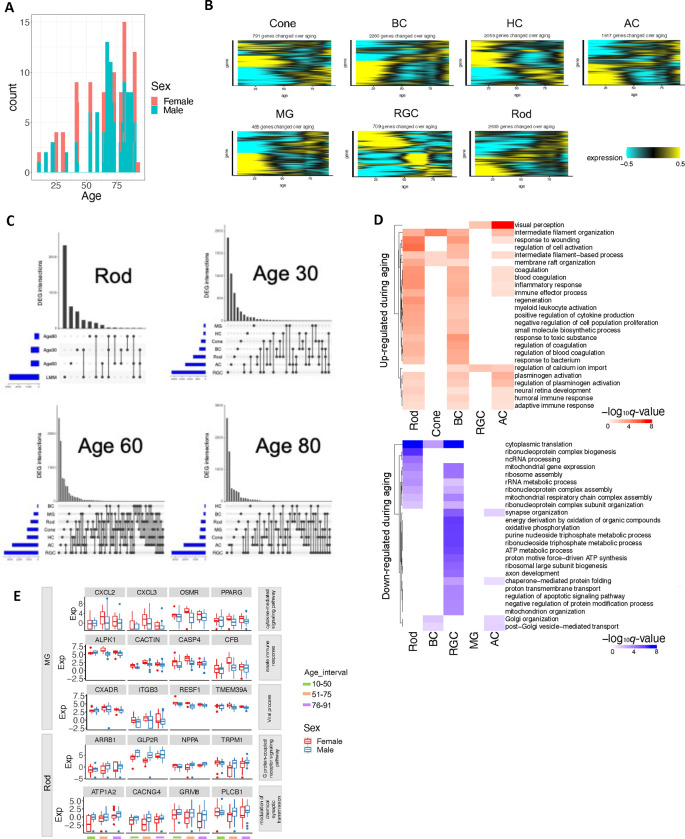
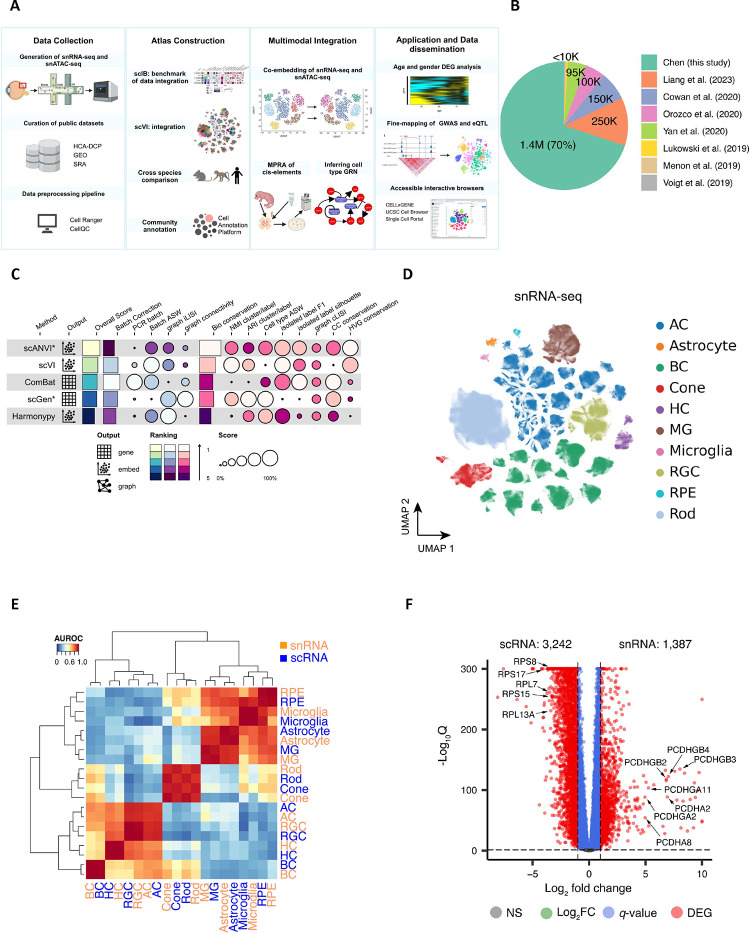
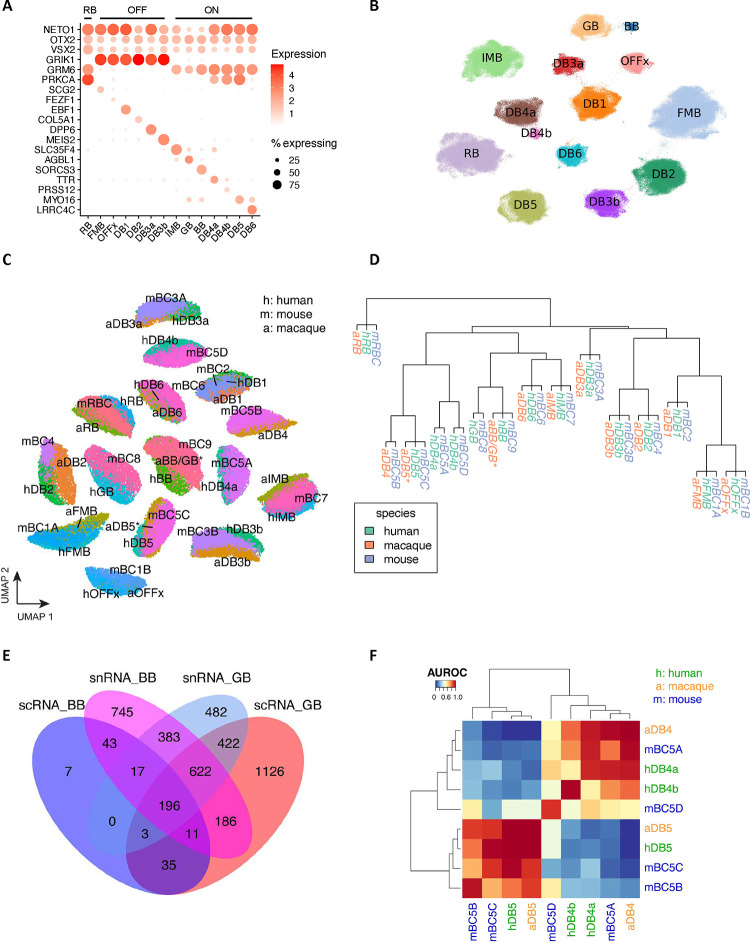
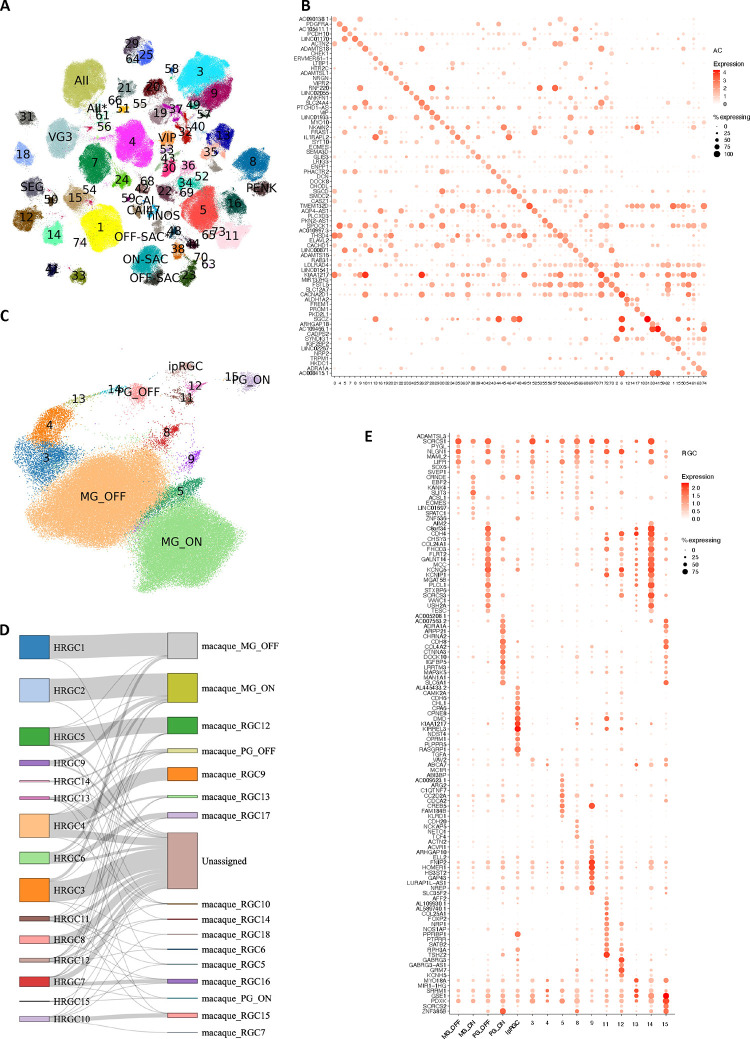
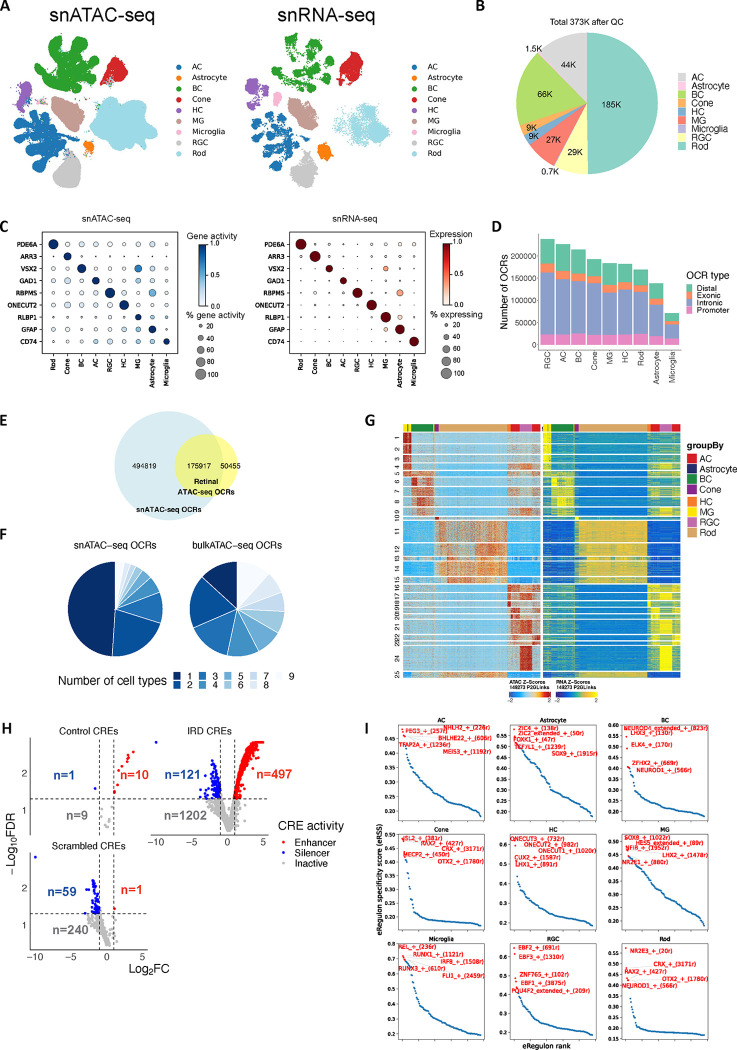
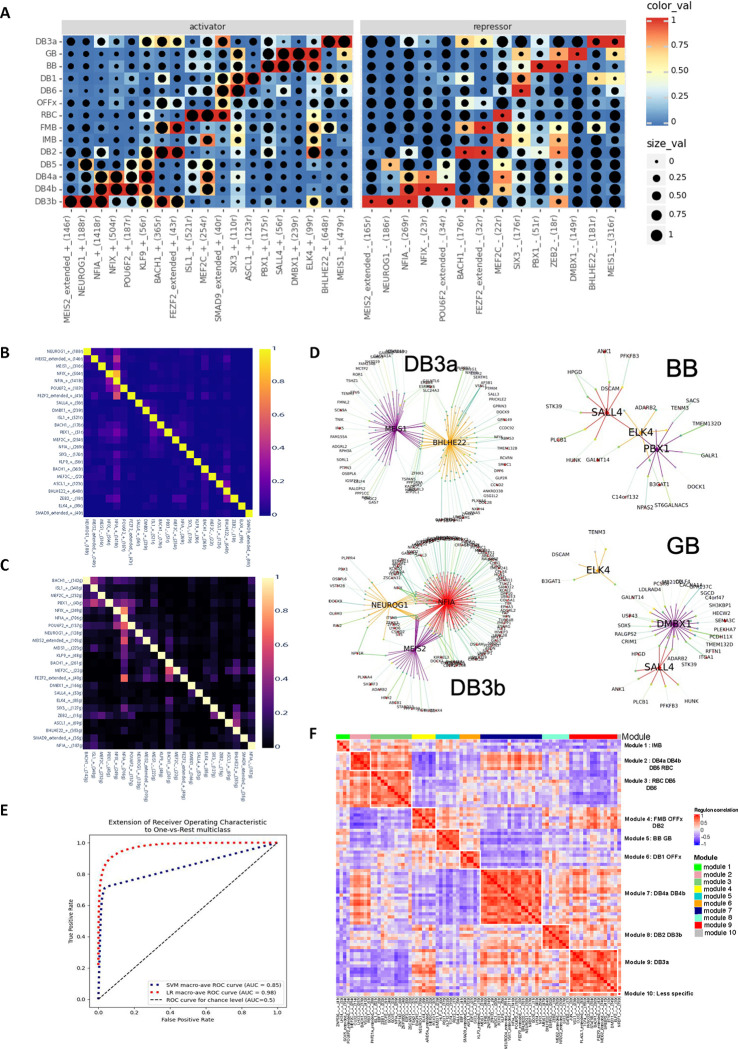
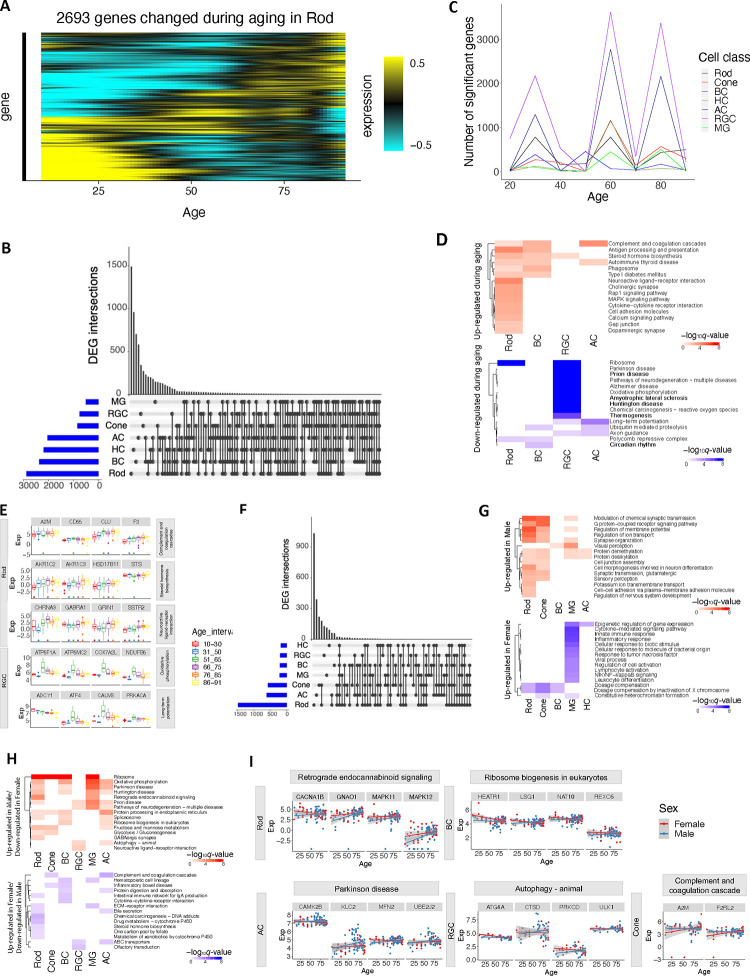
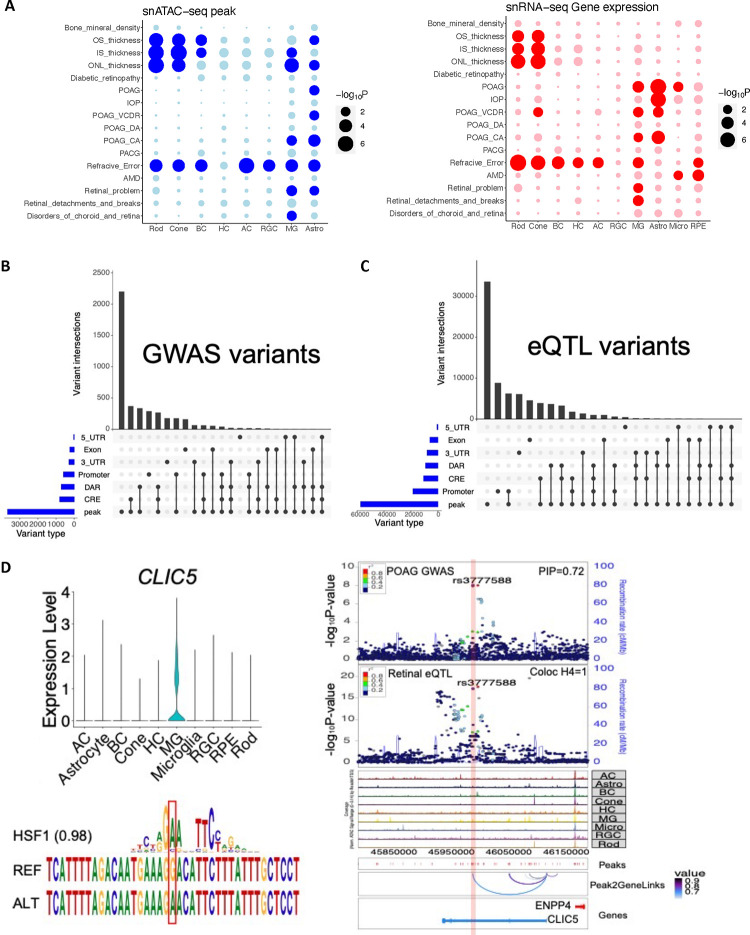
Single-cell sequencing has revolutionized the scale and resolution of molecular profiling of tissues and organs. Here, we present an integrated multimodal reference atlas of the most accessible portion of the mammalian central nervous system, the retina. We compiled around 2.4 million cells from 55 donors, including 1.4 million unpublished data points, to create a comprehensive human retina cell atlas (HRCA) of transcriptome and chromatin accessibility, unveiling over 110 types. Engaging the retina community, we annotated each cluster, refined the Cell Ontology for the retina, identified distinct marker genes, and characterized cis-regulatory elements and gene regulatory networks (GRNs) for these cell types. Our analysis uncovered intriguing differences in transcriptome, chromatin, and GRNs across cell types. In addition, we modeled changes in gene expression and chromatin openness across gender and age. This integrated atlas also enabled the fine-mapping of GWAS and eQTL variants. Accessible through interactive browsers, this multimodal cross-donor and cross-lab HRCA, can facilitate a better understanding of retinal function and pathology.


Conflict of interest statement

Competing interests F.J.T. consults for Immunai Inc., CytoReason Ltd, Cellarity Inc and Omniscope Ltd, and owns interests in Dermagnostix GmbH and Cellarity Inc. Other authors declare no competing interests.

Figures

Extended Data Figure 1.
Extended Data Figure 1.. Overview of the HRCA.
A. Cell proportion distribution of major classes among donors. The x-axis corresponds to each donor, and the y-axis is the cell proportion of major classes. The last bar is the cell proportion across total cells. B. A pie chart illustrating the number of cells for major classes and their proportions. C. Integration of datasets from snRNA-seq and scRNA-seq datasets. The cells are colored by major classes. D. The atlas is colored by the two technologies: snRNA-seq (in coral) and scRNA-seq (in blue). E. The distribution of transcriptomic data for 152 samples obtained from snRNA-seq and scRNA-seq technologies. Each sample is colored by the technology used. F. The atlas of scRNA-seq data, with major classes represented using different colors. G. Dot plots illustrating the distribution of expression levels of marker genes for major cell classes in snRNA-seq (on the left) and scRNA-seq data (on the right).
Extended Data Figure 2.
Extended Data Figure 2.. Comparison between single-nuclei and single-cell technologies.
A. Cell proportion of major class of samples between snRNA-seq and scRNA-seq in fovea, macular, and periphery tissue regions. The red bar represents cell proportions of major classes in snRNA-seq samples, and the blue bar represents cell proportions of scRNA-seq samples. B. Enriched GO BPs of 1,387 over-expressed genes in snRNA-seq data. C. Enriched GO BPs of 3,242 over-expressed genes in scRNA-seq data. D. Shared genes over-expressed in snRNA-seq data among major cell classes. The ”Full” (in red) is genes over-expressed in snRNA-seq data regardless of cell classes. E. Shared of genes derived from scRNA-seq data.
Extended Data Figure 3.
Extended Data Figure 3.. transcriptomic signature of bipolar cells
A. UMAP visualization of BC cells based on single-cell transcriptome data. B. Dot plot of the distribution of marker gene expression by the single-cell measurements. C. Co-embedding between snRNA-seq and scRNA-seq cells. The label names are prefixed by “n” for snRNA and “c” for scRNA. D. Volcano plot of differentially expressed genes between GB and BB of the snRNA-seq datasets. Differentially expressed genes were identified under |log2 fold change|>1 and q-value<0.05. E. Predicted markers per BC cell type by the binary classification analysis using snRNA-seq datasets. Rows are BC cell types, and columns represent novel markers.
Extended Data Figure 4.
Extended Data Figure 4.. Annotation of amacrine cells.
A. Dot plot of AC cell clusters by markers to identify AC subclasses for GABAergic, Glycinergic, and Both. PAX6 and TFAP2B were used as AC pan-markers. GAD1/GAD2 were used for GABAergic ACs, and SLC6A9 was used for the Glycinergic ACs. MEIS2, TCF4, and EBF1 were also included in the dot plot. B. UMAP of AC cells, colored by the four AC groups. C. Dot plot of 14 AC cell clusters with known markers. The cell type names are indicated in parentheses next to the cluster IDs. D. UMAP visualization of AC cells, colored by the 14 clusters with cell type names. The rest of the clusters are colored as “unknown” without existing names.
Extended Data Figure 5.
Extended Data Figure 5.. Cross-mapping for human amacrine cells.
A. SATURN co-embedding visualization of AC cell types between snRNA-seq and scRNA-seq. AC cells are colored by the two technologies. B. The same SATURN co-embedding with AC type labels color-coded on top of clusters. Labels are prefixed with “n” for snRNA-seq datasets and “c” for scRNA-seq data. C. SATURN co-embedding visualization of AC types across human, macaque and mouse species. AC cell labels for the three species are overlaid on clusters. Labels are prefixed with “h” for human, “a” for macaque, and “m” for mouse.
Extended Data Figure 6.
Extended Data Figure 6.. Annotation of retinal ganglion cells.
A. Dot plot of RGC cell clusters with existing markers. B. The proportion of parasol RGCs within the RGC population in the samples. Samples enriched by NeuN experiments are highlighted in green. C. Sankey diagram depicting the relationship between RGC clusters from snRNA-seq datasets and the public labeling of RGC types from scRNA-seq datasets. The width of the lines is proportional to the number of cells in the mapping. D. Sankey diagram illustrating RGC types alignment between humans (left column) and mice (right column).
Extended Data Figure 7.
Extended Data Figure 7.. A high resolution snATAC-seq cell atlas of the human retina
A. Scatter plot showing the correlation between gene expression derived from snRNA-seq (X axis) and gene activity score derived from snATAC-seq (Y axis) from major retinal cell classes. B. Heatmap showing the chromatin accessibility of differential accessible regions (DARs) identified in major retinal cell classes. Rows represented chromatin regions specific to certain major classes, and columns corresponded to major classes. C. Genome track of the RHO locus showing the cell type specific chromatin accessibility in the promoter and linked cis-regulatory elements of this gene. D. Density plot showing the activity (log2FC value of comparison between activity of each tested sequence and the activity of a basal CRX promoter) distribution of the tested sequences by MPRAs. IRD CREs n=1,820 (green), control CREs with a variety of activities n=20 (red), Scrambled CREs n=300 (blue).
Extended Data Figure 8.
Extended Data Figure 8.. Multi-omics atlas of the human retinal subclass cell types
A. UMAP showing the co-embedding of bipolar cells (BC) from snRNA-seq and snATAC-seq were clustered into BC cell types. B. Dot plot showing marker gene expression measured by snRNA-seq and marker gene activity score derived from snATAC-seq are specific in the corresponding BC cell types. C. Genome track of SORCS3 showing the promoter of SORCS3 is specifically open in BB. D. Genome track of UTRN showing the local chromatin of UTRN is specifically open in GB. E. UMAP showing the co-embedding of amacrine cells (AC) from snRNA-seq and snATAC-seq were clustered into AC cell types. F. Dot plot showing marker gene expression measured by snRNA-seq and marker gene activity score derived from snATAC-seq are specific in the corresponding sub classes of AC types. G. UMAP showing the co-embedding of cone cells (Cone) from snRNA-seq and snATAC-seq were clustered in Cone cell types. H. Dot plot showing marker gene expression measured by snRNA-seq and marker gene activity score derived from snATAC-seq are specific in the corresponding Cone cell types.
Extended Data Figure 9.
Extended Data Figure 9.. Regulon of the human retinal subclass cell types
A. Dot plot showing the distribution of regulon specificity score of regulons identified in ML- and S-Cone. B. Dot plot showing the distribution of regulon specificity score of regulons identified in OFF- and ON-BC (ON-BC include ON-Cone BC and Rod BC). C. Dot plot showing the distribution of regulon specificity score of regulons identified in GABAergic-, Glycinergic- and Both-AC. D. Dot plot showing the distribution of regulon specificity score of regulons identified in HC0 and HC1. E. Dot plot showing the distribution of regulon specificity score of regulons identified in 14 BC cell types. F. Boxplot showing the average AUC values of the regulon modules identified in BC cell types. The BC cell types with the highest AUC values were labeled in the title of each regulon module.
Extended Data Figure 10.
Extended Data Figure 10.. Differential gene expression during aging and associated with sex.
A. Age and sex distribution of the analyzed samples. B. Heatmap showing gene expression level of differentially expressed genes (DEGs) during aging in major retinal cell classes identified with linear mixed effect model (LMM). C. UpSet plot showing the overlap of DEGs identified by LMM and sliding-window analysis at the age of 30, 60 and 80 in Rod. UpSet plot showing the number of DEGs across major retinal cell classes at the age of 30, 60 and 80, respectively. D. The GO terms significantly enriched (FDR <0.1) of DEGs during aging identified by LMM across retinal cell classes. E. The examples of DEGs between male and female associated with the enriched GO terms.
Figure 1.
Figure 1.. Overview of single cell atlas of the human retina
A. The integrated study for the atlas involves compiling public datasets and in-house generated data, integrating datasets, annotating cell clusters, utilizing chromatin profiles for multi-omics, and demonstrating the utility by applications. B. Collected retinal datasets comprising of both in-house newly generated and seven publicly available datasets. C. Five data integration algorithms are benchmarked for data harmonization. The algorithms are evaluated using 14 metrics, with the rows representing the algorithms and columns corresponding to the metrics. The algorithms are ranked based on their overall score. D. The atlas of snRNA-seq datasets is visualized in a UMAP plot at a major class resolution, with cells colored based on their major classes. E. Cell type similarities of major classes between snRNA-seq (in coral) and scRNA-seq (in blue). The color key is the average AUROC of self-projection for cell types. F. Volcano plot of genes over-expressed in snRNA-seq datasets (on the right) and scRNA-seq (on the left). The x-axis is log2 fold change, and the y-axis is −log10 q-value. Differentially expressed genes were identified under |log2 fold change|>1 and q-value<0.05 and are depicted as red dots. Selected gene symbols point to the DEGs, including seven genes encoding protocadherin proteins on the right: PCDHGB2, PCDHGB3, PCDHGB4, PCDHGA2, PCDHA2, PCDHGA11, PCDHA8; and five genes encoding ribosomal proteins on the left: RPL7, RPL13A, RPS8, RPS15, RPS17.
Figure 2.
Figure 2.. Bipolar cells
A. Distribution of marker genes for BC types. BC subclasses are in RB, OFF and ON. NETO1, OTX2, and VSX2 were used as BC pan-markers. GRIK1 and GRM6 were used as OFF and ON markers, respectively. Rows represent marker genes, and columns represent BC types. The names of BC types are extracted from macaque BC types. B. UMAP visualization of human BC cells. Cell clusters are colored by the annotated cell types. C. Co-embedding of human, mouse, and macaque BC cells. To differentiate between cell types from three species, prefixes were added to the names: “h” for human, “m” for mouse, and “a” for macaque. D. Hierarchical clustering of mouse BC cell types. Expanded leaf nodes are the correspondent cell types from human and macaque BC cell types. E. The overlap between the top-ranked genes of human GB and BB is examined using snRNA-seq and scRNA-seq datasets. Fisher’s exact test was used to calculate the significance of the overlap of top ranked genes in GB (p-value=7.5×10−293) and BB (p-value=1.7×10−131) between snRNA-seq and scRNA-seq. F. Cell type similarities among mouse BC5A, BC5B, BC5C, and BC5D, and mapped types in humans and macaques.
Figure 3.
Figure 3.. Amacrine cells and retinal ganglion cells
A. UMAP visualization of the identified 73 AC cell clusters. Cluster IDs are placed on top of clusters, and cells are colored by the cluster IDs, where 14 clusters have annotated types. B. Dot plot of predicted markers for AC cell types. C. UMAP visualization of RGC cell types with labels on top of cells. D. Sankey diagram illustrating RGC types alignment between humans (left column) and macaques (right column). E. Dot plot of predicted markers for RGC cell types.
Figure 4.
Figure 4.. A high resolution snATAC-seq cell atlas of the human retina
A. Uniform Manifold Approximation and Projection (UMAP) of co-embedded cells from snRNA-seq and snATAC-seq showing cells are clustered into major retinal cell classes. B. Pie chart showing the cell proportion distribution of major retinal cell classes in this study. C. Dot plot showing marker gene expression measured by snRNA-seq and marker gene activity score derived from snATAC-seq are specific in the corresponding cell class. D. Bar plot showing the number of open chromatin regions (OCRs) identified in each major cell class. E. The Venn Diagram showing the overlapped OCRs detected by retinal snATAC-seq and bulk ATAC-seq. F. Pie chart showing cell type specificity of OCRs identified from retinal snATAC-seq (left) and bulk ATAC-seq (right). The color codes the number of cell types where the OCRs were observed. G. Heatmap showing chromatin accessibility (left) and gene expression (right) of 149,273 significantly linked CRE-gene pairs identified by the correlation between gene expression and OCR accessibility. Rows represented CRE-gene pairs grouped in clusters by correlations. H. Volcano plot showing the log2FC value (comparison between activity of each tested sequence and the activity of a basal CRX promoter, X axis) and the −log10FDR value (Y axis) of each tested sequence by MPRAs (IRD CREs n=1,820, control CREs with a variety of activities n=20, Scrambled CREs n=300). Each dot corresponds to a tested sequence, colored by the activity of the sequence. I. Scatter plot showing the eRegulon specificity score for each transcription factor (TF) and the corresponding regulon across major retinal cell classes. The top five TF and eRegulon are highlighted in red.
Figure 5.
Figure 5.. Regulon of the human bipolar cell types
A. Heatmap showing the identified regulons where the gene expression level (color scale) of transcription factors and the enrichment (dot size) of TF motifs in the snATAC peaks are highly correlated. The rows represent BC cell types, and the columns represent the identified regulons. B. Jaccard heatmap showing the intersection of target regions of the identified TFs. Each cell in the heatmap represents the Jaccard index of target regions between a pair of TFs. C. Jaccard heatmap showing the intersection of target genes of the identified TFs. Each cell in the heatmap represents the Jaccard index of target genes between a pair of TFs. D. Network plot showing the regulons and interactions between them in DB3a, DB3b, BB and GB. Each regulon includes the TF, target regions and target genes. E. ROC-AUC of logistic regression model and SVM model to predict BC cell type based on the accessibility of target regions of identified TFs. F. Heatmap showing the correlation in target-regions-based AUC of the identified regulons.
Figure 6.
Figure 6.. Differential gene expression associated with sex and age.
A. Heatmap showing gene expression level of differentially expressed genes (DEGs) during aging in Rod identified with linear mixed effect model (LMM). B. UpSet plot showing the number of cell type specific and common DEGs across major retinal cell classes. C. The number of DEGs identified through sliding window analysis at each age stage. D. The selected KEGG pathways significantly enriched (FDR <0.1) of DEGs during aging identified by LMM across retinal cell classes. E. The examples of DEG during aging involved in the enriched KEGG pathways. F. The number of DEGs between male and female across major retinal cell classes. G. The selected GO terms significantly enriched (FDR < 0.1) of DEGs between male and female across retinal cell classes. H. The selected KEGG pathways significantly enriched (FDR < 0.1) of DEGs with gender dependent aging effect. I. The examples of DEGs with gender dependent aging effect involved in the enriched KEGG pathways.
Figure 7.
Figure 7.. Leveraging multi-omics data to study GWAS and eQTL loci
A. Cell class enrichment of GWAS loci based on chromatin accessibility with LDSC (left) and gene expression with MAGMA (right). Rows represent enriched GWAS traits, and columns represent retinal cell classes. The highlight dot indicates the enrichment q-value < 0.05. B. Categorization of fine-mapped GWAS variants located in various genomic regions. Categories include peak (i.e., open chromatin regions), linked cis-regulatory elements (CREs), differentially accessible regions (DARs), promoter, exon, 5_UTR and 3_UTR of gene annotation. C. Categorization of fine-mapped eQTL variants located in various genomic regions. D. Visualization of fine-mapped loci in CLIC5 region.

References

    1. Regev A. et al. The Human Cell Atlas. Elife 6 (2017). 10.7554/eLife.27041 - DOI - PMC - PubMed
    1. Rozenblatt-Rosen O., Stubbington M. J. T., Regev A. & Teichmann S. A. The Human Cell Atlas: from vision to reality. Nature 550, 451–453 (2017). 10.1038/550451a - DOI - PubMed
    1. Sikkema L. et al. An integrated cell atlas of the lung in health and disease. Nat Med 29, 1563–1577 (2023). 10.1038/s41591-023-02327-2 - DOI - PMC - PubMed
    1. Kumar T. et al. A spatially resolved single-cell genomic atlas of the adult human breast. Nature 620, 181–191 (2023). 10.1038/s41586-023-06252-9 - DOI - PMC - PubMed
    1. van Zyl T. et al. Cell atlas of the human ocular anterior segment: Tissue-specific and shared cell types. Proc Natl Acad Sci U S A 119, e2200914119 (2022). 10.1073/pnas.2200914119 - DOI - PMC - PubMed

Publication types