[Preprint]. 2023 Nov 16:2023.11.15.567273.
doi: 10.1101/2023.11.15.567273.

Single phage proteins sequester TIR- and cGAS-generated signaling molecules

Affiliations

Single phage proteins sequester TIR- and cGAS-generated signaling molecules

Dong Li et al. bioRxiv. .

Update in

Abstract

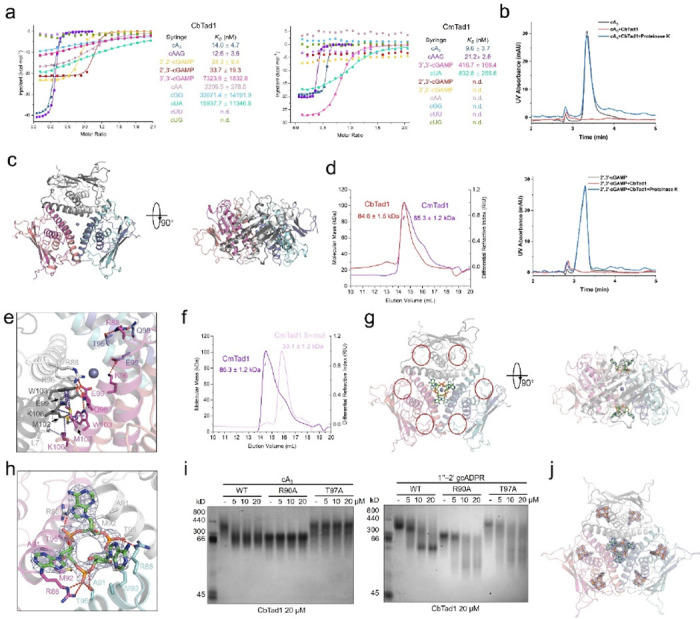
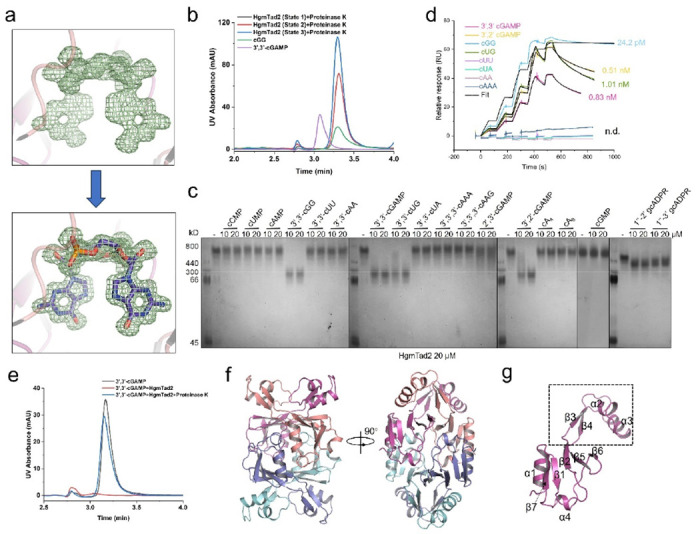
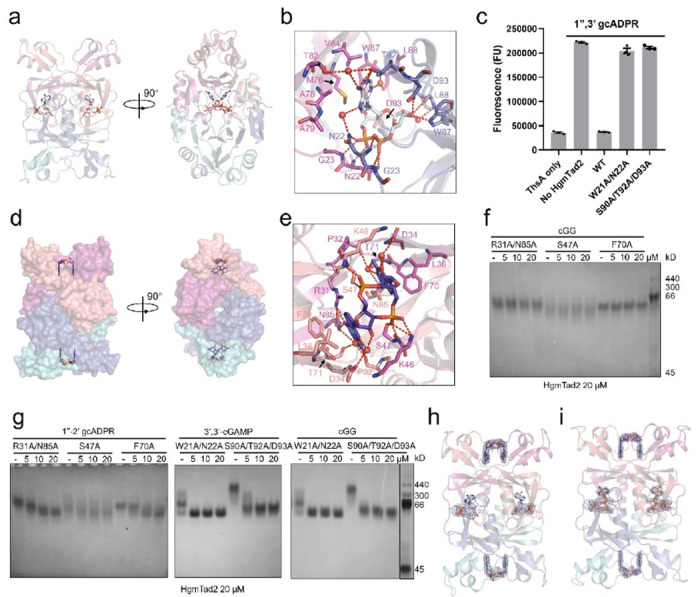
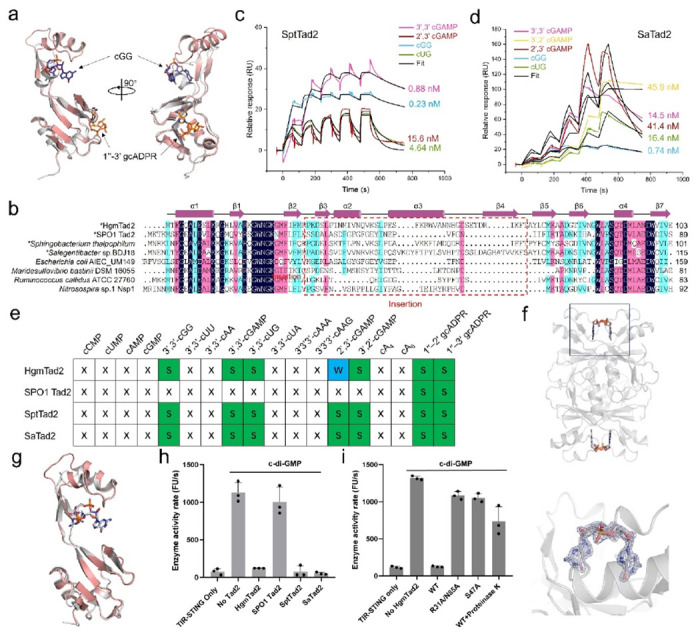
Prokaryotic anti-phage immune systems use TIR (toll/interleukin-1 receptor) and cGAS (cyclic GMP-AMP synthase) enzymes to produce 1"-3'/1"-2' glycocyclic ADPR (gcADPR) and cyclid di-/trinucleotides (CDNs and CTNs) signaling molecules that limit phage replication, respectively 1-3. However, how phages neutralize these common systems is largely unknown. Here, we show that Thoeris anti-defense proteins Tad1 4 and Tad2 5 both have anti-CBASS activity by simultaneously sequestering CBASS cyclic oligonucleotides. Strikingly, apart from binding Thoeris signals 1"-3' and 1"-2' gcADPR, Tad1 also binds numerous CBASS CDNs/CTNs with high affinity, inhibiting CBASS systems using these molecules in vivo and in vitro. The hexameric Tad1 has six binding sites for CDNs or gcADPR, which are independent from two high affinity binding sites for CTNs. Tad2 also sequesters various CDNs in addition to gcADPR molecules, inhibiting CBASS systems using these CDNs. However, the binding pockets for CDNs and gcADPR are different in Tad2, whereby a tetramer can bind two CDNs and two gcADPR molecules simultaneously. Taken together, Tad1 and Tad2 are both two-pronged inhibitors that, alongside anti-CBASS protein 2, establish a paradigm of phage proteins that flexibly sequester a remarkable breadth of cyclic nucleotides involved in TIR- and cGAS-based anti-phage immunity.


Conflict of interest statement

J.B.-D. is a scientific advisory board member of SNIPR Biome and Excision Biotherapeutics, a consultant to LeapFrog Bio and BiomX, and a scientific advisory board member and co-founder of Acrigen Biosciences. The Bondy-Denomy lab received research support from Felix Biotechnology.

Figures

Figure 1.
Figure 1.. Tad1 is a hexamer to bind to two molecules of cyclic trinucleotides.
a, ITC assays to test binding of cyclic oligonucleotides to CbTad1 and CmTad1. Representative binding curves and binding affinities are shown. The KD values are mean ± s.d. (n=3). Raw data for these curves are shown in Extended Data Figure 2. b, The ability of CbTad1 to bind and release cA3 and 2’,3’-cGAMP when treated with proteinase K was analyzed by HPLC. cA3 and 2’,3’-cGAMP standard was used as controls. The remaining nucleotides after incubation with CbTad1 were tested. c, Overall structure of CmTad1 hexamer. The Zn ion is shown as a sphere. Three views are shown. d, Static light scattering (SLS) studies of purified CbTad1 and CmTad1. Calculated molecular weight is shown above the peaks. e, Detailed binding in the hexamer interface of CmTad1. Residues involved in hexamer formation are shown as sticks. Red dashed lines represent polar interactions. f, SLS studies of purified CmTad1 and its Q98A/E99A/M102A/W103A/K106A mutant. Calculated molecular weight is shown above the peaks. 5× mut represents the above mutant with 5 residues mutated. g, Overall structure of CmTad1 hexamer bound to cA3.Two views are shown. h, Detailed binding between CmTad1 and cA3. Residues involved in cA3 binding are shown as sticks. Red dashed lines represent polar interactions. 2Fo-Fc electron density of cA3 within one binding pocket is shown and contoured at 1 σ. i, Native PAGE showed the binding of CbTad1 and its mutants to cA3 and 1”-2’ gcADPR. j, Overall structure of CmTad1 hexamer bound to cA3 and 1”-3’ gcADPR. cA3 and 1”-3’ gcADPR are shown as green and orange sticks, respectively. 2Fo-Fc electron density of cA3 and 1”-3’ gcADPR within CbTad1 hexamer contoured at 1 σ.
Figure 2.
Figure 2.. Tad1 binds to 2’,3’-/3’,2’-cGAMP using the same binding pocket as gcADPR molecules.
a, Overall structure of CbTad1 hexamer bound to 2’,3’-cGAMP, which is shown as yellow sticks. b, Structural superimposition of apo, 1”-3’ gcADPR-bound and 2’,3’-cGAMP-bound CbTad1 protein. 1”-3’ gcADPR and 2’,3’-cGAMP are shown as orange and yellow sticks, respectively. The two loops that undergo conformational changes upon ligand binding are highlighted. c, Detailed binding between CbTad1 and 2’,3’-cGAMP. Residues involved in 2’,3’-cGAMP binding are shown as sticks. Red dashed lines represent polar interactions. 2Fo-Fc electron density of 2’,3’-cGAMP within one binding pocket is shown and contoured at 1 σ. d, Native PAGE showed the binding of CbTad1 and its mutants to 2’,3’-cGAMP. e, Overall structure of CmTad1 hexamer complexed with cA3 and 2’,3’-cGAMP. cA3 and 2’,3’-cGAMP are shown as green and yellow sticks, respectively. Two views are shown. 2Fo-Fc electron density of cA3 and 2’,3’-cGAMP within CbTad1 hexamer contoured at 1 σ.
Figure 3.
Figure 3.. Tad1 antagonizes Type II-A and Type III-C CBASS immunity.
a, ITC assays to test binding of cyclic oligonucleotides to SBS Tad1 and ColiTad1. Representative binding curves and binding affinities are shown. The KD values are mean ± s.d. (n=3). Raw data for these curves are shown in Extended Data Figure 2. b, Summary of the binding results of Tad1 homologs. Words in black: verified only by native PAGE. X: no binding; W: binding KD higher than 400 nM. S: shift in native gel or binding KD lower than 400 nM by ITC or SPR. c, CapV enzyme activity in the presence of 3’,3’-cGAMP and resorufin butyrate, which is a phospholipase substrate that emits fluorescence when hydrolyzed. The enzyme activity rate was measured by the accumulation rate of fluorescence units (FUs) per second. To test the effects of Tad1 homologs to sequester 3’,3’-cGAMP, Tad1 or its mutants (8 μM) was incubated with 3’,3’-cGAMP (0.8 μM) for 30 min. Filtered nucleotide products were used for the CapV activity assay. Data are mean ± SD (n=3). d, CapV enzyme activity with Tad1 homologs. The experiment was performed as in c. e, Plaque assays to test the activity of Tad1 against Thoeris and Type II-A CBASS immunity in vivo. Organization of P. aeruginosa Pa231 Thoeris and P. aeruginosa Pa011 CBASS II-A operons shown. F10 phage was spotted in 10-fold serial dilutions on a lawn of P. aeruginosa cells expressing Thoeris operon genes (PAO1:Tn7 Thoeris SIR2), or without Thoeris (PAO1:Tn7 empty). PaMx41Δacb2 was spotted on a lawn of Pa011 cells with deletion of CBASS operon (Pa011ΔCBASS II-A) or Pa011 wild type cells (Pa011 wt), electroporated with pHERD30T plasmids carrying Tad1 genes or empty vector. f, Effect of CbTad1 or its mutants on cA3-activated NucC effector protein function. After treatment with proteinase K, the released cA3 also showed the ability to activate the nuclease activity of NucC. The concentration of NucC, cA3, CbTad1 and proteinase K is 10 nM, 5 nM, 200 nM and 1 μM, respectively. N denotes nicked plasmid, SC denotes closed-circular supercoiled plasmid, and cut denotes fully digested DNA. g, Plaque assays to test the activity of Tad1 against Type III-C CBASS immunity in vivo. Organization of P. aeruginosa Pa278 Type III-C CBASS operon shown. JBD67Δacb2 phage was spotted in 10-fold serial dilutions on a lawn of P. aeruginosa cells expressing Pa278 CBASS operon genes (PAO1:Tn7 CBASS III-C), or without the system (PAO1:Tn7 empty), electroporated with pHERD30T plasmids carrying Tad1 genes or empty vector.
Figure 4.
Figure 4.. Tad2 binds an array of cyclic dinucleotides.
a, The Fo-Fc density around the putative cGG in the structure of HgmTad2 of State 3 contoured at 2.5 σ. The density itself and with cGG placed are shown in the upper and lower panels, respectively. b, The molecules in HgmTad2 of three states released when treated with proteinase K was analyzed by HPLC. 3’,3’-cGAMP and cGG standard was used as controls. c, Native PAGE showed the binding of HgmTad2 of State 1 to cyclic oligonucleotides and gcADPR molecules. d, Overlay of sensorgrams from surface plasmon resonance (SPR) experiments, used to determine kinetics of HgmTad2 binding to CDNs. Data were fit with a model describing one-site binding for the ligands (black lines). e, The ability of HgmTad2 of State 1 to bind and release 3’,3’-cGAMP when treated with proteinase K was analyzed by HPLC. 3’,3’-cGAMP standard was used as a control. The remaining nucleotides after incubation with HgmTad2 was tested. f, Overall structure of HgmTad2 tetramer. Two views are shown. g, Structure of a protomer of HgmTad2. Secondary structures are labelled.
Figure 5.
Figure 5.. Tad2 binds cyclic dinucleotides and gcADPR molecules simultaneously.
a, Overall structure of HgmTad2 tetramer bound to 1”-2’ gcADPR, which is shown as gray sticks. b, Detailed binding between HgmTad2 and 1”-2’ gcADPR. Residues involved in ligand binding are shown as sticks. Red dashed lines represent polar interactions. c, ThsA enzyme activity in the presence of 1”-3’ gcADPR and ε-NAD. Wild-type (WT) and mutated HgmTad2 at 40 nM were incubated with 5 nM 1”-3’ gcADPR. And then the reactions were filtered and their ability to activate ThsA NADase activity was measured. Bars represent the mean of three experiments, with individual data points shown. Data are mean ± SD (n=3). d, Overall structure of HgmTad2 tetramer bound to cGG, which is shown as purple sticks. HgmTad2 is shown as surface model. e, Detailed binding between HgmTad2 and cGG. Residues involved in ligand binding are shown as sticks. Red dashed lines represent polar interactions. f, Native PAGE showed the binding of HgmTad2 mutants to cGG. g, Native PAGE showed the binding of HgmTad2 mutants to 1”-2’ gcADPR, 3’,3’-cGAMP or cGG. h-i, Overall structure of HgmTad2 tetramer bound to cGG and 1”-2’ gcADPR simultaneously (h), or cGG and 1”-3’ gcADPR simultaneously (i), cGG, 1”-2’ gcADPR and 1”-3’ gcADPR are shown as purple, gray and orange sticks, respectively. 2Fo-Fc electron density of the ligands within HgmTad2 tetramer is contoured at 1 σ.
Figure 6.
Figure 6.. Tad2 antagonizes Type I-D CBASS immunity that uses cGG.
a, Structural superimposition between HgmTad2-cGG-1”-3’-gcADPR and SPO1 Tad2. HgmTad2 and small molecules are colored as in Fig. 6I. SPO1 Tad2 is colored gray. b, Sequence alignment among Tad2 homologs. Residues with 100 % identity, over 75 % identity and over 50 % identity are shaded in dark blue, pink and cyan, respectively. Secondary structural elements of HgmTad2 are shown above the alignment. The insertion region (residues 32-72) between β2 and β5 of HgmTad2 or between β2 and β3 of SPO1 Tad2 (residues 36-59) is marked with a rectangle. Biochemically studied Tad2 homologs are marked with an asterisk before its species name. c-d, SPR assay of SptTad2 (c) and SaTad2 (d). e, Summary of the binding results of Tad1 homologs. The figure is labelled as in Figure 3b. f, Overall structure of SptTad2 bound to cGG. A close view of the bound cGG with 2Fo-Fc electron density contoured at 1 σ is shown in the lower panel. g, Structural superimposition between HgmTad2-cGG and SptTad2-cGG. HgmTad2 and cGG are colored as in Fig. 6I. is colored gray. SptTad2 and its bound cGG are colored gray. h,i, TIR-STING NAD+ cleavage activity in the presence of cGG and nicotinamide 1,N6-ethenoadenine dinucleotide (εNAD), which emits fluorescence when cleavage. The enzyme activity rate was measured by the accumulation rate of fluorescence units (FUs) per second. To test the effects of HgmTad2 or its homologs to bind cGG, HgmTad2 or its homologs (1 μM) was incubated with cGG (50 nM) for 20 min. To test the effects of HgmTad2 or its mutants to bind and release cGG, HgmTad2 or its mutants (200 nM) was incubated with cGG (50 nM) for 20 min and then proteinase K (28.3 μg/mL) was added to release the nucleotide from the HgmTad2 protein, Filtered nucleotide products were used for the TIR NADase activity assay. Data are mean ± SD (n=3).

Similar articles

References

    1. Manik M.K. et al. Cyclic ADP ribose isomers: Production, chemical structures, and immune signaling. Science 377, eadc8969 (2022). - PubMed
    1. Ofir G. et al. Antiviral activity of bacterial TIR domains via immune signalling molecules. Nature 600, 116–120 (2021). - PubMed
    1. Cohen D. et al. Cyclic GMP-AMP signalling protects bacteria against viral infection. Nature 574, 691–695 (2019). - PubMed
    1. Leavitt A. et al. Viruses inhibit TIR gcADPR signaling to overcome bacterial defense. Nature 611, 326–331 (2022). - PubMed
    1. Yirmiya E. et al. Phages overcome bacterial immunity via diverse anti-defense proteins. bioRxiv 10.1101/2023.05.01.538930(2023). - DOI - PubMed

Publication types