

This is a preprint.
Increased spatial coupling of integrin and collagen IV in the immunoresistant clear cell renal cell carcinoma tumor microenvironment
- PMID: 38014063
- PMCID: PMC10680839
- DOI: 10.1101/2023.11.16.567457
Increased spatial coupling of integrin and collagen IV in the immunoresistant clear cell renal cell carcinoma tumor microenvironment
Update in
-
Increased spatial coupling of integrin and collagen IV in the immunoresistant clear-cell renal-cell carcinoma tumor microenvironment.Genome Biol. 2024 Dec 5;25(1):308. doi: 10.1186/s13059-024-03435-z. Genome Biol. 2024. PMID: 39639369 Free PMC article.
Abstract
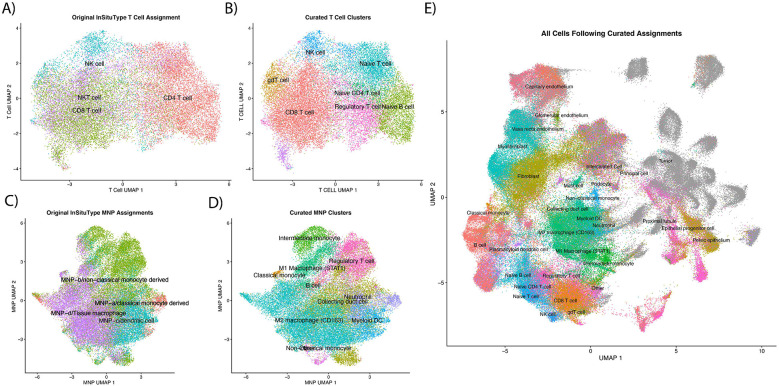
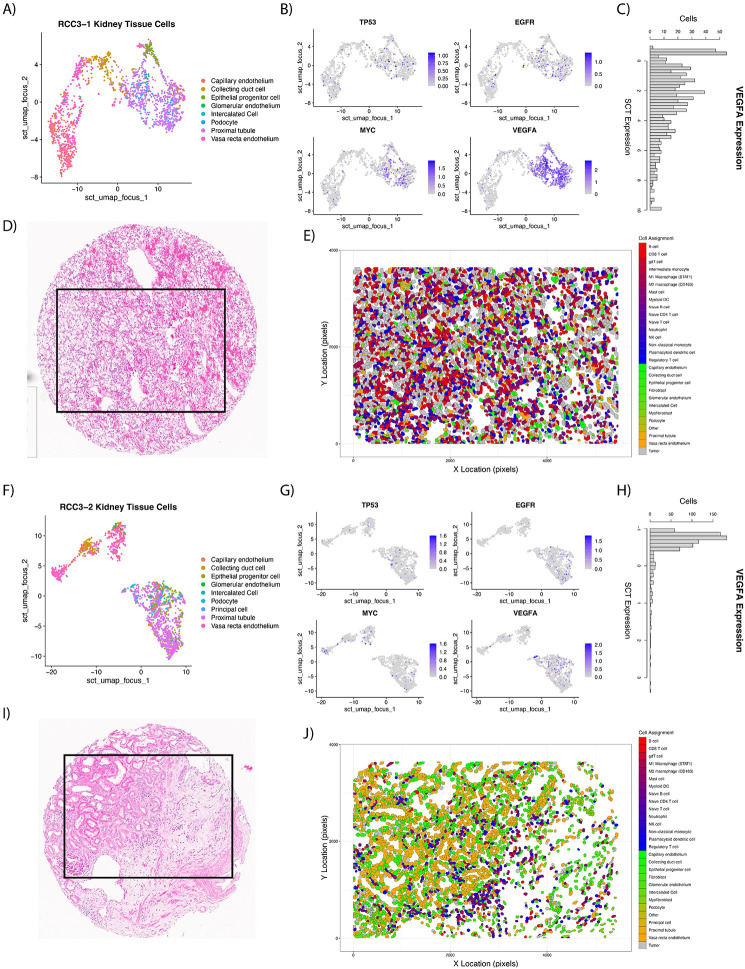
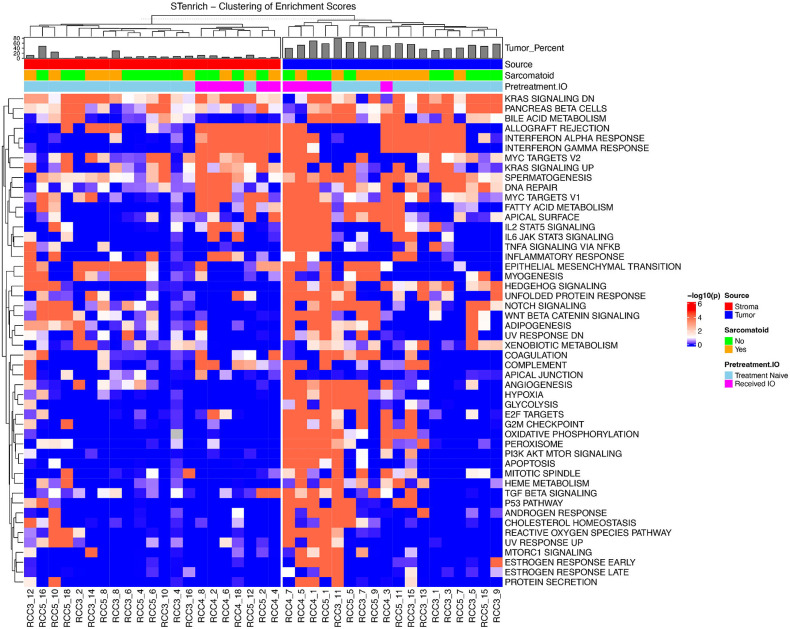
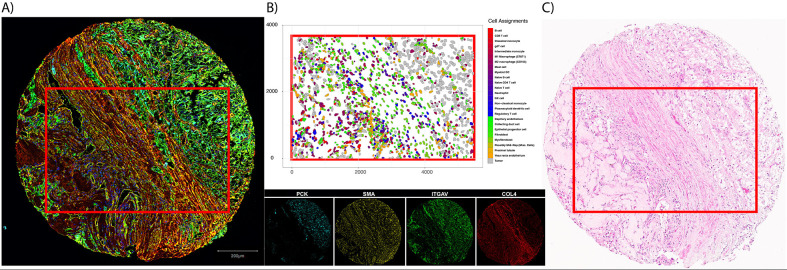
Background: Immunotherapy (IO) has improved survival for patients with advanced clear cell renal cell carcinoma (ccRCC), but resistance to therapy develops in most patients. We use cellular-resolution spatial transcriptomics in patients with IO naïve and IO exposed primary ccRCC tumors to better understand IO resistance. Spatial molecular imaging (SMI) was obtained for tumor and adjacent stroma samples. Spatial gene set enrichment analysis (GSEA) and autocorrelation (coupling with high expression) of ligand-receptor transcript pairs were assessed. Multiplex immunofluorescence (mIF) validation was used for significant autocorrelative findings and the cancer genome atlas (TCGA) and the clinical proteomic tumor analysis consortium (CPTAC) databases were queried to assess bulk RNA expression and proteomic correlates.
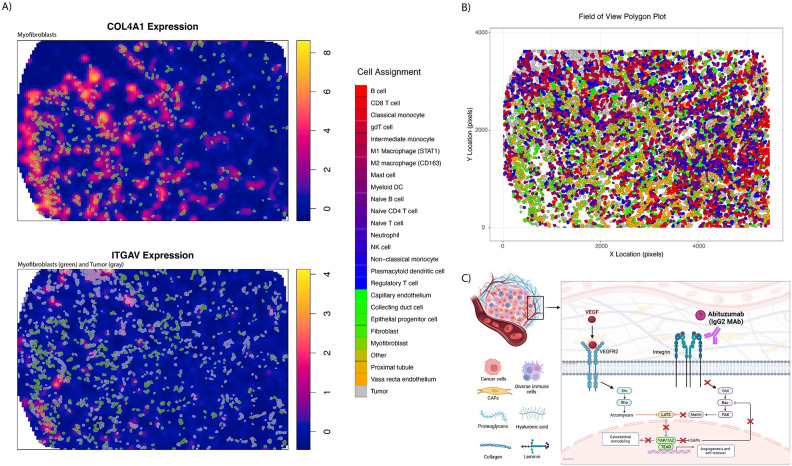
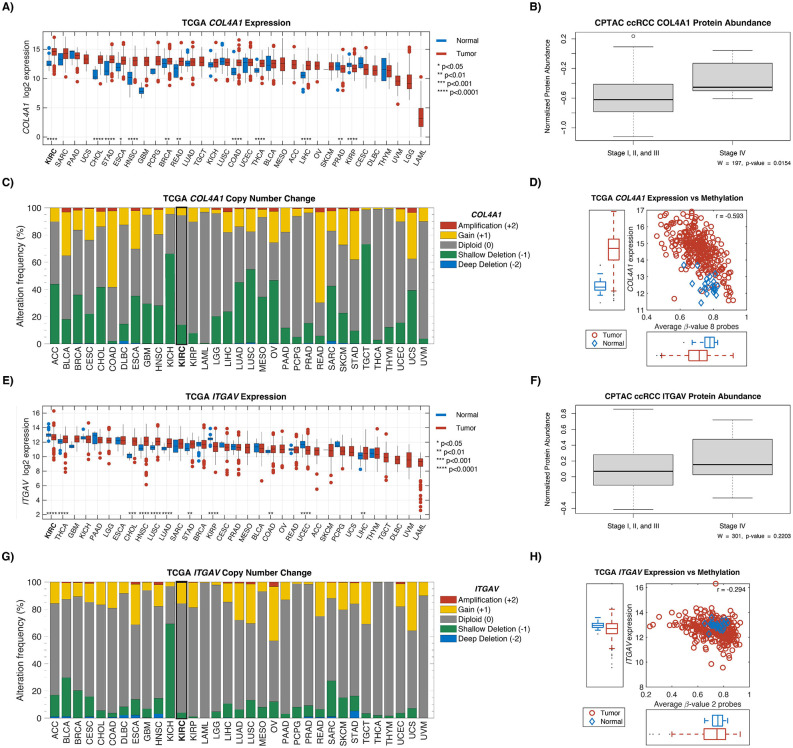
Results: 21 patient samples underwent SMI. Viable tumors following IO harbored more stromal CD8+ T cells and neutrophils than IO naïve tumors. YES1 was significantly upregulated in IO exposed tumor cells. The epithelial-mesenchymal transition pathway was enriched on spatial GSEA and the associated transcript pair COL4A1-ITGAV had significantly higher autocorrelation in the stroma. Fibroblasts, tumor cells, and endothelium had the relative highest expression. More integrin αV+ cells were seen in IO exposed stroma on mIF validation. Compared to other cancers in TCGA, ccRCC tumors have the highest expression of both COL4A1 and ITGAV. In CPTAC, collagen IV protein was more abundant in advanced stages of disease.
Conclusions: On spatial transcriptomics, COL4A1 and ITGAV were more autocorrelated in IO-exposed stroma compared to IO-naïve tumors, with high expression amongst fibroblasts, tumor cells, and endothelium. Integrin represents a potential therapeutic target in IO treated ccRCC.
Keywords: Single-cell RNA; immunotherapy resistance; ligand receptor; malignant cell typing; spatial transcriptomics.
Conflict of interest statement
Competing interests: The corresponding author certifies that all conflicts of interest, including specific financial interests and relationships and affiliations relevant to the subject matter or materials discussed in the manuscript (ie. employment/affiliation, grants or funding, consultancies, honoraria, stock ownership or options, expert testimony, royalties, or patents filed, received, or pending), are the following: ACS, MTH, TCP, OEO, NHC, AEB, PAS, JN, CMS, NLF, PMRE, KYT, JAB, YCP, JD, LAM, WEG, and BLF have no relevant disclosures; BJM is an NCCN Kidney Cancer Panel Member and an advisor for Merck; RL received research support from Predicine, Veracyte, CG Oncology, Valar Labs, and Merck, is on the clinical trials committee for CG Oncology, is scientific advisor for Bristol Myers Squibb, Merck, Fergene, Arquer Diagnostics, Urogen Pharma, Lucence, CG Oncology, and Janssen, and has received honoraria from SAI MedPartners, Solstice Health Communications, Putnam Associates, and UroToday; JJM is Associate Center Director at Moffitt Cancer Center, has ownership interest in Aleta Biotherapeutics, CG Oncology, Turnstone Biologics, Ankyra Therapeutics, and AffyImmune Therapeutics, and is a paid consultant/paid advisory board member for ONCoPEP, CG Oncology, Turnstone Biologics, Vault Pharma, Ankyra Therapeutics, AffyImmune Therapeutics, UbiVac, Vycellix, and Aleta Biotherapeutics; NS, SK, and MG are or formerly were employees of Nanostring.
Figures
References
-
- Motzer R.J., Tannir N.M., McDermott D.F., Arén Frontera O., Melichar B., Choueiri T.K., Plimack E.R., Barthélémy P., Porta C., George S., et al., Nivolumab plus Ipilimumab versus Sunitinib in Advanced Renal-Cell Carcinoma. N Engl J Med, 2018. 378(14): p. 1277–1290. 10.1056/NEJMoa1712126 - DOI - PMC - PubMed
-
- Albiges L., Tannir N.M., Burotto M., McDermott D., Plimack E.R., Barthélémy P., Porta C., Powles T., Donskov F., George S., et al., Nivolumab plus ipilimumab versus sunitinib for first-line treatment of advanced renal cell carcinoma: extended 4-year follow-up of the phase III CheckMate 214 trial. ESMO Open, 2020. 5(6): p. e001079. 10.1136/esmoopen-2020-001079 - DOI - PMC - PubMed
-
- Tannir N.M., Signoretti S., Choueiri T.K., McDermott D.F., Motzer R.J., Flaifel A., Pignon J.C., Ficial M., Frontera O.A., George S., et al., Efficacy and Safety of Nivolumab Plus Ipilimumab versus Sunitinib in First-line Treatment of Patients with Advanced Sarcomatoid Renal Cell Carcinoma. Clin Cancer Res, 2021. 27(1): p. 78–86. 10.1158/1078-0432.Ccr-20-2063 - DOI - PMC - PubMed
-
- Miao D., Margolis C.A., Gao W., Voss M.H., Li W., Martini D.J., Norton C., Bossé D., Wankowicz S.M., Cullen D., et al., Genomic correlates of response to immune checkpoint therapies in clear cell renal cell carcinoma. Science, 2018. 359(6377): p. 801–806. 10.1126/science.aan5951 - DOI - PMC - PubMed
Publication types
Grants and funding
LinkOut - more resources
Full Text Sources
Research Materials
Miscellaneous