[Preprint]. 2023 Nov 17:2023.11.17.567611.
doi: 10.1101/2023.11.17.567611.

A nuclear architecture screen in Drosophila identifies Stonewall as a link between chromatin position at the nuclear periphery and germline stem cell fate

Affiliations

A nuclear architecture screen in Drosophila identifies Stonewall as a link between chromatin position at the nuclear periphery and germline stem cell fate

Ankita Chavan et al. bioRxiv. .

Update in

Abstract

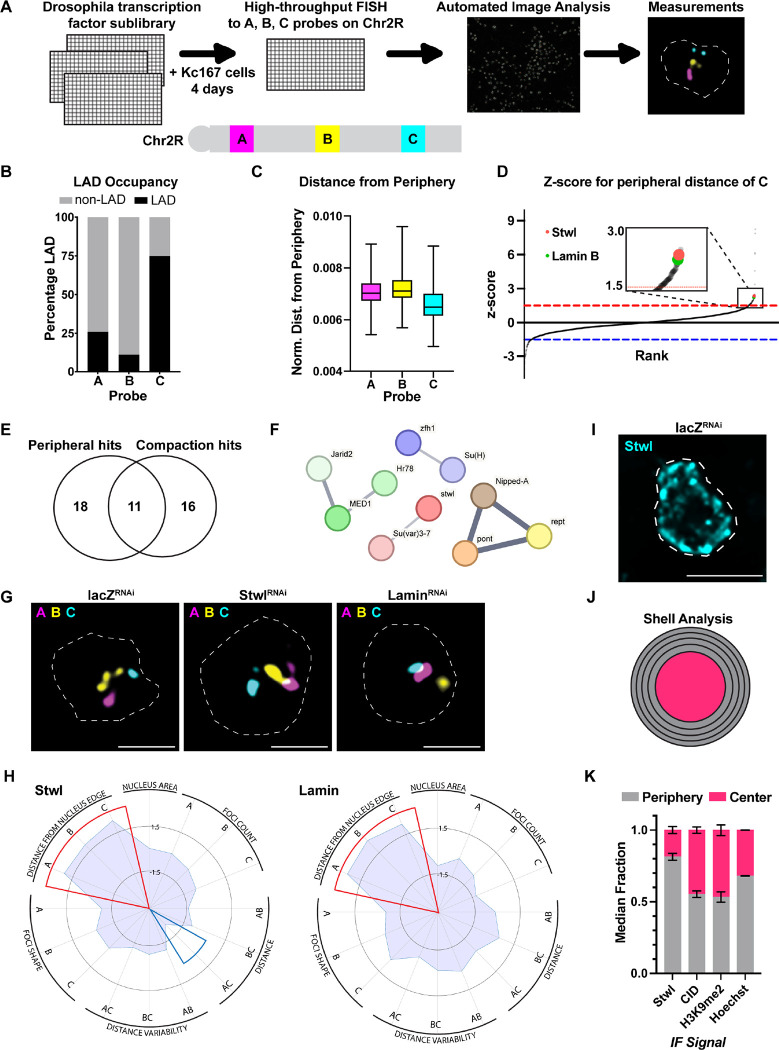
The association of genomic loci to the nuclear periphery is proposed to facilitate cell-type specific gene repression and influence cell fate decisions. However, the interplay between gene position and expression remains incompletely understood, in part because the proteins that position genomic loci at the nuclear periphery remain unidentified. Here, we used an Oligopaint-based HiDRO screen targeting ~1000 genes to discover novel regulators of nuclear architecture in Drosophila cells. We identified the heterochromatin-associated protein, Stonewall (Stwl), as a factor promoting perinuclear chromatin positioning. In female germline stem cells (GSCs), Stwl binds and positions chromatin loci, including GSC differentiation genes, at the nuclear periphery. Strikingly, Stwl-dependent perinuclear positioning is associated with transcriptional repression, highlighting a likely mechanism for Stwl's known role in GSC maintenance and ovary homeostasis. Thus, our study identifies perinuclear anchors in Drosophila and demonstrates the importance of gene repression at the nuclear periphery for cell fate.

Keywords: Genome organization; Germline stem cell; Heterochromatin; Nuclear architecture; Nuclear periphery.


Conflict of interest statement

Declaration of interests The authors declare no competing interests.

Figures

Figure 1.
Figure 1.. Discovery of novel regulators of chromatin positioning at the nuclear periphery in Drosophila.
(A)Cartoon schematic of HiDRO screening pipeline and the 1Mb probe regions along chromosome 2R. (B) Percentage of each Chr. 2R region occupied by LADs. (C) Normalized distance from periphery for each Chr. 2R region. (D) Z-score plot for genes affecting peripheral localization of Chr. 2R-C. Genes above red dashed line represent hits that increase the distance between Chr. 2R-C and the nuclear periphery. These are shown larger in the overlay box. Genes below blue dashed line represent hits that decrease the distance between Chr. 2R-C and the periphery. Lamin B and Stwl are shown in green and red, respectively. (E) Venn diagram indicating overlap between the peripheral localization and compaction hits. Eleven genes were hits for both metrics, including stwl. (F) STRING analysis of peripheral hits. (G) Individual Kc167 cell nuclei labelled with probes against Chr. 2R-A (magenta), Chr. 2R-B (yellow) and Chr. 2R-C (blue) from LacZ RNAi (control), Stwl RNAi and Lamin B RNAi. Outlines show nuclear boundary. (H) Radar plot indicating screen metrics following Stwl knockdown (left) or Lamin B knockdown (right). Red and blue wedges represent screen metrics in which the knockdown significantly increased or decreased the metric, respectively. (I) Example nucleus showing Stwl immunofluorescence. Scale bar:5μm. (J) Cartoon schematic of shell analysis of immunofluorescence. Shells 1–4 were combined to define the periphery and shell 5 defines the center. (K) Shell analysis of the indicated nuclear components. The median signal in the periphery and the center was calculated from two replicates of >300 nuclei each.
Figure 2.
Figure 2.. Stwl is a regulator of perinuclear chromatin positioning in female GSCs.
(A) Schematic of Drosophila ovary and germarium. The germarium resides at the anterior tip of the ovariole (red box) and is further sub-divided into region 1 containing germline stem cells GSCs (green) and cystoblasts, CB (purple) and regions 2a/2b containing differentiated germ cell cysts (yellow). (B) Ovaries from Control TM3 / StwlRNAi, nos > StwlRNAi and bam > StwlRNAi imaged 3 days post eclosion. Scale bar:100μm. (C) Germaria from nos > mCherryRNAi (Control) and nos > StwlRNAi ovaries stained for Vasa (green) and DAPI (magenta). Scale bar:5μm. (D) Ovaries from nos > mCherryRNAi (Control) and nos > StwlRNAi following 4d, 8d and 20d shift to 29°C in a Gal80ts background. Scale bar:100μm. (E) Germaria from nos > mCherryRNAi (Control) and nos > StwlRNAi ovaries stained for Stwl (green), Vasa (blue), and Hts (magenta) following a 4d shift to 29°C. White arrowheads indicate the GSCs. Scale bar:5μm. (F) Oligopaint FISH against Chr. 2R-A (magenta) and IF staining of Vasa (green) in GSCs from nos > mCherryRNAi (Control) and nos > StwlRNAi ovaries following a 4d shift to 29°C. Yellow arrowheads indicate the Chr 2R – A locus within the nucleus. Yellow dotted lines indicate the nuclear boundary. Scale bar:5μm. (G) Quantification of NE – Chr. 2R-A distance (μm) in GSCs from (F). n=43 GSCs from nos > mCherryRNAi and n=44 GSCs from nos > StwlRNAi. ** indicates p<0.01 from Student’s t-test. (H) Histogram of NE – Chr. 2R-A distance (μm) in GSCs from (G). (I) Oligopaint FISH against Chr. 2R-C (magenta) and IF staining of Vasa (green) in GSCs from nos > mCherryRNAi (Control) and nos > StwlRNAi ovaries following a 4d shift to 29°C. Yellow arrowheads indicate the Chr 2R-C locus within the nucleus. Yellow dotted lines indicate the nuclear boundary. Scale bar:5 μm. (J) Quantification of NE – Chr. 2R-C distance (μm) in GSCs from (I). n=45 GSCs from nos > mCherryRNAi (Control) and n=49 GSCs from nos > StwlRNAi. ns indicates p>0.05 from Student’s t-test. (K) Histogram of NE – Chr. 2R-C distance (μm) in GSCs from (J).
Figure 3.
Figure 3.. Loss of Stwl leads to defects in perinuclear chromatin organization.
(A) IF staining of Stwl (green), Lamin B (blue) and FG Nups (magenta) in GSC-like cells from bamΔ86/bam1 ovaries.Scale bar:5 μm. (B) Relative fluorescence intensity of Stwl (green, top panel), Lamin B (bottom panel, blue) and FG Nups (bottom panel, magenta) across the nucleus (white dotted line) from panel (A). Shaded grey regions highlight the overlap between the three proteins at the NE. (C) IF staining of Lamin B (green), FG Nups (magenta) and Vasa (blue) in GSCs from nos > mCherryRNAi (Control) and nos > StwlRNAi ovaries following a 4d shift to 29°C. Yellow arrowheads indicate NPC clusters in the regions lacking Lamin B. Scale bar:5μm. (D) Relative fluorescence intensity of Lamin B (green) and FG Nups (magenta) along the nuclear envelope from (C). Shaded grey regions highlight NPC clustering in regions lacking Lamin B. (E) TEM image of GSC-like cells from nos > mCherryRNAi (Control) ovaries in a bamΔ86/bam1 background following a 4d shift to 29°C. Inset (top) shows NPCs (yellow arrowheads) while inset (bottom) shows an electron-dense chromatin focus associated to the nuclear envelope. (F) TEM image of GSC-like cells from nos > StwlRNAi ovaries in a bamΔ86/bam1 background following a 4d shift to 29°C. Inset (top) shows NPC clusters while inset (bottom) shows absence of electron-dense chromatin foci in regions containing NPC clusters. (G) Quantification of perinuclear electron-dense chromatin foci in GSC-like cells from (E, F). Each dot represents the number of perinuclear chromatin foci per nucleus per micron of the nuclear envelope. n=67 GSCs from nos > mCherryRNAi and n=60 GSCs from nos > StwlRNAi. **** indicates p<0.0001 from Student’s t-test. (H) Percentage of perinuclear electron-dense chromatin foci at NPC clusters versus other regions on the nuclear envelope in GSC-like cells from (F). n=42 **** indicates p<0.0001 from Fisher’s exact test.
Figure 4.
Figure 4.. Stwl binds and represses the bgcn differentiation gene.
(A) First panels, nos; TM3 (Control) and nos > StwlEY00146 (StwlOE) ovaries in a bam1/+ background. Middle and right panels, IF staining of Bam (green), Vasa (magenta) and DAPI (blue) in germaria. Scale bar:5μm (B) Quantification of undifferentiated Bam-negative germ cells from (A). n=15 germaria from the control and n=45 germaria from StwlOE. * indicates p<0.05 from a Student’s t-test. (C) Volcano plot of −log10(p-value) vs log2FC from nos-Gal4/+ (Control) and nos > StwlEY00146 (StwlOE) GSC-enriched ovaries (bamΔ86/bam1 background). Differentially expressed genes (log2FC>|0.6| and padj<0.01 are indicated as blue dots. Genes upregulated in Stwl-depleted ovaries from Zinshteyn et al. or Kotb et al., 2023 are indicated as magenta dots while genes upregulated in both studies are indicated as yellow dots. Adjusted p values following multiple testing correction are shown. (D) Transcripts per million (log2TPM) for the indicated genes from nos-gal4/+ (Control) and nos > StwlEY00146 (StwlOE) GSC-enriched ovaries in a bamΔ86/bam background. Adjusted p values following multiple testing correction are shown. (E) Heatmaps of CUT&RUN reads for IgG from young WT ovaries and for Stwl from ovaries enriched for GSC-like cells (nos > bamRNAi). Data are centered on ±3 kb window around 12888 Stwl peaks (merged within 1kb) and is shown for two replicates each. (F) Capture of the IGV genome browser (v2.11.4) showing an approximately 10kb region on Drosophila chromosome 3 (y axis = reads per kilobase per million reads). Ensembl genes (blue). Shaded areas correspond to Stwl binding peaks.
Figure 5.
Figure 5.. Stwl positions bgcn at the nuclear periphery in female GSCs.
(A) Oligopaint FISH against the bgcn locus (magenta) and IF staining of Vasa (green) in GSCs from nos > mCherryRNAi (Control) and nos > StwlRNAi ovaries following a 6d shift to 29°C. Red arrowheads indicate the bgcn locus within the nucleus. Black dotted lines indicate the nuclear boundary. Scale bar:5 μm. (B) Quantification of NE – bgcn distance (μm) in GSCs from (A). n=112 GSCs from nos > mCherryRNAi (Control) and n=104 GSCs from nos > StwlRNAi. ** indicates p<0.01 from Student’s t-test. (C) Histogram of NE – bgcn distance (μm) in GSCs from (B). (D) Oligopaint FISH against the bgcn locus (magenta) and IF staining of Vasa (blue) in region 2a/2b differentiated germline cysts from nos > mCherryRNAi (Control) and nos > StwlRNAi ovaries following a 6d shift to 29°C. Red arrowheads indicate the bgcn locus within the nucleus. Black dotted lines indicate the nuclear boundary. Scale bar:5μm. (E) Quantification of NE – bgcn distance (μm) in region 2a/2b differentiated germ cells from (D). n=106 GSCs from nos > mCherryRNAi (Control) and n=65 GSCs from nos > StwlRNAi **** indicates p<0.0001 from Student’s t-test. (F) Histogram of of NE – bgcn distance (μm) in region 2a/2b differentiated germ cells from (E). (G) smFISH against bgcn mRNA (green) and poly-A mRNA (magenta) in GSCs from nos > mCherryRNAi (Control) following a 6d shift to 29°C. In left panel, black dotted lines demarcate region 1 and the germarium boundary. In right panel, black dotted lines indicate the nuclear boundary. Scale bar:5 μm. (H) smFISH against bgcn mRNA (green) and poly-A mRNA (magenta) in GSCs from nos > StwlRNAi following a 6d shift to 29°C. In left panel, black dotted lines demarcate the germarium boundary. In right panel, black dotted lines indicate the nuclear boundary. Scale bar:5 μm. (I) Quantification of percentage of GSCs and cystoblasts (CBs) with nascent bgcn expression from nos > mCherryRNAi (Control) and nos > StwlRNAi ovaries following a 6d shift to 29°C. For the control, n=90 (GSCs) and n=174 (CBs). For nos > StwlRNAi, n=71 (GSCs) and n=146 (CBs). ns indicates p>0.05 and *** indicates p<0.001 from a Fisher’s exact test. (J) Quantification of NE – bgcn nascent focus distance (μm) in GSCs from (G, H). n=51 GSCs from nos > mCherryRNAi (Control) and n=37 GSCs from nos > StwlRNAi. ns indicates p>0.05 from Student’s t-test. (K, L) Schematic of data from (A – C and G – H) showing the percentage of GSCs with the bgcn DNA locus and the nascent bgcn RNA focus positioned at the nuclear periphery or in the nuclear interior in GSCs from nos > mCherryRNAi (Control) and nos > StwlRNAi ovaries following a 6d shift to 29°C. (M) Model for Stwl function in female germline stem cells.

References

    1. van Steensel B., and Belmont A.S. (2017). Lamina-Associated Domains: Links with Chromosome Architecture, Heterochromatin, and Gene Repression. Cell 169, 780–791. 10.1016/j.cell.2017.04.022. - DOI - PMC - PubMed
    1. Ungricht R., and Kutay U. (2017). Mechanisms and functions of nuclear envelope remodelling. Nat Rev Mol Cell Biol 18, 229–245. 10.1038/nrm.2016.153. - DOI - PubMed
    1. Pickersgill H., Kalverda B., de Wit E., Talhout W., Fornerod M., and van Steensel B. (2006). Characterization of the Drosophila melanogaster genome at the nuclear lamina. Nat Genet 38, 1005–1014. 10.1038/ng1852. - DOI - PubMed
    1. Guelen L., Pagie L., Brasset E., Meuleman W., Faza M.B., Talhout W., Eussen B.H., de Klein A., Wessels L., de Laat W., et al. (2008). Domain organization of human chromosomes revealed by mapping of nuclear lamina interactions. Nature 453, 948–951. 10.1038/nature06947. - DOI - PubMed
    1. Gerstein M.B., Lu Z.J., Van Nostrand E.L., Cheng C., Arshinoff B.I., Liu T., Yip K.Y., Robilotto R., Rechtsteiner A., Ikegami K., et al. (2010). Integrative Analysis of the Caenorhabditis elegans Genome by the modENCODE Project. Science 330, 1775–1787. 10.1126/science.1196914. - DOI - PMC - PubMed

Publication types