[Preprint]. 2023 Nov 14:2023.11.13.564824.
doi: 10.1101/2023.11.13.564824.

Cryptococcus neoformans rapidly invades the murine brain by sequential breaching of airway and endothelial tissues barriers, followed by engulfment by microglia

Affiliations

Cryptococcus neoformans rapidly invades the murine brain by sequential breaching of airway and endothelial tissues barriers, followed by engulfment by microglia

Vanessa I Francis et al. bioRxiv. .

Update in

Abstract

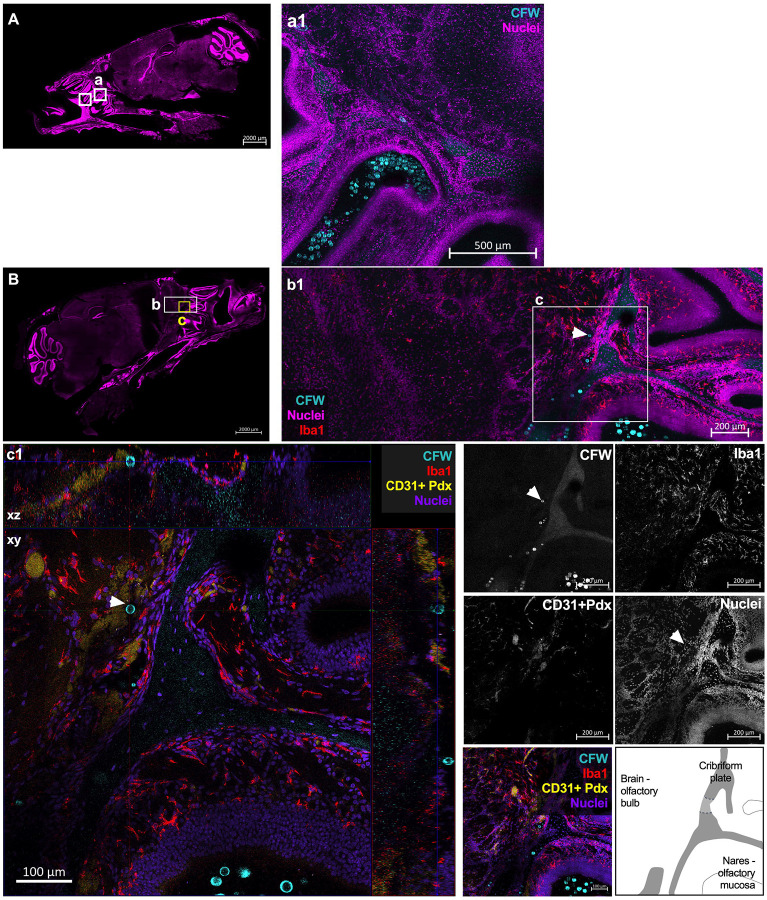
The fungus Cryptococcus neoformans causes lethal meningitis in humans with weakened immune systems and is estimated to account for 10-15% of AIDS-associated deaths worldwide. There are major gaps in our understanding of how this environmental fungus evades the immune system and invades the mammalian brain before the onset of overt symptoms. To investigate the dynamics of C. neoformans tissue invasion, we mapped early fungal localisation and host cell interactions at early times in infected brain, lung, and upper airways using mouse models of systemic and airway infection. To enable this, we developed an in situ imaging pipeline capable of measuring large volumes of tissue while preserving anatomical and cellular information by combining thick tissue sections, tissue clarification, and confocal imaging. Made possible by these techniques, we confirm high fungal burden in mouse upper airway turbinates after nasal inoculation. Surprisingly, most yeasts in turbinates were titan cells, indicating this microenvironment enables titan cell formation with faster kinetics than reported in mouse lungs. Importantly, we observed one instance of fungal cells enmeshed in lamina propria of upper airways, suggesting penetration of airway mucosa as a possible route of tissue invasion and dissemination to the bloodstream. We extend previous literature positing bloodstream dissemination of C. neoformans, via imaging C. neoformans within blood vessels of mouse lungs and finding viable fungi in the bloodstream of mice a few days after intranasal infection, suggesting that bloodstream access can occur via lung alveoli. In a model of systemic cryptococcosis, we show that as early as 24 h post infection, majority of C. neoformans cells traversed the blood-brain barrier, and are engulfed or in close proximity to microglia. Our work establishes that C. neoformans can breach multiple tissue barriers within the first days of infection. This work presents a new method for investigating cryptococcal invasion mechanisms and demonstrates microglia as the primary cells responding to C. neoformans invasion.


Figures

Figure 1.
Figure 1.. Workflow of high-content, subcellular resolution imaging of infected tissue slices.
A) Schematic of experimental protocol. Representative images of B) a sagital cut slice of infected skull, showing insets of location of C.neoformans-, and C-F) C. neoformans cells are observed in infected tissues as C) single, D) doublets, E) clusters, and F) dispersed. Images from skull of C57bl/6 male infected with 5×10⁵ H99E for 24h, via intravenous (B-E) or intranasal infection (F). Brain and skulls were cut in sagital sections, lungs into lobes or into coronal slices. Fungi identified by cell wall staining with CFW (50 pg/ml, cyan) or specific antibodies (see methods), tissues counterstained with different nuclear dyes (magenta), PI, Helix NP Blue, and Helix NPGreen, depending on other fluorophores used. Maximum intensity projections with a depth of C) 36 pm (x5 z-steps), D) 63 pm (x8 z-steps), E) 105 pm (x36 z-steps) and F) 109.47 pm (x11 z-steps). Note third panel in A is same image as SFig.2. Scale bars in panels.
Fig 2.
Fig 2.. Pipeline to delect cryptococcal cell size distribution in infected tissues.
Map of infected lung showing CFW stained cryptococcal cells and PI stained nuclei of lung cells, with consecutive magnifications from tissue to subceliular resolution. Shown are several steps in image processing and analysis which allowed measurements of fungal celii morphology in situ. Different methods were compared, including the standard method of direct diameter, versus an object boundary methods which allow automated detection. WheA) Single plane tiling map. B) Magnification and C} ROI used for quantification. D) Depth of tissue results in decreased signal intensity. Diminishing CFW signal in YZ projection (2.01 pm × 66 z-step) in a single RO! (XY) single plane, and E) which is corrected by depth correction via a normalisation algorithm and improves signal uniformity. Fungai size (diameter} was measured in this ROI via 3 methods: F) manually cross-section (0 cross section), G) manual object tracing, fdilowed by area determination, and interpolation of diameter (interpolated 0), and H) automated analysis using I mage J (NEH) StarDist macro, which uses thresholding to define object boundaries, followed by area and diameter calculation. J) Comparison of all three methods used to measure cryptococci size. n=total number of cells detected, cells >10 pm are classified as titan cells ((dashed line), images (B-t) from lung of C575I/6J male mice, 5 dpi intranasal with 5×10⁷ C. neoformans ste50&, a strain with virulence comparable to KN99 parental wild-type. Lungs stained with PI (magenta) and CFW (cyan). Images correspond to B-E) extended depth of fieid image, covering 134.8 pm depth with 2.01 pm × 68 z-steps. Scale bar in images.
Figure 3.
Figure 3.. Presence of abundant titan cells in mouse airways 24 h after intranasal instillation of yeasts.
C. neoformans and titan cells are abundant in upper airways within turbinates, closely aposed to, and invading lamina propria of the olfactory mucosa. A) Skull slice, showing several instances of cryptococcis apposed to mucosa and a1) ROI a magnified. [See supplementary video 1 to visualise YZ], B) Titan cells are abundant in olfactory mucosa, as early as 24 hpi of H99E 5×10⁵ CFU. Cryptococci size measured using StarDist, combined data from two skull slices from the same mouse. C) Cryptococci can be observed throughout the upper airway, and invading mucosa, with c.1) highlighting location of fungal cells, and c.2) cryptococcii within turbinates (white arrows) and c.2–3) emeshed in lamina propria, below mucosal layer; cell body of diameter 12.98 pm (top) and 9.85 pm (bottom) measured by StarDist. A) Skull single plane a.1) xy single planes, followed by and xyz projection (right panel). B) Quantification of cryptococci size. 2 skull slices from the same animal were imaged with a depth of 225 or 208 pm, 26× 9pm or 20×10.95 z-step respectively. C) Skull slice (same animal as A, new slice, with maximum projection, 2×27 pm z-step). c.1) max projection 225 pm, 26×9 pm z-step; c.2) 6 pm max projection (2×6 pm z-step); c.3) 84 pm (15×6 pm z-step) xyz projection. Sagittal slices corresponding to Allen Brain map slices A) 15–29 and C) 11–15 Scale bar indicated in figure.
Figure 4.
Figure 4.. Presence of titan cells in mouse brain at 7 days post-intranasal infection, located near the cribriform plate in mouse brain as well as persistence of fungi in mouse nares.
C. neoformans fungi, including titan cells, are present in the olfactory bulb side of the cribiform plate 7 dpi and continue to be abundant in upper airways and attached to ollfactory mucosa. A-B) C. neoformans fungi found in nares and ethmoturbinates(boxes). a1) abundant cryptococci, including titan cells in nares. b1–c1)C. neoformans cells in brain above cribriform plate, as well as yeasts in nares just below cribiform plate. c1) Titan cell located in brain olfactory bulb (white arrow, 17.79 |jm diameter), above the cribriform plate. Images shown are A-B) single plane of skull sections, a1) maximum intensity projection comprising 68 |jm (4 pm × 18 z-steps) deep, b1–c1) xyz projection with depth of 145.51 pm (2.35 pm × 63 z-steps) and maximum intensity projections of same area with a depth of 28.16 pm (2.35 pm × 13 z-steps). Scale bar indicated in images. ForA-C, fungi cell wall CFW in cyan, nuclei in magenta, Iba1 in red, CD31 +Pdx in yellow, with single colors images in greyscale.
Fig 5.
Fig 5.. Cryptococci from alveoli access bloodstream in lungs at 3 and 7dpi.
A) Whole lung section map allows visualization of fungi in lungs (left) followed by confocal imaging (right) showing cryptococci situated in alveoli (A-a1). A significant portion of cryptococci found in EpCAM+ airways (a2–a3), particularly in bronchioles and terminal bronchioli, and rare instances of cryptococci found in blood vessels (a3), identified by CD31+Pdx endothelium staining. B) Viable fungi can be found in bloodstream (cardiac bleed) after intranasal infection at day 3. Images are maximum projections from A) 18×25 pm z-step) a1) 23×3 pm z-step, a2) 14×13 pm z-step, a3)12×13 pm z-step, and orthogonal view in right panel. Data from from CX3Cr1GFP/+ (A) and C57bl/6J (B) mice intranasally infected with 5×10⁵ CFU of mCardinal H99. Data represent individual mice. Scale bar indicated in images. For A, fungi cell wall CFW in orange, nuclei in green-blue, channels merged via transparency overlay. For a1–a3, fungi cell wall CFW in cyan, nuclei in magenta, CD31+Pdx in yellow (white in xyz projection), EPCAM in green, with single colors in greyscale.
Figure 6.
Figure 6.. C. neoformans locations after intravenous infection show a dispersed pattern, consistent with bloodstream dissemination and passive arrest in cappilaries.
C. neoformans locations dispersed through the skull, most frequently found as clusters of >2 fungi, indicating either multiple cells traversing at same location or that fungal cells are already replicating in tissue. A-B) Two skulls sagital section of C57bl/6J mice, with white dots indicating locations of C.neoformans. C) Quantification of single, doublet and clusters (>2 fungi, representative images in Fig. 1). Graphs quantify 4 mice: two males C57bl/6 each with 225 pm-thick sagital section (26×9 pm z-steps) and two female CX3Cr1GFP/+ 140–150 pm-thick (5×35 pm z-steps, 6×30 pm z-steps), 1 day after tail vein i.v. with 5×10⁵ CFU of H99E and mCardinal strain, respectively Images shown from Images from two males C57bl/6, sagital cuts corrresponding to slices A) 8–14 and B) 13–19 of Allen Brain Atlas. C) Individual mice (mouse # in tops graphs, and individual dots in bottom graph) and and mean of all mice shown. CFW in cyan, nuclei in magenta.
Fig. 7.
Fig. 7.. Traversal of BBB by C. neoformans leads to association with Iba1+ cells within 24hpi.
Association of fungal cells with Iba1 + cells, the brain resident microglia, including border-associated microglia in mouse brains, as early as 24hpi. A) Representative image of a skull with location of C.neoformans. B) Quantification of microglia association with Cn. C) Representative images of cryptococci clusters associated with Iba1 + cells, and in proximity to CD31+Pdx+ blood vessels, with panel e1 showing 1 cryptococci not associated with Iba1+-cells. D) Distance of cryptococci to closest bloodvessel, stained with CD31+Pdx. E) Area occupied by microglia increases with size of cryptococci cluster with F) showing magnifications of b1 and c1 to show multiple nuclei of microglia (yellow arrows) and touching processes of neighboring microglia (yellow arrowheads). For B) data from n=4 mice, datapoints correspond to individual mice, 1 skull section analyzed per mouse, 24hpi i.v. infection with 5×10⁵ of strain mCardinal and H99E in two CX3Cr1GFP/+ female mice and two C57bl/6J male, respectively. For D-E) datapoints represent each cryptococci cluster, ROI randomly selected from 2 mice sections, n=26 total. Images are maximum projections of A) 140 μm (5×35 μm z-steps), corresponding to Allen Brain map sagital sections 13–18; a1) 75 μm (76×1 μm z-steps; b1) 45 μm (46×1 μm z-steps); c1) 81 μm (82×1 μm z-steps); d1) 74 μm (75×1 μm z-steps); e1) 69 μm (70×1 μm z-steps). Scale bars in images. [see SFig.5 for representative images from C57bl/6J mice, and SFig.6–7 for xyz projections of b1 and c1]. For A-C, fungi cell wall CFW in cyan, nuclei in magenta, Iba1 in red, CD31+Pdx in yellow, with single colors in greyscale. For F, CFW in cyan, nuclei in magenta, Iba1 in greyscale/white.
Fig.8.
Fig.8.
Cryptococcus neoformans traversal of barriers culminating in brain parenchyma invasion.

Similar articles

References

    1. WHO fungal priority pathogens list to guide research, development and public health action. https://www.who.int/publications-detail-redirect/9789240060241.
    1. Goldman D.L., Khine H., Abadi J., Lindenberg D.J., Pirofski L., Niang R., and Casadevall A. (2001). Serologic evidence for Cryptococcus neoformans infection in early childhood. Pediatrics 107, E66. - PubMed
    1. Coelho C., and Farrer R.A. (2020). Pathogen and host genetics underpinning cryptococcal disease. In Advances in Genetics (Elsevier; ), p. S0065266020300031. 10.1016/bs.adgen.2020.02.001. - DOI - PMC - PubMed
    1. Alanio A. (2020). Dormancy in Cryptococcus neoformans: 60 years of accumulating evidence. J. Clin. Invest. 10.1172/JCI136223. - DOI - PMC - PubMed
    1. Colombo A.C., and Rodrigues M.L. (2015). Fungal colonization of the brain: anatomopathological aspects of neurological cryptococcosis. An. Acad. Bras. Ciênc. 87, 1293–1309. 10.1590/00013765201520140704. - DOI - PubMed

Publication types