[Preprint]. 2023 Nov 28:2023.11.17.567593.
doi: 10.1101/2023.11.17.567593.

Poc1 is a basal body inner junction protein that promotes triplet microtubule integrity and interconnections

Affiliations

Poc1 is a basal body inner junction protein that promotes triplet microtubule integrity and interconnections

Marisa D Ruehle et al. bioRxiv. .

Update in

Abstract

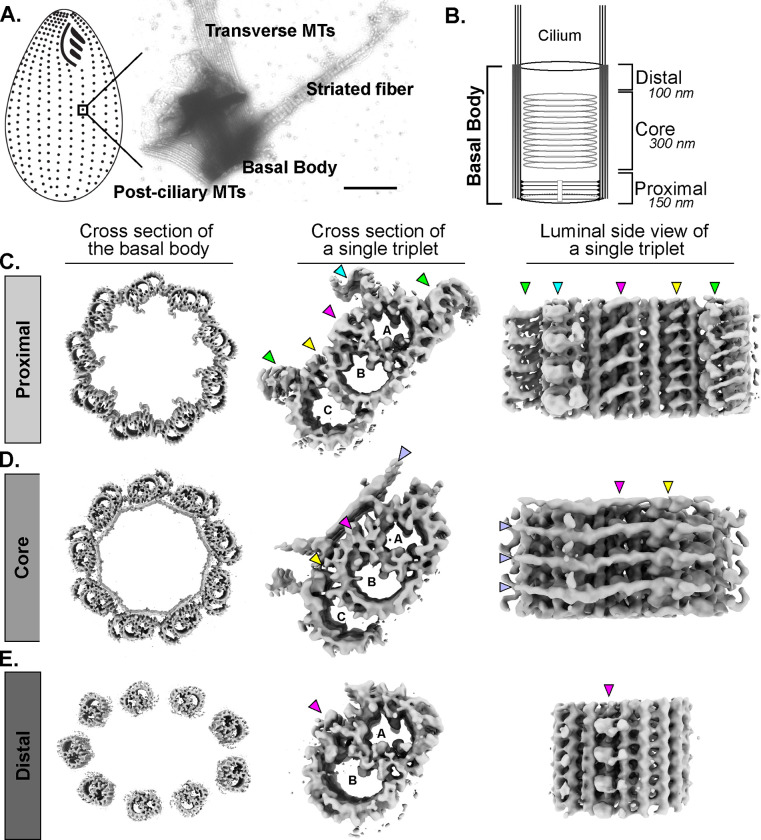
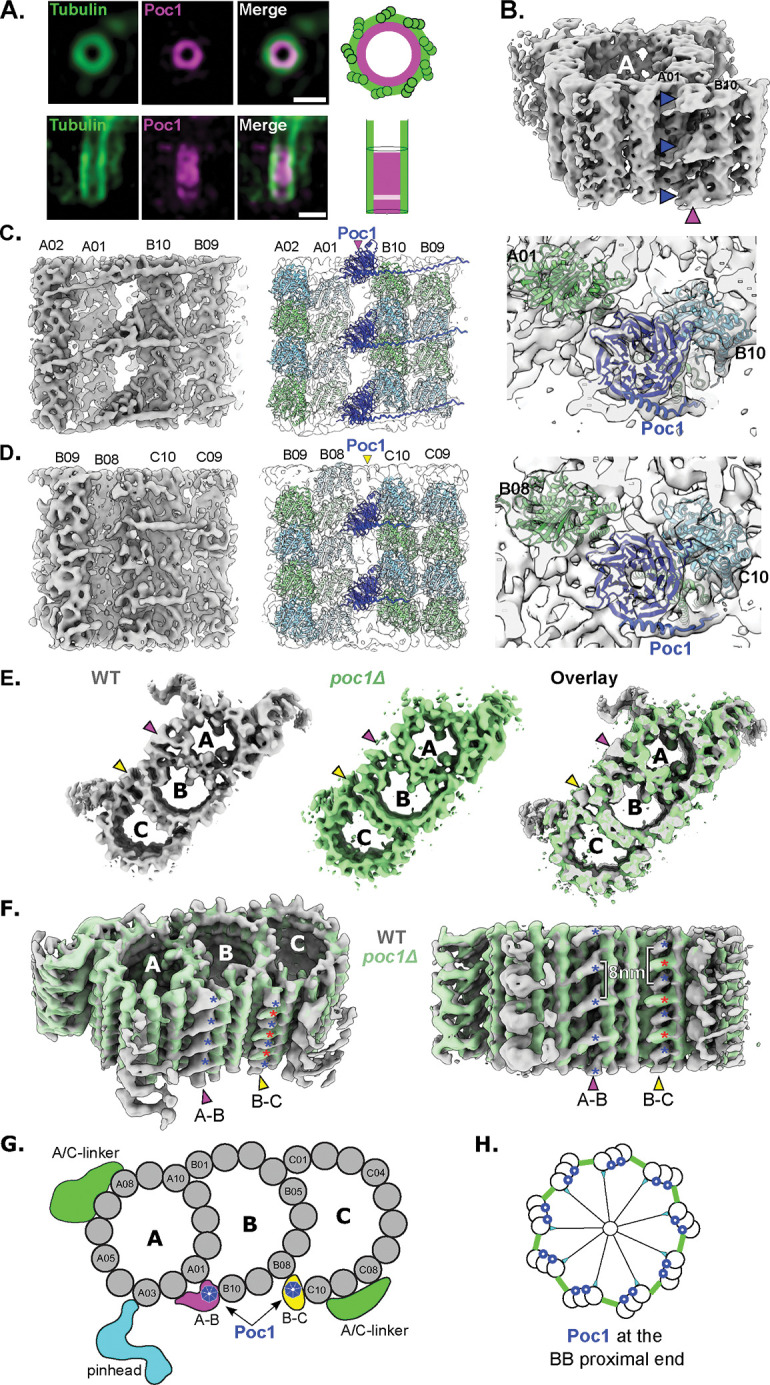
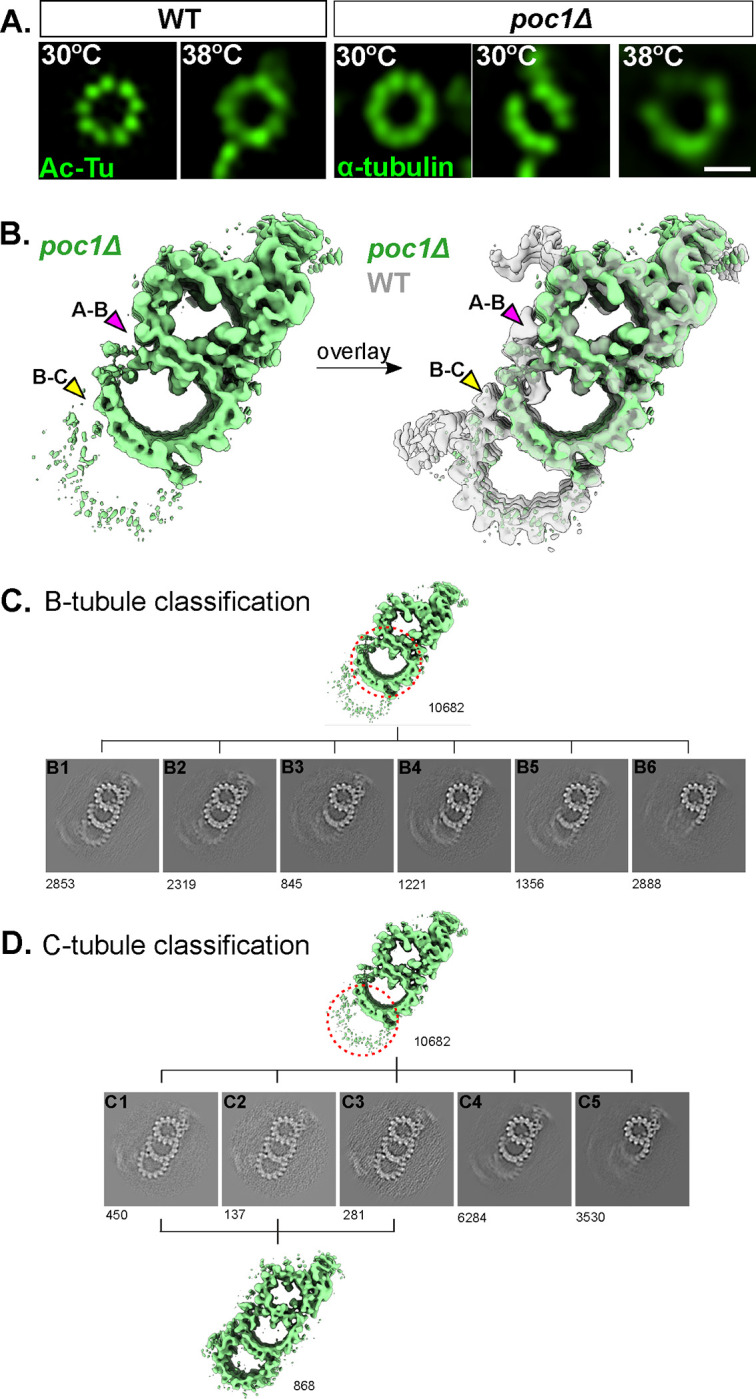
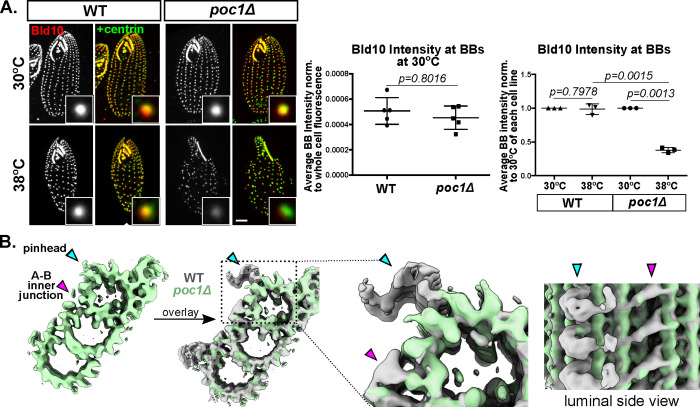
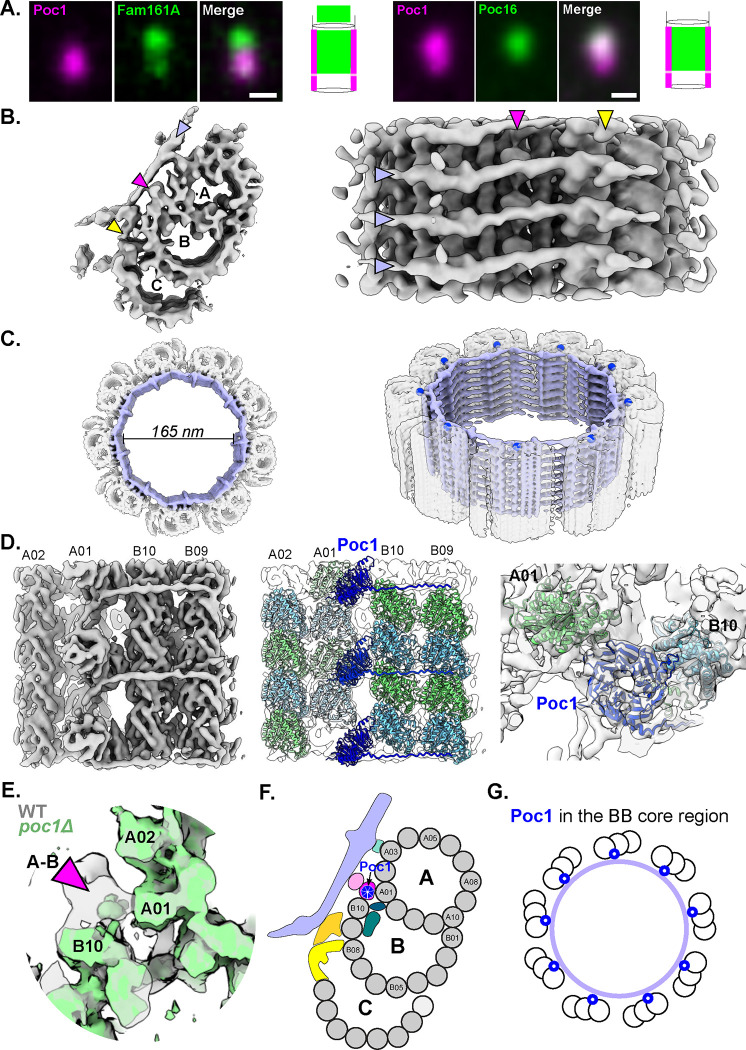
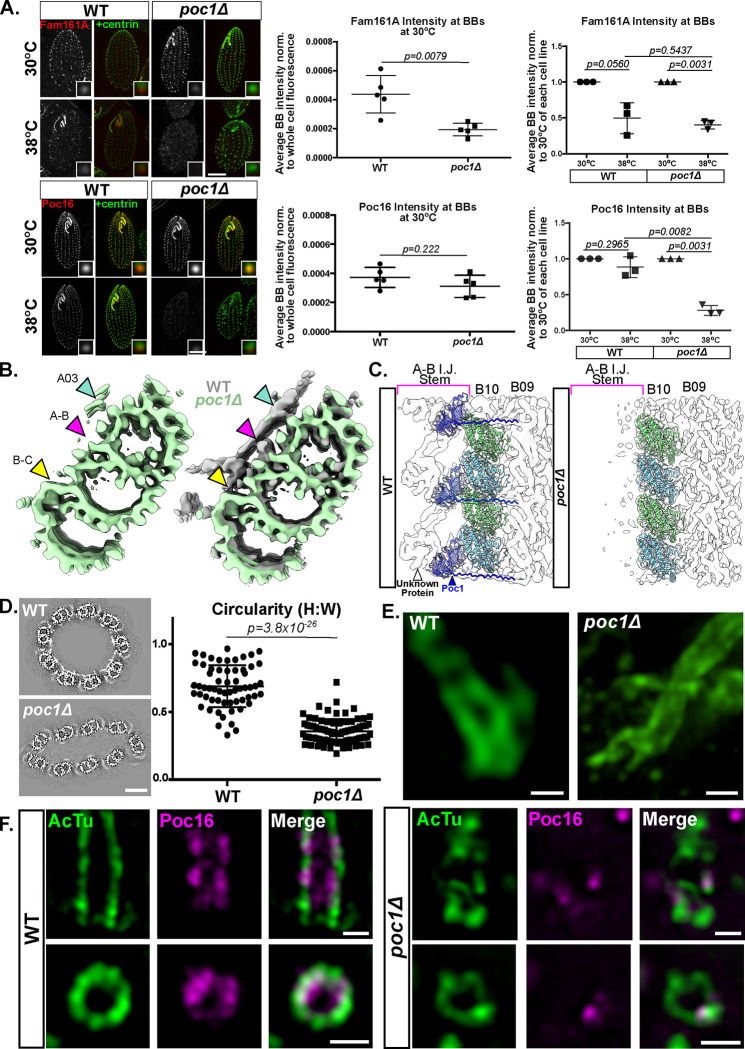
Basal bodies (BBs) are conserved eukaryotic structures that organize motile and primary cilia. The BB is comprised of nine, cylindrically arranged, triplet microtubules (TMTs) that are connected to each other by inter-TMT linkages which maintain BB structure. During ciliary beating, forces transmitted to the BB must be resisted to prevent BB disassembly. Poc1 is a conserved BB protein important for BBs to resist ciliary forces. To understand how Poc1 confers BB stability, we identified the precise position of Poc1 binding in the Tetrahymena BB and the effect of Poc1 loss on BB structure. Poc1 binds at the TMT inner junctions, stabilizing TMTs directly. From this location, Poc1 also stabilizes inter-TMT linkages throughout the BB, including the cartwheel pinhead and the inner scaffold. Moreover, we identify a molecular response to ciliary forces via a molecular remodeling of the inner scaffold, as determined by differences in Fam161A localization. Thus, while not essential for BB assembly, Poc1 promotes BB interconnections that establish an architecture competent to resist ciliary forces.

Keywords: basal body; cilia; inner junction; microtubule.


Figures

Figure 1:
Figure 1:. The structure of the Tetrahymena basal body.
A) Cartoon diagram of a Tetrahymena cell with BBs in black on left. On right, negative stain image of a single BB isolated for cryoET showing BB appendage structures are maintained. Scale bar is 400 nm. B) Cartoon of the BB showing the three regions for which structures were determined: Proximal, Core, and Distal. The proximal region lumen harbors the cartwheel and the core contains the inner scaffold, indicated in the cartoon. C-E) CryoET structure of the Tetrahymena BB in the proximal (C), core (D), and distal (E) regions. Left: cross sectional view of a BB with the TMT subtomogram average mapped onto the TMTs in ice. Note that in the proximal and core regions the BB is circular, but the distal end is flattened. This is likely due to the force from freezing the BB on the EM grid in ice and a lack of an interconnecting structure at the distal end. Middle: cross sectional view of the TMT subtomogram average from each region. For the core region, this is the subclass of complete TMTs. For the distal region, no complete TMTs were observed. Right: luminal side view of the TMT subtomogram average structure. Arrow heads point to features of the TMTs: green, A/C linkers; cyan, pinhead; magenta, A-B inner junction; yellow, B-C inner junction; lavender, inner scaffold.
Figure 2:
Figure 2:. Poc1 localizes to the A-B and B-C inner junctions of triplet microtubules at the proximal end of the basal body.
A) Cross sectional (top) and longitudinal (bottom) views of UExM-SIM expanded BBs from intact Tetrahymena cells, stained with anti-α-tubulin and anti-GFP antibodies to detect GFP:Poc1. The cells are poc1Δ rescued with GFP:Poc1. Scale bars are 500 nm, not corrected for expansion factor. B) Focused refinement of the WT A-tubule and A-B inner junction (magenta arrowhead) at ~13 Å shows a doughnut shaped density (blue arrowheads) with 8 nm periodicity bridging protofilaments A01 and B10. C) The A-B inner junction density is a WD40 domain. Left: focused refinement of the A-B inner junction at 9.8 Å resolution, luminal side view. Middle and right show luminal side and top-down views, respectively, with ribbon diagrams of α- and β-tubulin (light green and cyan, PDB ID 8G2Z) modeled into protofilaments A01 and B10. An AlphaFold2 predicted structure of Poc1 is modeled into the A-B inner junction doughnut shaped density. See also Video 2 and Materials and methods for fitting. D) Focused refinement of the B-C inner junction at 10 Å, shows a WD40 density with 8 nm periodicity, interspersed with another protein density. Ribbon diagrams of α- and β-tubulin and Poc1 were modeled into the electron density as described above. E) Individual structures and overlay of WT TMTs (gray) with poc1Δ complete TMTs (green) in cross sectional view. Arrows indicate the positions of the A-B and B-C inner junctions and show a loss of density in poc1Δ TMTs. F) Glancing cross sectional view on left, luminal side view on right. The WD40 densities described at the WT A-B and B-C inner junctions (blue asterisks) in C and D are missing in the poc1Δ complete TMT, while the interspersed density at the B-C inner junction (red asterisk) remains. G) Schematic representation of the WT TMT structure from the proximal region of the Tetrahymena BB. Color scheme: gray, tubulin; green, A/C linker; cyan, pinhead; magenta, A-B inner junction; yellow, B-C inner junction; blue, Poc1. H) Schematic representation of Poc1’s localization at the proximal region A-B and B-C inner junctions of Tetrahymena BBs. Poc1 is indicated in blue.
Figure 3:
Figure 3:. Poc1 stabilizes microtubules in the proximal region of the basal body.
A) WT and poc1Δ BBs from whole cells expanded and imaged by UExM-SIM, stained with either anti-acetylated tubulin or anti-α-tubulin antibodies. Individual TMTs are observable in both WT and poc1Δ BBs. WT at 30°C and 38°C maintain all nine TMTs and overall circular shape. poc1Δ BBs are mostly comprised of nine TMTs at 30°C, but occasionally show loss of one or two TMTs (loss of two TMTs shown here). At 38°C, poc1Δ BBs lose uniform shape and tubulin signal is uneven, indicative of tubulin loss. Scale bar is 500 nm. B) Overall subtomogram average of poc1Δ TMTs in the proximal region shows loss of protofilaments. Left, poc1Δ TMT only (green). Right, poc1Δ overlaid with WT (gray). C) Classification of poc1Δ TMTs focused on the B-tubule (demarcated by a dashed red circle) into six classes displaying different states of B-tubule disintegration. The most severe protofilament loss is at the luminal side of the triplet, consistent with Poc1’s binding location on the TMT. The numbers of subtomogram in the classes are indicated . D) Classification of poc1Δ TMTs focused on the C-tubule (demarcated by a dashed red circle) into five classes displaying different states of C-tubule disintegration. Classes 1–3 are complete TMTs. The combined average of these classes was used for density loss comparison in Fig. 2E and Fig. 4B. The numbers of subtomogram in the classes are indicated.
Figure 4:
Figure 4:. Poc1 stabilizes the pinhead at the proximal end of the BB.
A) Bld10 is lost in high force conditions from poc1Δ BBs. Left images: WT and poc1Δ cells expressing Bld10:mCherry at 30°C and 38°C. Cells were fixed and stained with anti-mCherry antibody to visualize Bld10 (grayscale, red) and anti-centrin antibody to visualize all BBs (green). Cells were starved for 12 h to attenuate new BB assembly and temperature shifted for 12 h before fixation. Scale bar is 5 μm. Middle: Comparison of BB Bld10:mCherry levels at 30°C between WT and poc1Δ cells. Each point on the graph represents the average of 15 BBs, normalized to the total cell levels of mCherry determined for that cell (see Materials and Methods). There is no stastical difference in amounts of Bld10 at BBs between WT and poc1Δ cells. Graph shows mean +/− standard deviation. Right: Comparison of BB Bld10:mCherry levels in WT and poc1Δ cells at 30°C and 38°C. Bld10mCh levels at 30°C for each cell line were normalized to 1. Each point on the graph represents an independent experiment consisting of 150 BBs. Graph shows mean +/− standard deviation. BBs lose Bld10 at 38°C in poc1Δ cells, but not in WT cells. B) Cross sectional view of poc1Δ complete TMTs (green) alone and overlaid with WT TMTs (gray) shows loss of electron density at the pinhead. Right, zoomed in view of overlaid structure in cross-sectional and luminal side views. The pinhead is lost in poc1Δ TMTs even though the A-tubule structure where it should attach is intact. Cyan arrowhead, pinhead; magenta arrowhead, A-B inner junction.
Figure 5:
Figure 5:. Poc1 is an anchor for the inner scaffold to the TMTs in the core region.
A) Core region proteins Fam161A and Poc16 localize to BBs in Tetrahymena. Left, longitudinal view of Fam161A:mCherry (green) localization relative to Poc1:HaloTag (magenta) in WT cells. Right, longitudinal view of Poc16:mCherry (green) localization relative to Poc1:HaloTag (magenta) in WT cells. Longitudinal views are oriented with the cell exterior at the top of the image and the cell interior at the bottom. Diagrams of each protein’s localization are shown at right. Poc16 localizes to the core region only, whereas Fam161A has core and presumed transition zone localization. Images were acquired with a confocal microscope. Scale bars are 500 nm. B) Structure of the WT TMT from the core region. Left, subclass of complete TMTs (see Fig. S4A for overall average). Right, luminal side view of complete TMT. Arrowheads indicate the inner scaffold (lavender) and position of the inner scaffold attachment to the TMT at the A-B inner junction (magenta) and B-C inner junction (yellow). C) Complete TMT subtomogram average mapped onto an individual BB in ice shows the inner scaffold (lavender) and cylindrical shape. The A-B inner junction is indicated by blue dots in the image on right. The scaffold is a structure of stacked rings of 165 nm in diameter. D) Focused refinement on the A-B inner junction in the core region at 8.47 Å in luminal side view (left and middle) and top-down view (right). Ribbon diagrams for α- and β-tubulin and Poc1 are modeled into the density and colors are as described in Fig. 2 legend. An unknown protein density associates with the BB lumen-exposed side of Poc1 to form the A-B inner junction stem attachment to the inner scaffold. See also Video 4. E) Zoomed in view of the A-B inner junction from WT (gray) overlaid with poc1Δ (green) TMTs shows the WD40 density observed in the WT A-B inner junction (magenta arrowhead) is missing in the poc1Δ A-B inner junction. Both structures are from the subclasses of complete TMTs. F) Schematic representation of the WT TMT in the core region of the BB. Color scheme is as follows: gray, tubulin; lavender, inner scaffold; teal, A03 inner scaffold attachment; pink shades, A-B inner junction stem; yellow shades, B-C inner junction inner scaffold attachment; green shades, B-tubule luminal densities; blue, Poc1. G) Schematic representation of Poc1 (blue) localization in the BB core region with the inner scaffold represented by a lavender circle.
Figure 6:
Figure 6:. Poc1 stabilizes the inner scaffold in the core region of the BB and promotes BB shape maintenance.
A) Fam161A and Poc16 localizations depend on Poc1 under high force conditions. WT and poc1Δ cells expressing Fam161A:mCherry (top left panels) and Poc16:mCherry (bottom left panels) at 30°C and 38°C. Cells were fixed and stained with anti-mCherry antibody to visualize Fam161A or Poc16 (grayscale, red) and anti-centrin antibody to visualize all BBs (green). Cells were starved for 12 h to attenuate new BB assembly and temperature shifted for 12 h before fixation. Scale bars are 10 μm. Middle graphs show quantification of Fam161A (top) and Poc16 (bottom) in WT versus poc1Δ BBs at 30°C, using total cell fluorescence to account for differences in assortment and / or expression between cell lines. BBs lacking Poc1 show defects in Fam161A, but not Poc16, binding under normal force conditions. Right graphs show quantification of Fam161A (top) and Poc16 (bottom) at BBs in WT versus poc1Δ cells at 30°C and 38°C. Values were normalized to the signal for each strain at 30°C. Each point on the graph represents an independent experiment consisting of 150 BBs. Graph shows mean +/− standard deviation. Both WT and poc1Δ BBs lose Fam161A upon shift to 38°C, whereas Poc16 is only lost in poc1Δ cells at 38°C. B) Cross sectional view of the complete TMT from the core region in poc1Δ alone (green) and overlaid with WT (gray). Arrowheads point to the inner scaffold attachment sites: A03 attachment site (teal), A-B inner junction attachment site (magenta), and B-C inner junction attachment site (yellow). Note the inner scaffold and A-B and B-C inner junction attachment sites are missing in poc1Δ TMTs, while the A03 attachment site is preserved albeit at a reduced level compared to WT. C) Side view of the focused refinement of the A-B inner junction / stem attachment in WT (left) and poc1Δ (right) TMTs showing in WT BBs Poc1 binds directly to the A-B inner junction and coordinates the binding of an unknown protein directly to Poc1’s WD40 domain. In poc1Δ BBs, both the Poc1 density and unidentified protein’s density are missing. D) Representative cross-sectional views of the core region of whole BBs in ice with the subtomogram averages from WT and poc1Δ TMTs superimposed on the TMTs from the individual BBs. Note that WT BBs are circular, whereas poc1Δ BBs are flattened. Bottom, graph of circularity measurements from all WT (n=61) and poc1Δ (n=81) BBs used in this study shows that poc1Δ BBs are significantly less circular than WT BBs. Graph shows mean +/− standard deviation. Scale bar is 50 nm. E) UExM-SIM of WT and poc1Δ BBs at 38°C stained with anti-α−tubulin antibody shows that WT BBs exhibit a gradual bend, whereas poc1Δ BBs display severe shape malformations that are likely to precede fracture and disassembly. Scale bar is 500 nm. F) UExM-SIM of WT and poc1Δ BBs at 38°C expressing Poc16:GFP and stained with anti-GFP (magenta) and anti-acetylated tubulin (green) antibody. Top panels show longitudinal views of individual BBs (with distal end of BB at top of the image) and bottom panels show cross sections of individual BBs. Poc16 is lost in poc1Δ BBs in places where tubulin defects are observable. Scale bars are 500 nm.

Similar articles

References

    1. Abal M., Keryer G., and Bornens M.. 2005. Centrioles resist forces applied on centrosomes during G2/M transition. Biol Cell. 97:425–434. doi:10.1042/BC20040112. - DOI - PubMed
    1. Allen R.D. 1969. The morphogenesis of basal bodies and accessory structures of the cortex of the ciliated protozoan Tetrahymena pyriformis. J. Cell Biol. 40:716–733. - PMC - PubMed
    1. Andersen J.S., Wilkinson C.J., Mayor T., Mortensen P., Nigg E.A., and Mann M.. 2003. Proteomic characterization of the human centrosome by protein correlation profiling. Nature. 426:570–574. doi:10.1038/nature02166. - DOI - PubMed
    1. Arslanhan M.D., Cengiz-Emek S., Odabasi E., Steib E., Hamel V., Guichard P., and Firat-Karalar E.N.. 2023. CCDC15 localizes to the centriole inner scaffold and controls centriole length and integrity. J. Cell Biol. 222. doi:10.1083/jcb.202305009. - DOI - PMC - PubMed
    1. Beck B.B., Phillips J.B., Bartram M.P., Wegner J., Thoenes M., Pannes A., Sampson J., Heller R., Göbel H., Koerber F., Neugebauer A., Hedergott A., Nürnberg G., Nürnberg P., Thiele H., Altmüller J., Toliat M.R., Staubach S., Boycott K.M., Valente E.M., Janecke A.R., Eisenberger T., Bergmann C., Tebbe L., Wang Y., Wu Y., Fry A.M., Westerfield M., Wolfrum U., and Bolz H.J.. 2014. Mutation of POC1B in a severe syndromic retinal ciliopathy. Hum Mutat. 35:1153–1162. doi:10.1002/humu.22618. - DOI - PMC - PubMed

Publication types