[Preprint]. 2023 Nov 13:2023.11.10.566593.
doi: 10.1101/2023.11.10.566593.

Network Enrichment Significance Testing in Brain-Phenotype Association Studies

Affiliations

Network Enrichment Significance Testing in Brain-Phenotype Association Studies

Sarah M Weinstein et al. bioRxiv. .

Update in

Abstract

Functional networks often guide our interpretation of spatial maps of brain-phenotype associations. However, methods for assessing enrichment of associations within networks of interest have varied in terms of both scientific rigor and underlying assumptions. While some approaches have relied on subjective interpretations, others have made unrealistic assumptions about the spatial structure of imaging data, leading to inflated false positive rates. We seek to address this gap in existing methodology by borrowing insight from a method widely used in genomics research for testing enrichment of associations between a set of genes and a phenotype of interest. We propose Network Enrichment Significance Testing (NEST), a flexible framework for testing the specificity of brain-phenotype associations to functional networks or other sub-regions of the brain. We apply NEST to study phenotype associations with structural and functional brain imaging data from a large-scale neurodevelopmental cohort study.


Conflict of interest statement

Russell T. Shinohara receives consulting income from Octave Bioscience and compensation for reviewership duties from the American Medical Association. Aaron Alexander-Bloch receives consulting income from Octave Bioscience and holds equity and serves on the board of directors of Centile Biosciences. Mingyao Li receives research funding from Biogen Inc. that is unrelated to the current manuscript.

Figures

Figure C.1.
Figure C.1.
Example maps of n-back-age, sex, and age × sex associations from one simulation setting (with Nsub=300). Observed vertex-level statistics are estimated after randomly selecting 300 PNC participants from the full sample. Null statistics are estimated after first permuting the full PNC sample and then randomly selecting 300 participants from the permuted data. The null maps appear to exhibit spatial smoothness and structure, which may explain the type I error rate inflation we observe for both the spin test and FastGSEA.
Figure 1.
Figure 1.
Example of how brain-phenotype associations are (A) quantified and spatially mapped and (B) compared to maps of functional networks (e.g., those delineated by Yeo et al. (2011)). As we discuss in Section 1, existing methods for evaluating network specificity (or “enrichment”) of brain-phenotype associations have been subjective, which may preclude reproducibility, or relied on strong assumptions, which may result in type I error inflation. In Section 2, we propose a new approach, called NEST, to address these limitations.
Figure 2.
Figure 2.
Illustration of our proposed method, NEST, which adapts Subramanian et al. (2005)’s GSEA in order to test network enrichment of brain-phenotype associations. For the purpose of this illustration, we use a simulated example of a left hemisphere fsaverage5 map using the Schaefer et al. (2018) parcellation involving 100 locations per hemisphere. (In contrast, the real data analysis described in this paper includes over 10,000 locations (vertices) per hemisphere; see Section 2.3). In extending GSEA to the neuroimaging setting, our goal is to statistically test whether brain-phenotype associations are especially strong within a network of interest, 𝒩 (binary map shown in B uses Yeo et al. (2011)’s default mode network as an example, resampled to the Schaefer et al. (2018) atlas with a lower dimension). In A, we begin with a quantitative map of brain-phenotype associations, where positive associations are represented in red and negative associations are represented in blue. Next, we sort the values of the association metric in A from positive to negative. In B, we match the order of the sorted list of association metrics in A to the binary brain map corresponding to 𝒩 (dark lines correspond to locations v𝒩; faint lines correspond to locations v𝒩). In C, we quantify the extent to which values of T(v) with larger magnitudes (i.e., either darker reds or darker blues) tend to appear within versus outside 𝒩. A running sum statistic is initialized at 0 and increases by an increment proportional to T(v) for v𝒩. We indicate this with upward-pointing triangles, shaded based on the corresponding location in A. For v𝒩, we decrease the running sum statistic by a uniform increment (indicated with upside-down triangles). The enrichment score (ES, green dotted line) is the largest magnitude attained of the running sum and is used as our test statistic for evaluating H0 (Equation (5)). For inference, we repeatedly permute the phenotype of interest across participants, re-calculate the association map based on that permuted phenotype, and repeat A-C. The enrichment scores obtained from permuted data form a null distribution for testing H0.
Figure 3.
Figure 3.
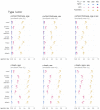
Comparison of type I error levels of our proposed method (NEST), the spin test (Alexander-Bloch et al. 2018), and FastGSEA (Korotkevich et al. 2016; Park et al. 2018). 95% binomial confidence intervals are shown with segments surrounding each point (may not be visible for especially small intervals). We find that NEST controls type I error levels at the nominal level (α=0.05) in simulation studies involving all brain-phenotype associations, all networks, and all sample sizes. In contrast, neither the spin test nor FastGSEA control type I errors, suggesting these methods may not be reliable in tests of network enrichment. We speculate that this may be due to inherent spatial smoothness of null brain-phenotype association maps, even in the absence of network enrichment. Examples of simulated null association maps involving the n-back task are shown in Figure C.1 of Appendix C.
Figure 4.
Figure 4.
Power of NEST based on data-driven simulation studies. 95% binomial confidence intervals are indicated with line segments surrounding each point (not visible for especially small intervals).
Figure 5.
Figure 5.
Results from application of NEST to evaluate network enrichment of associations between cortical thickness or n-back with age, sex, or age × sex interactions. For each setting, we map association statistics (signed multivariate Wald statistic, as described in Section 2.3.1 and Appendix B) across the cortical surface. Unadjusted p-values are reported for each of Yeo et al. (2011)’s seven networks, with bold text indicating results that remain statistically significant after controlling the false discovery rate (FDR) at q<0.05 across both brain measurements (cortical thickness, n-back), all three phenotypes (age, sex, age×sex), and all seven networks.

References

    1. Alexander-Bloch Aaron F, Shou Haochang, Liu Siyuan, Satterthwaite Theodore D, Glahn David C, Shinohara Russell T, Vandekar Simon N, and Raznahan Armin (2018). “On testing for spatial correspondence between maps of human brain structure and function”. In: Neuroimage 178, pp. 540–551. - PMC - PubMed
    1. Baller Erica B, Valcarcel Alessandra M, Adebimpe Azeez, Alexander-Bloch Aaron, Cui Zaixu, Gur Ruben C, Gur Raquel E, Larsen Bart L, Linn Kristin A, O’Donnell Carly M, et al. (2022). “Developmental coupling of cerebral blood flow and fMRI fluctuations in youth”. In: Cell Reports 38.13, p. 110576. - PMC - PubMed
    1. Baum Graham L, Cui Zaixu, Roalf David R, Ciric Rastko, Betzel Richard F, Larsen Bart, Cieslak Matthew, Cook Philip A, Xia Cedric H, Moore Tyler M, et al. (2020). “Development of structure–function coupling in human brain networks during youth”. In: Proceedings of the National Academy of Sciences 117.1, pp. 771–778. - PMC - PubMed
    1. Belzunce Felix, Riquelme Carolina Martinez, and Mulero Julio (2015). An introduction to stochastic orders. Academic Press.
    1. Burt Joshua B, Helmer Markus, Shinn Maxwell, Anticevic Alan, and Murray John D (2020). “Generative modeling of brain maps with spatial autocorrelation”. In: NeuroImage 220, p. 117038. - PubMed

Publication types