[Preprint]. 2025 Jan 26:2023.11.10.566609.
doi: 10.1101/2023.11.10.566609.

Non-muscle myosin II regulates presynaptic actin assemblies and neuronal mechanobiology in Drosophila

Affiliations

Non-muscle myosin II regulates presynaptic actin assemblies and neuronal mechanobiology in Drosophila

Biljana Ermanoska et al. bioRxiv. .

Update in

Abstract

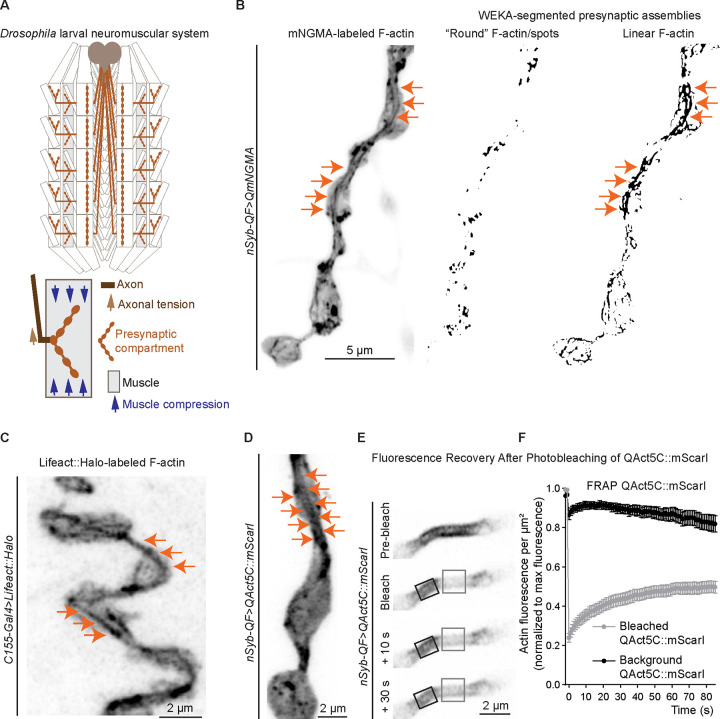
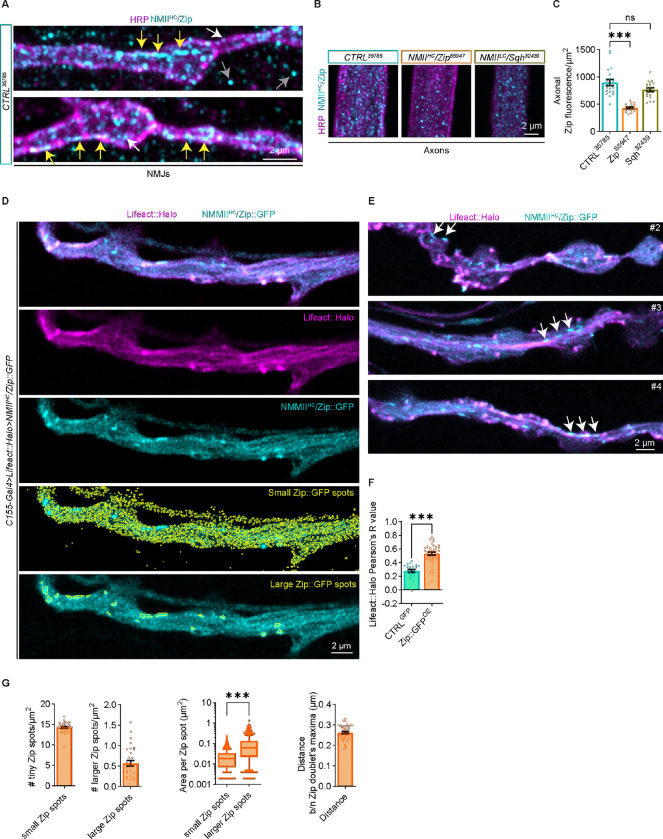
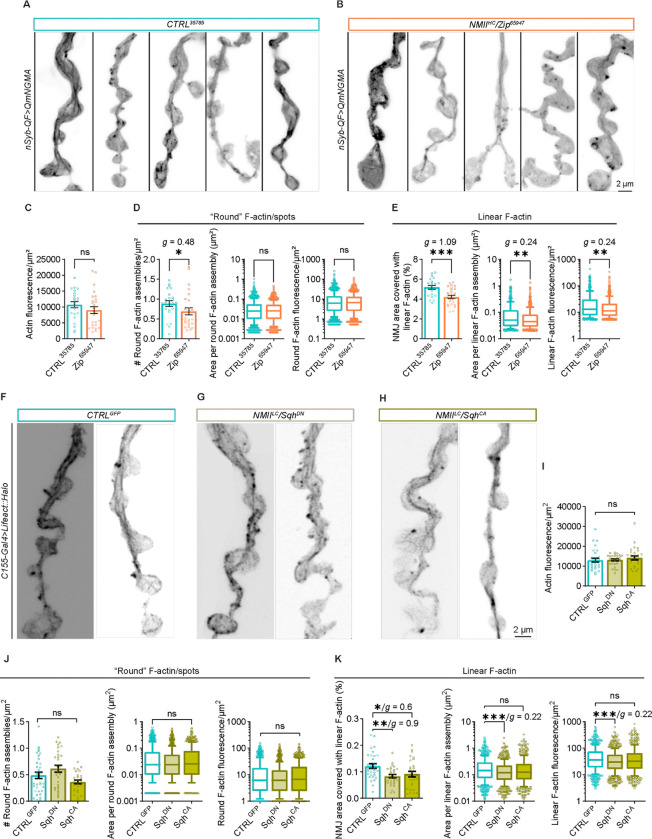
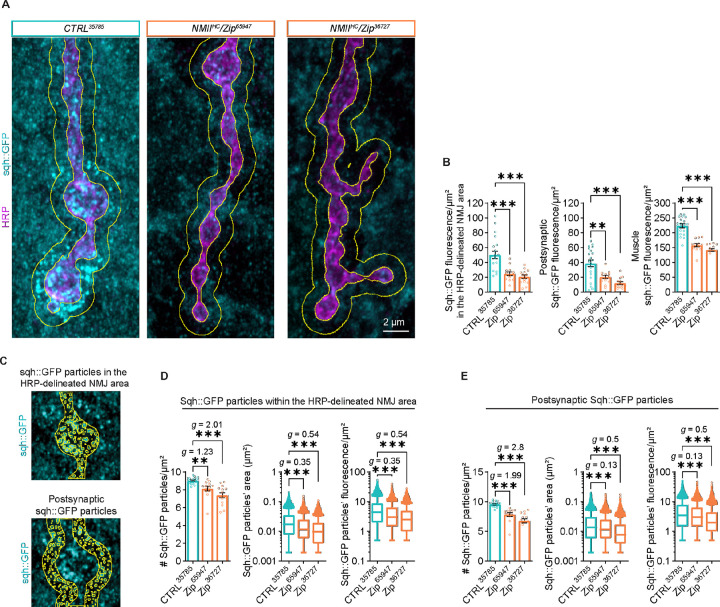
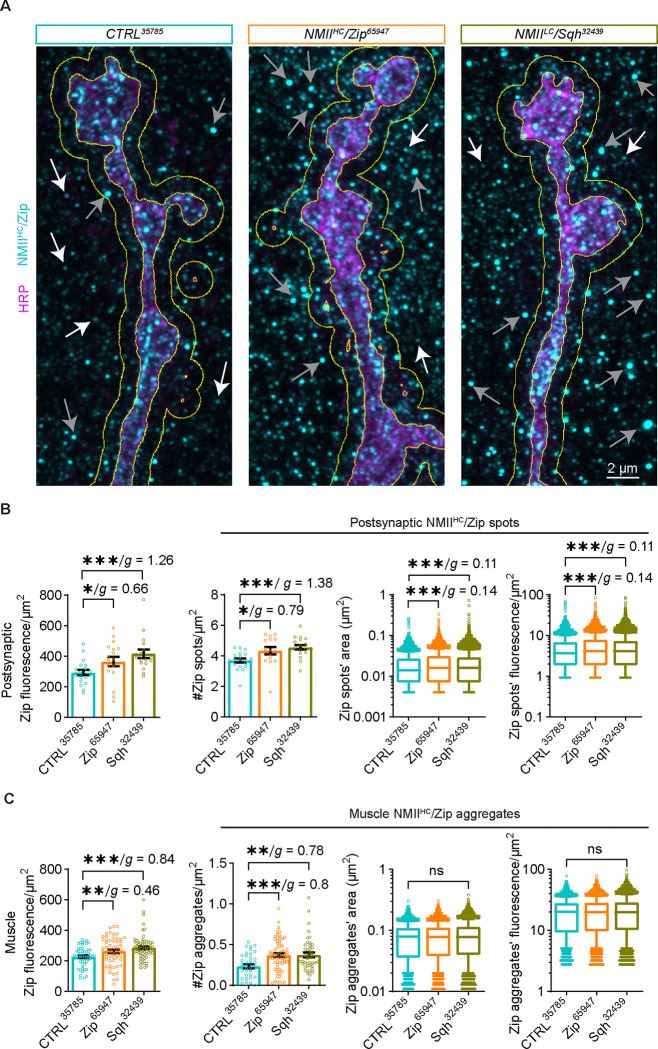
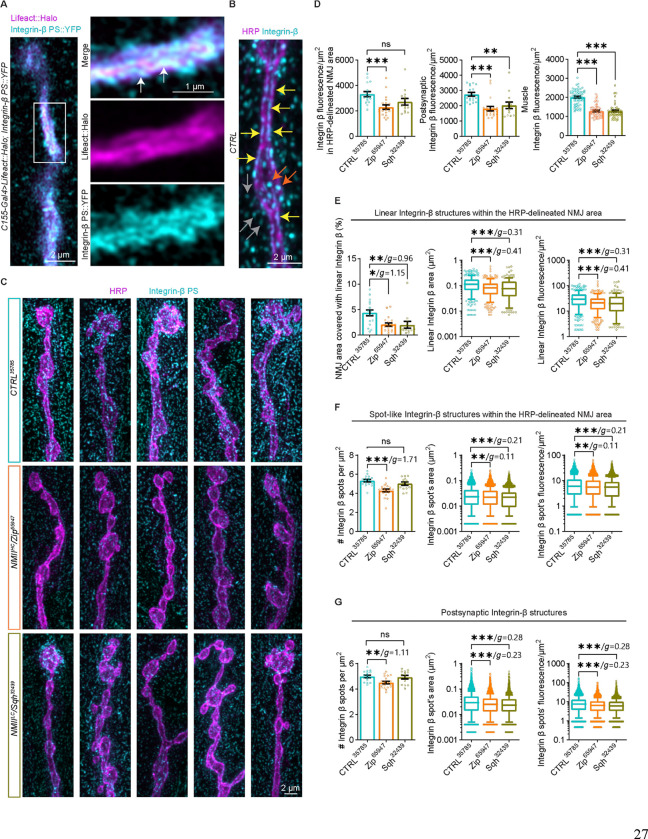
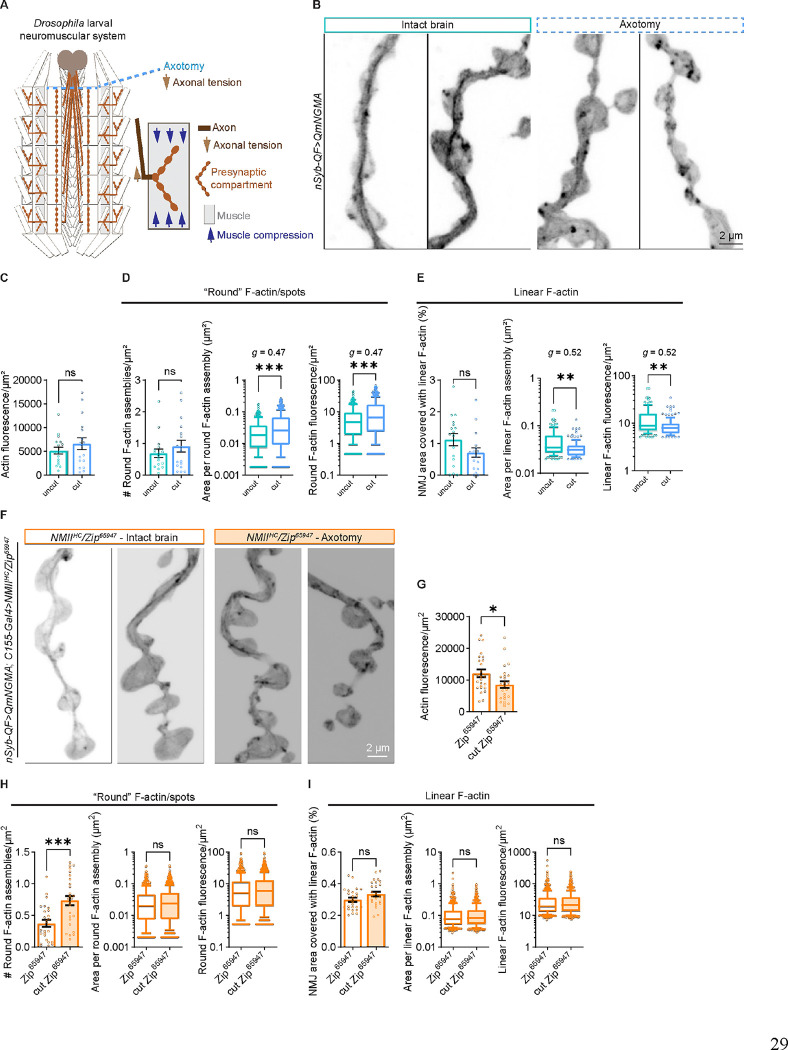
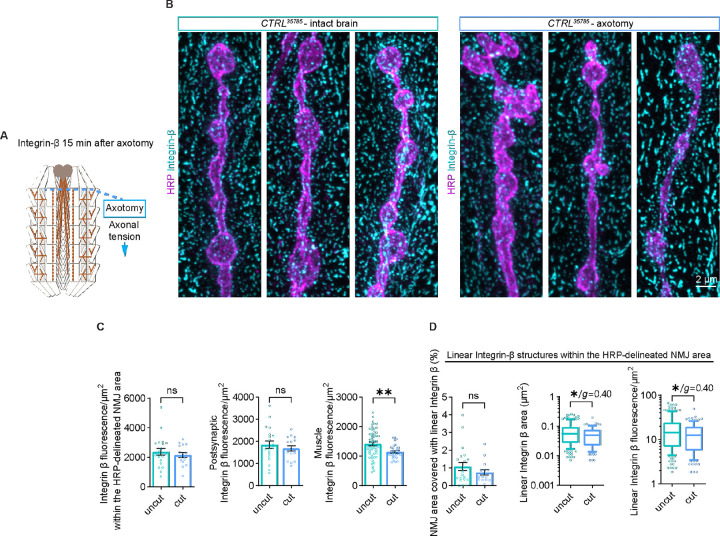
Neuromuscular junctions (NMJs) are evolutionarily ancient, specialized contacts between neurons and muscles. They endure mechanical strain from muscle contractions throughout life, but cellular mechanisms for managing this stress remain unclear. Here we identify a novel actomyosin structure at Drosophila larval NMJs, consisting of a long-lived, low-turnover presynaptic actin core that co-localizes with non-muscle myosin II (NMII). This core is likely to have contractile properties, as manipulating neuronal NMII levels or activity disrupts its organization. Intriguingly, depleting neuronal NMII triggered changes in postsynaptic muscle NMII levels and organization near synapses, suggesting transsynaptic propagation of actomyosin rearrangements. We also found reduced levels of Integrin adhesion receptors both pre- and postsynaptically upon NMII knockdown, indicating disrupted neuron-muscle connections. Mechanical severing of axons caused similar actin core fragmentation and Integrin loss to NMII depletion, suggesting this structure responds to tension. Our findings reveal a presynaptic actomyosin assembly that maintains mechanical continuity between neurons and muscle, possibly facilitating mechanotransduction at the NMJ via Integrin-mediated adhesion.

Keywords: Drosophila; actin cytoskeleton; integrin; mechanobiology; neuromuscular junction; non-muscle myosin II.


Conflict of interest statement

Competing interests: The authors declare no competing interests. J.B. has received ad hoc consultancy compensation for activities with Novartis, Sanofi, CSL Behring, Alnylam, Roche, ARGENX and Amylyx.

Figures

Fig. 1.
Fig. 1.. Presynaptic actin cytoskeleton at the Drosophila larval NMJ.
A) Diagram of the Drosophila larval neuromuscular system as a tissue mechanics model. The NMJ at muscle 4 (gray) was predominantly assessed in this study. The presynaptic compartment (light brown) is subjected to multiple mechanical forces including axonal tension (brown arrow) and compression due to muscle contractions (blue arrows). B) A single frame from live imaging of presynaptic actin assemblies visualized via neuronal expression of the genetically encoded actin marker mNeonGreen-GMA (mNGMA) in larval preparations with intact brains (see also Supp. Movie S1). WEKA segmentation was used to distinguish different actin subpopulations (round (spot-like), and linear, (cable-like or core) F-actin structures) and to facilitate their subsequent quantitative analysis (see also Fig. S1). Orange arrows indicate a linear actin core traversing the NMJ. C) A single frame from live imaging of NMJs expressing an independent genetically encoded actin marker Lifeact::Halo delineates similar spot-like and cable-like (core) actin assemblies. Orange arrows indicate the linear actin core. D) A single frame from live imaging of the Drosophila actin isoform 5C, tagged with the red fluorescent protein mScarlet-I (QAct5C::mScarI), similarly delineates the actin core in addition to round F-actin assemblies. E) Image sequence of FRAP of QAct5C::mScarI-labeled actin core. F) FRAP curve of QAct5C::mScarI (N – NMJs, error bars represent SEM). Scale bars – 5 μm in A, 2 μm in other images. See Table 1 for detailed genotypes.
Fig. 2.
Fig. 2.. Distribution of endogenous and neuronally expressed NMIIHC/Zip at Drosophila larval NMJs.
A) Immunostaining of endogenous NMIIHC/Zip (cyan) at NMJs (HRP, magenta) of wild-type larvae labels large and small puncta at the NMJ and in muscles (yellow arrows – large Zip, white arrows – small Zip structures). Smooth, aggregate-like Zip puncta are visible predominantly in muscles (gray arrows). B) Zip puncta (cyan) in distal axonal bundles (HRP in magenta) in animals neuronally (C155-Gal4) expressing CTRL35785-, NMIIHC/Zip65947 and NMIILC/Sqh32439 RNAi lines. C) Quantification of Zip fluorescence in axonal bundles. D) Live imaging of neuronally co-expressed NMIIHC/Zip::GFP (cyan) and Lifeact::Halo (magenta) similarly reveals Zip puncta with different size at the NMJ, some of which are enriched at spot-like and linear F-actin assemblies (see also Supp. Movie S6). E) Independent examples of live-imaged NMJs of larvae expressing Zip::GFP and Lifeact::Halo. White arrows point to putative bipolar Zip filaments. F) Pearson’s R correlation between Lifeact::Halo and Zip::GFP. G) Quantification of the abundance and size of smaller and larger Zip puncta at the NMJ, as well as the average distance between adjacent Zip puncta in putative bipolar Zip filaments. In bar graphs with linear Y-axis, error bars represent SEM. N in bar graphs – NMJs; N in box and whiskers – individual Zip assemblies. *** p<0.001 upon unpaired, non-parametric Mann-Whitney test. Scale bars – 2 μm. See Tables 1 for detailed genotypes and N.
Fig. 3.
Fig. 3.. Non-muscle Myosin II regulates the integrity of presynaptic actin assemblies.
A) QmNGMA-labeled presynaptic actin in larvae co-expressing CTRL35785- or B) NMIIHC/Zip65947 RNAi (see also Supp. Movies S7–8). Representative NMJs are from independent larvae. C) Quantification of fluorescence per μm2 for the QmNGMA actin marker in whole NMJs. D) Quantifications of the number of round F-actin assemblies per μm2, as well as their area and fluorescence. E) Graphs representing the percentage of NMJ area covered with linear F-actin, as well as the area and fluorescence of the individual assemblies. F-H) Lifeact::Halo-labeled presynaptic F-actin in GFP-expressing control, or larvae expressing unphosphorylatable SqhDN and constitutively phosphorylated SqhCA, respectively. I) Quantification of fluorescence per μm2 for the Lifeact::Halo F-actin marker in whole NMJs. J) Quantifications of the number of round F-actin assemblies per μm2, as well as their area and fluorescence. K) Graphs representing the percentage of NMJ area covered with linear F-actin, as well as the area and fluorescence of the individual assemblies. Box and whiskers graphs were used to represent the results of the area and fluorescence intensity of the individual presynaptic actin structures. Whiskers represent 10th to 90th percentile, while the rest of the data points are shown as individual values. The Y-axis in these graphs represents log10, to capture the broad distribution of the individual values. In bar graphs with linear Y-axis, error bars represent SEM. N in bar graphs – NMJs; N in box and whiskers – individual actin assemblies. ns – not significant, * p<0.05, ** p<0.01, and *** p<0.001 upon unpaired, non-parametric Mann-Whitney test. g – Hedges’ g represents effect size. Scale bars – 2 μm. See Table 1 for detailed genotypes and N.
Fig. 4.
Fig. 4.. Depletion of neuronal NMIIHC reduces the levels of the NMIILC subunit in the muscle.
A) Distribution of Sqh::GFP at NMJs in fixed larvae expressing CTRL35785, Zip65947, and Zip36727 RNAi in neurons (C155-Gal4). Sqh::GFP fluorescence was analyzed within the α-HRP-delineated NMJ area (inner yellow outline) as well as 1 μm outside the neuron in the postsynaptic area (between inner and outer yellow outline). B) Analysis of the Sqh::GFP fluorescence in the HRP-delineated-, postsynaptic-, and muscle ROIs. C) Example of WEKA-segmented individual sqh::GFP particles in the HRP-delineated- and postsynaptic compartments. D) Analysis of the number, area and fluorescence WEKA-segmented sqh::GFP particles within the HRP-delineated NMJ area. E) Analysis of the number, area and fluorescence of postsynaptic WEKA-segmented sqh::GFP particles. Box and whiskers graphs were used to represent the results of the area and fluorescence intensity of the individual Sqh particles. Whiskers represent 10th to 90th percentile, while the rest of the data point are shown as individual values. The Y-axis in these graphs represents log10, to capture the broad distribution of the individual values. In bar graphs with linear Y-axis, error bars represent SEM. N in bar graphs – NMJs and muscle ROIs; N in box and whiskers – individual Sqh particles. ** p<0.01, *** p<0.001 after one-way ANOVA with Šídák’s multiple comparisons test. g – Hedges’ g represents effect size. Scale bar – 2 μm. See Table 1 for detailed genotypes and N.
Fig. 5.
Fig. 5.. Depletion of neuronal NMII induces rearrangements of NMIIHC/Zip pre- and postsynaptically.
A) Endogenous NMIIHC/Zip (cyan) at NMJs (HRP – magenta) in fixed larvae expressing CTRL35785, Zip65947, and Sqh32439 RNAi in neurons (C155-Gal4); white arrows – Zip puncta, gray arrows – Zip aggregate-like puncta. B) Quantification of Zip fluorescence measured between the presynaptic area (masked by the neuronal HRP signal, inner yellow outline) and 1 μm outside the neuron in the postsynaptic area (outer yellow outline), along with analysis of the number, area and fluorescence of WEKA-segmented individual Zip particles in this postsynaptic compartment. N in bar graphs – NMJs; N in box and whiskers – individual Zip assemblies. C) Quantification of Zip fluorescence in different muscle ROIs, along with analysis of the number, area and fluorescence of WEKA-segmented individual Zip aggregate-like structures in muscles. N in bar graphs – NMJs or muscle ROIs; N in box and whiskers – individual Zip particles. Box and whiskers graphs were used to represent the results of the area and fluorescence intensity of the individual Zip particles. Whiskers represent 10th to 90th percentile, while the rest of the data point are shown as individual values. The Y-axis in these graphs represents log10, to capture the broad distribution of the individual values. In bar graphs with linear Y-axis, error bars represent SEM. ** p<0.01, *** p<0.001 after one-way ANOVA with Kruskal-Wallis multiple comparisons test. g – Hedges’ g represents effect size. Scale bar – 2 μm. See Table 1 for detailed genotypes and N.
Fig. 6.
Fig. 6.. Neuronal depletion of non-muscle Myosin II rearranges Integrin receptors at the NMJ.
A) Distribution of YFP-tagged, ubiquitously expressed Integrin-β (cyan) at NMJs in live larvae expressing Lifeact::Halo (magenta) in neurons (see also Supp. Movie S9). White arrows point to areas of overlap between Integrin-β and linear F-actin. B) Immunostaining of Integrin-β (cyan) at NMJs of control larvae. Yellow arrows depict Integrin-β in linear structures, red arrows point to presynaptic spot-like Integrin-β structures, while gray arrows point to postsynaptic spot-like Integrin-β. C) Reorganization of Integrin-β at NMJs of larvae expressing NMIIHC/Zip65947 and NMIILC/Sqh32439 in neurons, compared to controls. D) Integrin-β fluorescence in the HRP-delineated-, postsynaptic-, and muscle ROIs. E) Quantifications of the abundance, size and fluorescence of WEKA-segmented linear Integrin-β structures within the HRP-delineated area. F) Analysis of the number, size and fluorescence of WEKA-segmented Integrin-β foci within the HRP-delineated area. G) Analysis of the number, size and fluorescence of WEKA-segmented postsynaptic Integrin-β foci. Box and whiskers graphs were used to represent the results of the area and fluorescence intensity of the individual Integrin-β particles. Whiskers represent 10th to 90th percentile, while the rest of the data points are shown as individual values. The Y-axis in these graphs represents log10, to capture the broad distribution of the individual values. In bar graphs with linear Y-axis, error bars represent SEM. N in bar graphs – NMJs or muscle ROIs; N in box and whiskers – individual Integrin-β assemblies. Ns – non-significant, * p<0.05, ** p<0.01, and *** p<0.001 after one-way ANOVA with Kruskal-Wallis multiple comparisons test. g – Hedges’ g represents effect size. Scale bars – 2 μm, inset in A) with scale bar – 1 μm. See Table 1 for detailed genotypes and N.
Fig. 7.
Fig. 7.. Mechanical severing of larval axons induces changes in presynaptic F-actin.
A) Diagram of Drosophila fillet preparation upon axotomy (light blue dashed line) of all proximal neurons descending from the larval brain. This procedure removes the axonal tension exerted at presynaptic compartments. B) mNGMA-labeled presynaptic actin at NMJs from live larvae with intact brains (left) or upon severing of the brain/axotomy (right) (see also Supp. Movies S10–11). C) Quantification of the fluorescence per μm2 for the QmNGMA actin marker in whole NMJs. D) Quantifications of the number of round F-actin assemblies per μm2, as well as the area and fluorescence of the individual round presynaptic actin structures. E) Graphs representing the percentage of NMJ area covered with linear F-actin, as well as the area and fluorescence of the individual assemblies. F) mNGMA-labeled presynaptic actin at NMJs from live NMIIHC/Zip65947 larvae with intact brains (left) or upon severing of the brain/axotomy (right). G-I) Analyses of the mNGMA fluorescence, as well as round and linear F-actin assemblies. Box and whiskers graphs were used to represent the results of the area and fluorescence intensity of the individual presynaptic actin structures. Whiskers represent 10th to 90th percentile, while the rest of the data points are shown as individual values. The Y-axis in these graphs represents log10, to capture the broad distribution of the individual values. In bar graphs with linear Y-axis, error bars represent SEM. N in bar graphs – NMJs; N in box and whiskers – individual actin assemblies. ns – not significant, ** p<0.01, and *** p<0.001 upon unpaired, non-parametric Mann-Whitney test. Error bars represent SEM. g – Hedges’ g represents effect size. Scale bar – 2 μm. See Table 1 for detailed genotypes and N.
Fig. 8.
Fig. 8.. Integrin receptors rearrange within 15 minutes of mechanical severing of larval axons.
A) Diagrams of Drosophila fillet preparation upon axotomy (left, light blue dashed line), a procedure that should decrease the axonal tension exerted at presynaptic compartments. B) Immunostaining of Integrin-β (cyan) at NMJs of control larvae (C155-Gal4>CTRL35785) after 15 minutes with uncut and cut axons. C) Integrin-β fluorescence in the HRP-delineated-, postsynaptic-, and muscle ROIs. D) Quantifications of the abundance, size and fluorescence of WEKA-segmented Integrin-β structures’ along linear areas. Box and whiskers graphs were used to represent the results of the area and fluorescence intensity of the individual Integrin-β particles. Whiskers represent 10th to 90th percentile, while the rest of the data points are shown as individual values. The Y-axis in these graphs represents log10, to capture the broad distribution of the individual values. In bar graphs with linear Y-axis, error bars represent SEM. N in bar graphs – NMJs or muscle ROIs; N in box and whiskers – individual Integrin-β assemblies. Ns – non-significant, * p<0.05, ** p<0.01, and *** p<0.001 after one-way ANOVA with Kruskal-Wallis multiple comparisons test. g – Hedges’ g represents effect size. Scale bars – 2 μm. See Table 1 for detailed genotypes and N.

Similar articles

References

    1. Abouelezz A., Stefen H., Segerstråle M., Micinski D., Minkeviciene R., Lahti L., Hardeman E.C., Gunning P.W., Hoogenraad C.C., Taira T., Fath T., and Hotulainen P.. 2020. Tropomyosin Tpm3.1 Is Required to Maintain the Structure and Function of the Axon Initial Segment. iScience. 23:101053. - PMC - PubMed
    1. Akamatsu M., Vasan R., Serwas D., Ferrin M.A., Rangamani P., and Drubin D.G.. 2020. Principles of self-organization and load adaptation by the actin cytoskeleton during clathrin-mediated endocytosis. eLife. 9:e49840. - PMC - PubMed
    1. Alioto S.L., Garabedian M.V., Bellavance D.R., and Goode B.L.. 2016. Tropomyosin and Profilin Cooperate to Promote Formin-Mediated Actin Nucleation and Drive Yeast Actin Cable Assembly. Curr Biol. 26:3230–3237. - PMC - PubMed
    1. Arganda-Carreras I., Kaynig V., Rueden C., Eliceiri K.W., Schindelin J., Cardona A., and Sebastian Seung H.. 2017. Trainable Weka Segmentation: a machine learning tool for microscopy pixel classification. Bioinformatics. 33:2424–2426. - PubMed
    1. Ataman B., Ashley J., Gorczyca M., Ramachandran P., Fouquet W., Sigrist S.J., and Budnik V.. 2008. Rapid activity-dependent modifications in synaptic structure and function require bidirectional Wnt signaling. Neuron. 57:705–718. - PMC - PubMed

Publication types