[Preprint]. 2023 Nov 13:2023.11.09.566503.
doi: 10.1101/2023.11.09.566503.

Single cell spatial transcriptomic profiling of childhood-onset lupus nephritis reveals complex interactions between kidney stroma and infiltrating immune cells

Affiliations

Single cell spatial transcriptomic profiling of childhood-onset lupus nephritis reveals complex interactions between kidney stroma and infiltrating immune cells

Patrick Danaher et al. bioRxiv. .

Update in

Abstract

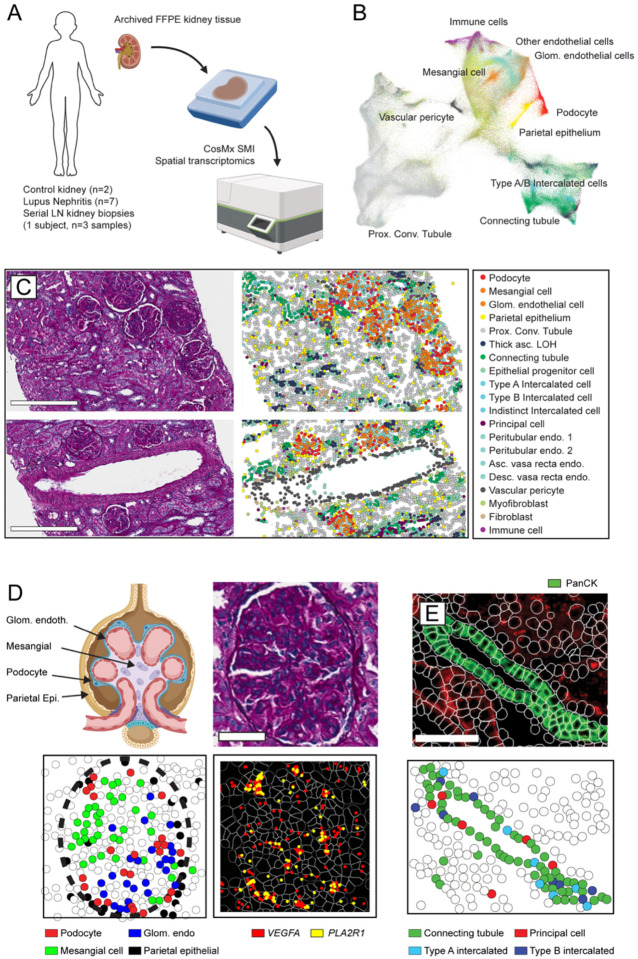
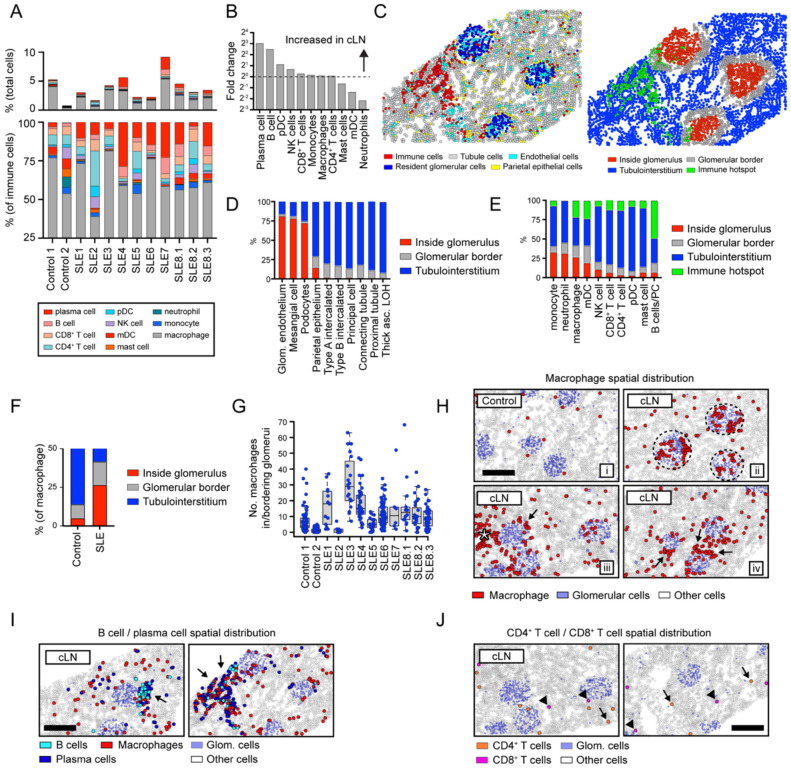
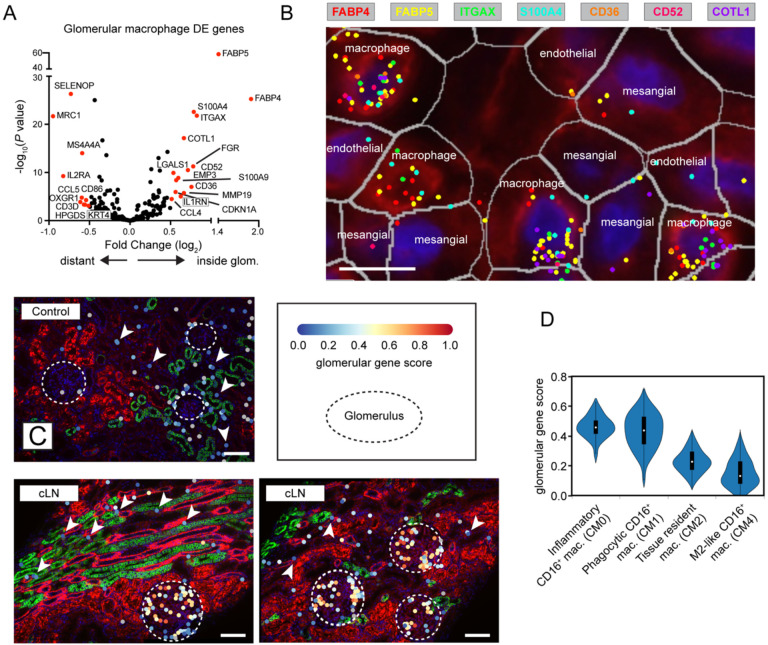
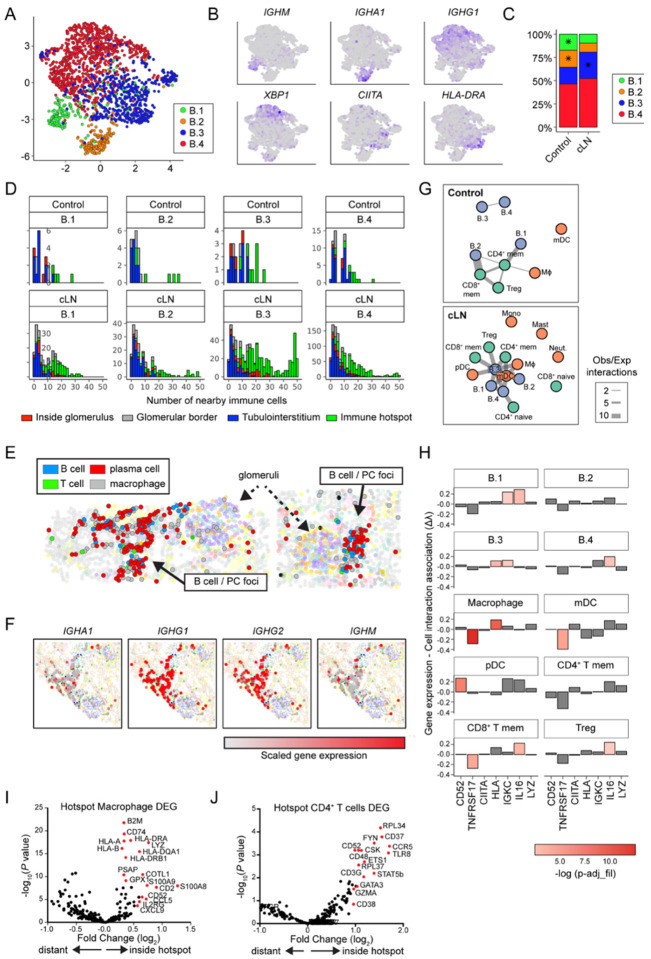
Children with systemic lupus erythematosus (SLE) are at increased risk of developing kidney disease, termed childhood-onset lupus nephritis (cLN). Single cell transcriptomics of dissociated kidney tissue has advanced our understanding of LN pathogenesis, but loss of spatial resolution prevents interrogation of in situ cellular interactions. Using a technical advance in spatial transcriptomics, we generated a spatially resolved, single cell resolution atlas of kidney tissue (>400,000 cells) from eight cLN patients and two controls. Annotated cells were assigned to 35 reference cell types, including major kidney subsets and infiltrating immune cells. Analysis of spatial distribution demonstrated that individual immune lineages localize to specific regions in cLN kidneys, including myeloid cells trafficking to inflamed glomeruli and B cells clustering within tubulointerstitial immune hotspots. Notably, gene expression varied as a function of tissue location, demonstrating how incorporation of spatial data can provide new insights into the immunopathogenesis of SLE. Alterations in immune phenotypes were accompanied by parallel changes in gene expression by resident kidney stromal cells. However, there was little correlation between histologic scoring of cLN disease activity and glomerular cell transcriptional signatures at the level of individual glomeruli. Finally, we identified modules of spatially-correlated gene expression with predicted roles in induction of inflammation and the development of tubulointerstitial fibrosis. In summary, single cell spatial transcriptomics allows unprecedented insights into the molecular heterogeneity of cLN, paving the way towards more targeted and personalized treatment approaches.


Conflict of interest statement

The authors declare the following competing interests. P.D. is an employee and shareholder of NanoString Technologies, Inc. and has filed a provisional patent covering the algorithm for spatial correlation analyses described in this manuscript. N.H. no disclosures. E.D.N: no disclosures. K.H. received an unrestricted educational grant from Pfizer Global medical grants to support a quality improvement program for patients with juvenile idiopathic arthritis (JIA) which was unrelated to the current study. N.R.: no disclosures. C.E.A.: no disclosures. R.C.R: no disclosures. D.M.O. is a consultant for a Horizon Therapeutics Advisory Board. S.K.B. is an employee and shareholder of Sanofi. S.W.J. is a consultant for Bristol-Myers Squib and previously served as a consultant for Variant Bio and ChemoCentryx, Inc.

Figures

Figure 1:
Figure 1:. Single cell-resolution spatial transcriptomics in childhood-onset lupus nephritis (cLN).
(A) Archived kidney biopsy tissue stored in FFPE was profiled using the CosMX Spatial Molecular Imager to obtain single cell-resolution spatial transcriptomic data from 2 healthy controls, 7 subjects with cLN, and 1 subject with treatment-resistant cLN across 3 serial biopsies. (B) UMAP projection of kidney and immune cell subsets in combined CosMX dataset. (C) Tissue sections from representative cLN subject (SLE6) showing Periodic acid–Schiff (PAS)-stained tissue sections (left) compared to equivalent cell types annotated using spatial transcriptomics. Scale bars, 300μm. (D) Upper left: schematic of the human glomerulus showing distribution of relevant cell types. PAS-stained histology (upper right) vs. transcriptionally-defined glomerular cell types (lower left) in single glomerulus from representative cLN patient. Lower right: Expression of podocyte-specific genes (VEGFA, red; PLA2R1, yellow) overlaps with spatial location of podocytes. Scale bars, 50μm. (E) Corresponding images showing panCK+ regions (upper panel, green) overlapping with transcriptionally-defined Connecting Tubule cells (green), Type A Intercalated cells (light blue), Type B Intercalated cells (dark blue), and Principal cells (red). Scale bars, 100μm.
Figure 2:
Figure 2:. Immune landscape of cLN.
(A) Immune cell landscape in controls vs. cLN. Upper panel: immune cell infiltrates as % of total cells. Lower panel: relative proportions of immune cell subsets. (B) Ratio of immune cell subset percentages in cLN vs controls. (C) Corresponding images showing major kidney cell types (left) and computationally-defined anatomical regions (right). Each dot indicates an individual cell colored by cell type (left) or spatial location (right). (D, E) Proportion of kidney stromal cells (D) and infiltrating immune cells (E) located within the 4 spatial kidney regions. (F) Proportion of macrophages located inside (red) or bordering (grey) glomeruli in controls vs. cLN. (G) Total number of macrophages in/bordering glomeruli in individual control and cLN subjects. Each dot equals macrophage number per glomerulus. Boxes show interquartile ranges over each tissue’s glomeruli. (H) Representative patterns of macrophage spatial distributions: i) macrophages (red) diffusely distributed in tubulointerstitium in control kidney; ii) cLN macrophages trafficking to glomeruli (dashed circle) in cLN; iii/iv) macrophages surrounding glomeruli (arrows) or clustered within tubulointerstitial immune hotspot (star) in cLN. (I) B cells (light blue) and plasma cells (dark blue) colocalize within tubulointerstitial immune hotspots (arrows) in cLN. Macrophages (red) are also enriched within B cell/plasma cell foci. (J) Spatial distribution of CD4+ T cells (orange; arrows) and CD8+ T cells (pink; arrowheads) in cLN. (H-J) Scale bars, 200μm.
Figure 3:
Figure 3:. Spatially resolved gene expression in cLN macrophages.
(A) Volcano plot showing DEG in cLN macrophages residing inside vs. outside glomeruli. (B) Expression of representative “glomerulus specific” genes by macrophages residing adjacent to mesangial cells and glomerular endothelial cells in cLN. Scale bars, 10μm. (C) Representative images showing increased “glomerular gene score” expression by macrophages residing within cLN glomeruli (dashed circle) vs. tubulointerstitial macrophages (arrowheads). Each dot represents a macrophage colored by metagene expression. Upper panel: representative control sample (Control1). Lower panels: representative cLN (SLE3). Scale bars, 100μm. Image generated using BioTuring Lens. (D) Reanalysis of AMP LN dataset (5) showing “glomerular gene score” expression by myeloid subpopulations in adult LN.
Figure 4:
Figure 4:. Gene expression and cell interaction patterns within immune hotspots
(A) UMAP projection of B cell lineage subclusters B.1 – B.4. (B) Heatmap of gene expression in B cell subclusters. (C) Distribution of B cell subclusters in control and cLN. *P<0.05, by chi-squared test. (D) Histograms depicting number of the 50 closest cells to each B cell subset that are immune cells (color coded by B cell location and divided by disease status and B cell subcluster). (E) Clusters (solid arrows) of B cells, plasma cells, macrophages, and rare CD4+ T cells located with tubulointerstitium of representative cLN kidney. Dashed arrows indicate glomeruli. (F) Immunoglobulin gene transcripts (red=scaled gene expression) in cLN plasma cell foci. (G) Graphs of interactions between immune cell types that occur more frequently than would be expected by chance, as modelled by a hypergeometric distribution. Cells are colored by lineage and edge thickness is proportional to the ratio of observed:expected number of interactions across all patients. (H) Bar chart depicting the relationship between B.3 cell gene (or gene set) expression and the number of interacting cells. Height of the bar is the Poisson regression estimate of that gene (or set of genes). (I, J) Volcano plots showing DEG in cLN macrophages (I) and CD4+ T cells (J) residing inside vs. outside “immune hotspots”.
Figure 5:
Figure 5:. Rituximab-resistant B cell foci in treatment-resistant cLN.
(A) Diagram depicting immunosuppressive therapies and timing of serial kidney biopsies in subject SLE8. Stars indicate individual doses of rituximab (1000mg, red), IV methylprednisolone (500mg, yellow), and cyclophosphamide (900–1200mg, blue). Bars indicate duration of oral medication use. (B, C) Trajectory of clinical biomarkers of cLN disease activity (B) and circulating CD19+ B cell numbers (C) in SLE8. Each dot indicates an individual laboratory value. Stars indicate values above/below the limit of detection. Dashed lines indicate normal range for clinical assay. (D) Intrarenal B cells (black circle) and plasma cells (open circle), as percentage of total kidney cells, in 3 serial biopsies from subject SLE8. Grey bars indicate % B cells/plasma cells in control kidney. (E) Representative image showing persistent tubulointersitial foci of B cells (orange) and plasma cells (blue) in sample SLE8.1 (obtained prior to rituximab treatment) and sample SLE8.3 (post-rituximab in the setting of circulating B cell depletion). Scale bars, 200μm.
Figure 6:
Figure 6:. Lupus nephritis is characterized by altered gene expression in resident glomerular cells.
(A) Mesangial:podocyte ratio in control vs. cLN. * P<0.05, by two-tailed Mann-Whitney test. (B) Representative images showing mesangial cells (purple) and podocytes (yellow) in control (Control1, Control2) and cLN (SLE3, SLE6) kidney tissues. Morphology markers: B2M/CD298, red; PanCK, green. Scale bars, 200μm. (C) Volcano plots showing differentially expressed genes (DEG) in glomerular endothelial cells (left), mesangial cells (middle), and podocytes (right).
Figure 7:
Figure 7:. Correlation between glomerular gene expression and tissue histopathology
(A) Concatenated glomerular cell gene expression was analyzed based on morphologic scoring of individual glomeruli. (B-E) UMAP projections of individual glomeruli colored by patient ID (B), LN Class (C), pre-treatment urine protein:creatinine ratio (uPCR) (D), and lupus-defining histopathology (E). Each dot indicates an individual glomerulus.
Figure 8:
Figure 8:. Spatially correlated gene modules in cLN
(A) Network connecting spatially correlated gene pairs. Node color shows clusters of mutually correlated genes. (B) Spatial correlation network for interferon stimulated gene (ISG) module. (C) ISG module activity in representative kidney tissue from healthy control (left) and cLN (right). Scale bars, 100μm. (D) Spatial correlation network for two macrophage-associated modules (“Class II HLA cluster”, red; “Compliment cluster”, blue). (E) Neighborhood-level activity of each macrophage module across all analyzed cells (colored by sample ID). (F) Heatmap showing corresponding “HLA cluster” (upper left), “Compliment cluster” (lower left), and cell type annotation image highlighting macrophage location (red dots) from representative cLN subject. Scale bars, 100μm. (G) Spatial correlation network for fibrosis module. (H) Heatmap showing expression of individual fibrosis module genes by kidney cell type. (I) Representative cLN tissues sections (SLE6) showing corresponding cell type annotations (left), fibrosis module expression (middle), and Periodic acid–Schiff (PAS)-stained tissue sections (right). Upper panels show fibrosis module expression overlapping with glomeruli and arteriole surrounded by vascular pericytes. Lower panels highlight tubulointerstitial fibrosis module expression within an anatomical region enriched for fibroblasts (dashed line). Scale bars, 100μm.

Similar articles

References

    1. Kaneko M., Jackson S. W., Recent advances in immunotherapies for lupus nephritis. Pediatr Nephrol, (2022). - PMC - PubMed
    1. Furie R., Rovin B. H., Houssiau F., Malvar A., Teng Y. K. O., Contreras G., Amoura Z., Yu X., Mok C. C., Santiago M. B., Saxena A., Green Y., Ji B., Kleoudis C., Burriss S. W., Barnett C., Roth D. A., Two-Year, Randomized, Controlled Trial of Belimumab in Lupus Nephritis. N Engl J Med 383, 1117–1128 (2020). - PubMed
    1. Rovin B. H., Solomons N., Pendergraft W. F. 3rd, Dooley M. A., Tumlin J., Romero-Diaz J., Lysenko L., Navarra S. V., Huizinga R. B., Group A.-L. S., A randomized, controlled double-blind study comparing the efficacy and safety of dose-ranging voclosporin with placebo in achieving remission in patients with active lupus nephritis. Kidney Int 95, 219–231 (2019). - PubMed
    1. Rovin B. H., Teng Y. K. O., Ginzler E. M., Arriens C., Caster D. J., Romero-Diaz J., Gibson K., Kaplan J., Lisk L., Navarra S., Parikh S. V., Randhawa S., Solomons N., Huizinga R. B., Efficacy and safety of voclosporin versus placebo for lupus nephritis (AURORA 1): a double-blind, randomised, multicentre, placebo-controlled, phase 3 trial. Lancet 397, 2070–2080 (2021). - PubMed
    1. Arazi A., Rao D. A., Berthier C. C., Davidson A., Liu Y., Hoover P. J., Chicoine A., Eisenhaure T. M., Jonsson A. H., Li S., Lieb D. J., Zhang F., Slowikowski K., Browne E. P., Noma A., Sutherby D., Steelman S., Smilek D. E., Tosta P., Apruzzese W., Massarotti E., Dall’Era M., Park M., Kamen D. L., Furie R. A., Payan-Schober F., Pendergraft W. F. 3rd, McInnis E. A., Buyon J. P., Petri M. A., Putterman C., Kalunian K. C., Woodle E. S., Lederer J. A., Hildeman D. A., Nusbaum C., Raychaudhuri S., Kretzler M., Anolik J. H., Brenner M. B., Wofsy D., Hacohen N., Diamond B., n. S. L. E. Accelerating Medicines Partnership in, The immune cell landscape in kidneys of patients with lupus nephritis. Nat Immunol 20, 902–914 (2019). - PMC - PubMed

Publication types