

This is a preprint.
Networks extracted from nonlinear fMRI connectivity exhibit unique spatial variation and enhanced sensitivity to differences between individuals with schizophrenia and controls
- PMID: 38014169
- PMCID: PMC10680735
- DOI: 10.1101/2023.11.16.566292
Networks extracted from nonlinear fMRI connectivity exhibit unique spatial variation and enhanced sensitivity to differences between individuals with schizophrenia and controls
Update in
-
Networks extracted from nonlinear fMRI connectivity exhibit unique spatial variation and enhanced sensitivity to differences between individuals with schizophrenia and controls.Nat Ment Health. 2024;2(12):1464-1475. doi: 10.1038/s44220-024-00341-y. Epub 2024 Nov 21. Nat Ment Health. 2024. PMID: 39650801 Free PMC article.
Abstract
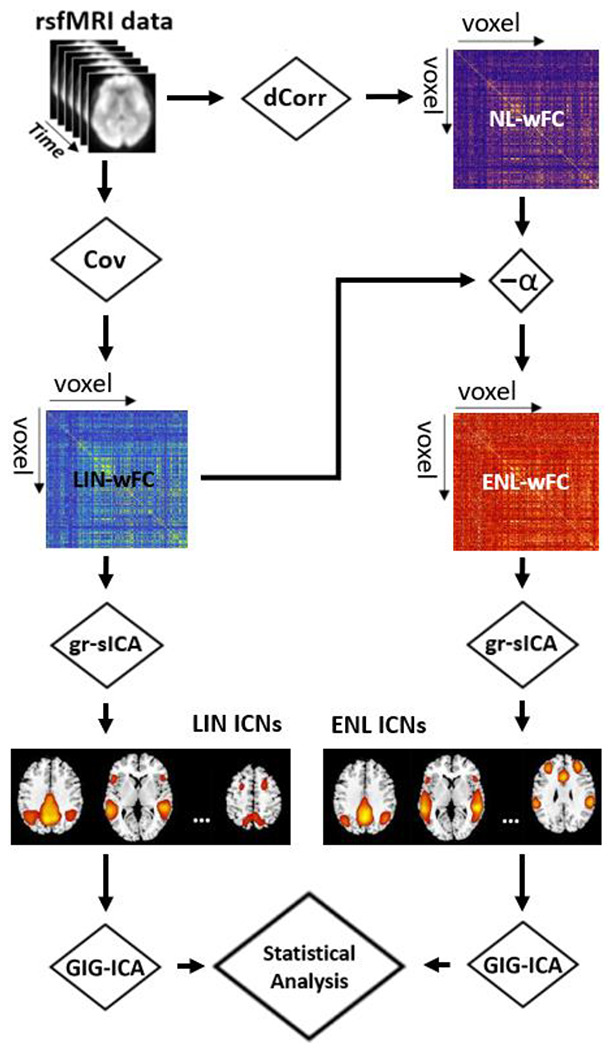
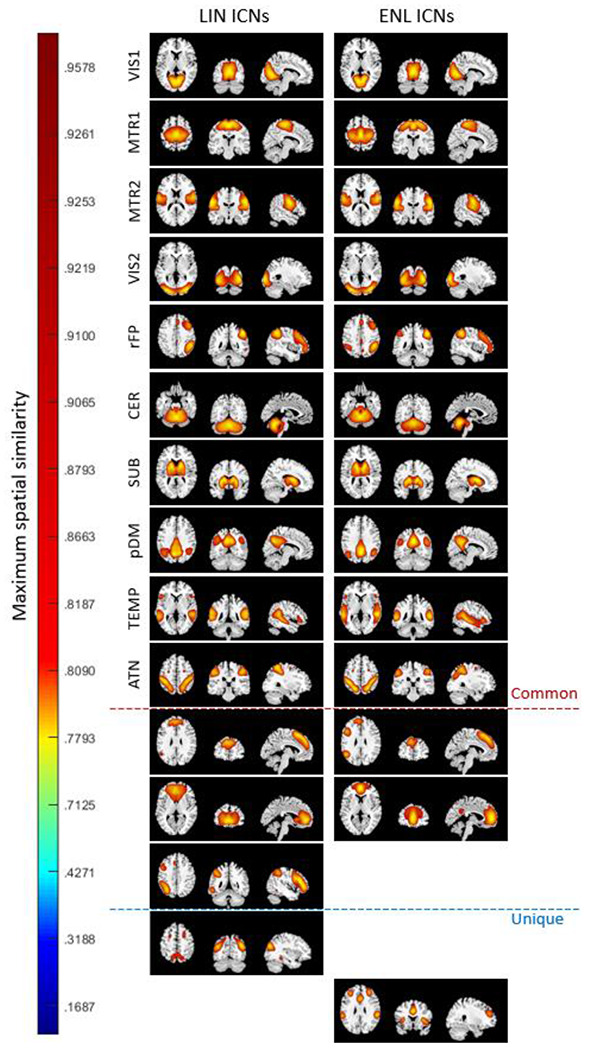
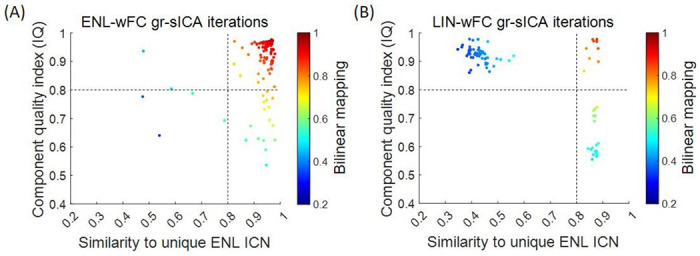
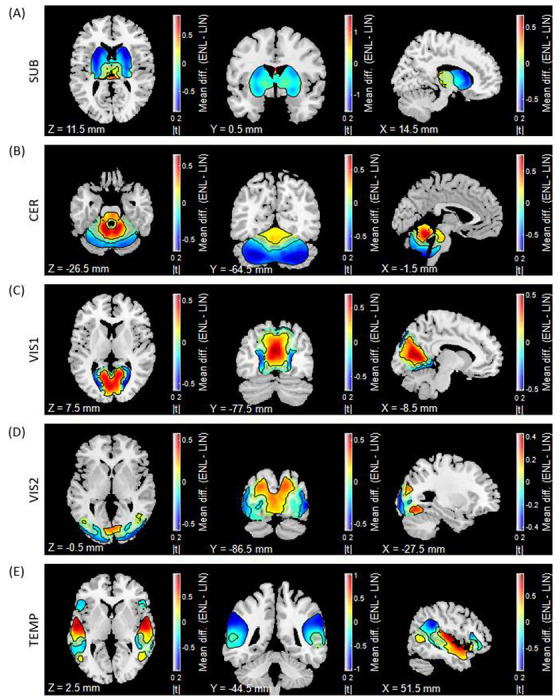
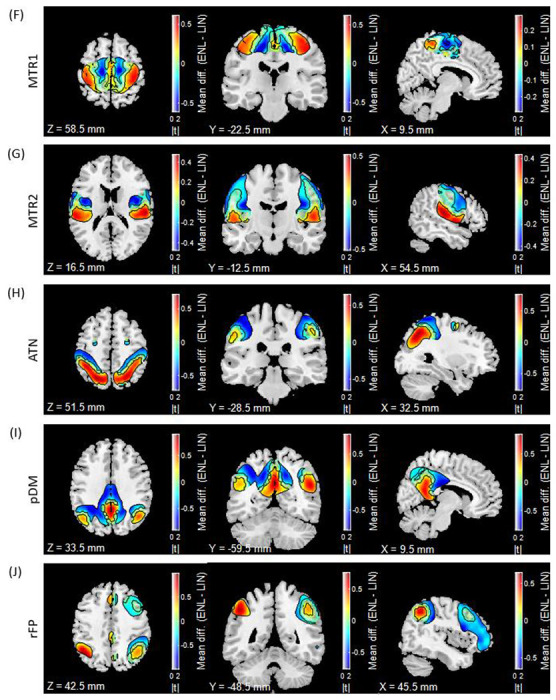
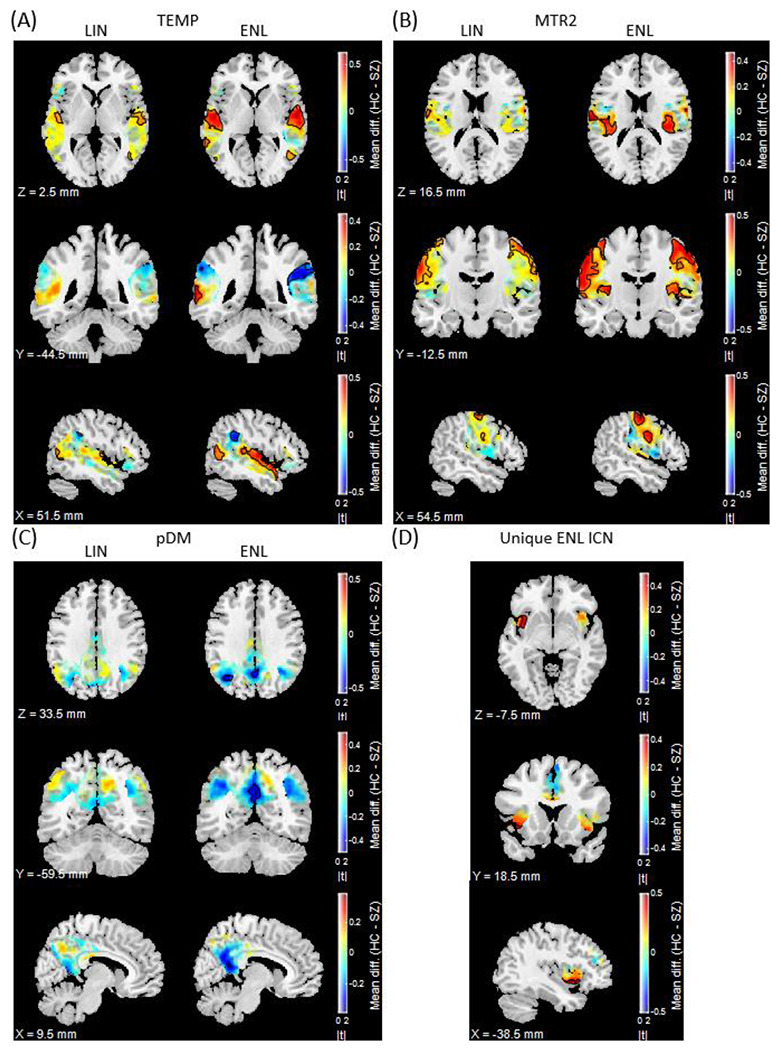
Functional magnetic resonance imaging (fMRI) studies often estimate brain intrinsic connectivity networks (ICNs) from temporal relationships between hemodynamic signals using approaches such as independent component analysis (ICA). While ICNs are thought to represent functional sources that play important roles in various psychological phenomena, current approaches have been tailored to identify ICNs that mainly reflect linear statistical relationships. However, the elements comprising neural systems often exhibit remarkably complex nonlinear interactions that may be involved in cognitive operations and altered in psychiatric conditions such as schizophrenia. Consequently, there is a need to develop methods capable of effectively capturing ICNs from measures that are sensitive to nonlinear relationships. Here, we advance a novel approach to estimate ICNs from explicitly nonlinear whole-brain functional connectivity (ENL-wFC) by transforming resting-state fMRI (rsfMRI) data into the connectivity domain, allowing us to capture unique information from distance correlation patterns that would be missed by linear whole-brain functional connectivity (LIN-wFC) analysis. Our findings provide evidence that ICNs commonly extracted from linear (LIN) relationships are also reflected in explicitly nonlinear (ENL) connectivity patterns. ENL ICN estimates exhibit higher reliability and stability, highlighting our approach's ability to effectively quantify ICNs from rsfMRI data. Additionally, we observed a consistent spatial gradient pattern between LIN and ENL ICNs with higher ENL weight in core ICN regions, suggesting that ICN function may be subserved by nonlinear processes concentrated within network centers. We also found that a uniquely identified ENL ICN distinguished individuals with schizophrenia from healthy controls while a uniquely identified LIN ICN did not, emphasizing the valuable complementary information that can be gained by incorporating measures that are sensitive to nonlinearity in future analyses. Moreover, the ENL estimates of ICNs associated with auditory, linguistic, sensorimotor, and self-referential processes exhibit heightened sensitivity towards differentiating between individuals with schizophrenia and controls compared to LIN counterparts, demonstrating the translational value of our approach and of the ENL estimates of ICNs that are frequently reported as disrupted in schizophrenia. In summary, our findings underscore the tremendous potential of connectivity domain ICA and nonlinear information in resolving complex brain phenomena and revolutionizing the landscape of clinical FC analysis.
Keywords: distance correlation; functional connectivity (FC); independent component analysis (ICA); intrinsic connectivity network (ICN); nonlinear; schizophrenia (SZ).
Figures
Similar articles
-
Toward Granular Brain Intrinsic Connectivity Networks and Insights into Schizophrenia.bioRxiv [Preprint]. 2025 Jun 11:2025.06.11.659084. doi: 10.1101/2025.06.11.659084. bioRxiv. 2025. PMID: 40661581 Free PMC article. Preprint.
-
Prescription of Controlled Substances: Benefits and Risks.2025 Jul 6. In: StatPearls [Internet]. Treasure Island (FL): StatPearls Publishing; 2025 Jan–. 2025 Jul 6. In: StatPearls [Internet]. Treasure Island (FL): StatPearls Publishing; 2025 Jan–. PMID: 30726003 Free Books & Documents.
-
A Method for Estimating Dynamic Functional Network Connectivity Gradients (dFNGs) From ICA Captures Smooth Inter-Network Modulation.Hum Brain Mapp. 2025 Jul;46(10):e70262. doi: 10.1002/hbm.70262. Hum Brain Mapp. 2025. PMID: 40626410 Free PMC article.
-
The Black Book of Psychotropic Dosing and Monitoring.Psychopharmacol Bull. 2024 Jul 8;54(3):8-59. Psychopharmacol Bull. 2024. PMID: 38993656 Free PMC article. Review.
-
Magnetic resonance perfusion for differentiating low-grade from high-grade gliomas at first presentation.Cochrane Database Syst Rev. 2018 Jan 22;1(1):CD011551. doi: 10.1002/14651858.CD011551.pub2. Cochrane Database Syst Rev. 2018. PMID: 29357120 Free PMC article.
References
-
- Adali T., Anderson M., & Fu G. S. (2014). Diversity in independent component and vector analyses: Identifiability, algorithms, and applications in medical imaging. IEEE Signal Processing Magazine 31(3), 18–33.
-
- Adhikari B. M., Hong L. E., Sampath H., Chiappelli J., Jahanshad N., Thompson P. M., Rowland L. M., Calhoun V. D., Du X., Chen S., & Kochunov P. (2019). Functional network connectivity impairments and core cognitive deficits in schizophrenia. Human brain mapping, 40(16), 4593–4605. 10.1002/hbm.24723 - DOI - PMC - PubMed
-
- Aine C. J., Bockholt H. J., Bustillo J. R., Cañive J. M., Caprihan A., Gasparovic C., Hanlon F. M., Houck J. M., Jung R. E., Lauriello J., Liu J., Mayer A. R., Perrone-Bizzozero N. I., Posse S., Stephen J. M., Turner J. A., Clark V. P., & Calhoun V. D. (2017). Multimodal Neuroimaging in Schizophrenia: Description and Dissemination. Neuroinformatics, 15(4), 343–364. 10.1007/s12021-017-9338-9 - DOI - PMC - PubMed
Publication types
Grants and funding
LinkOut - more resources
Full Text Sources
Miscellaneous