[Preprint]. 2023 Nov 15:2023.11.13.566870.
doi: 10.1101/2023.11.13.566870.

Loss of cis-PTase function in the liver promotes a highly penetrant form of fatty liver disease that rapidly transitions to hepatocellular carcinoma

Affiliations

Loss of cis-PTase function in the liver promotes a highly penetrant form of fatty liver disease that rapidly transitions to hepatocellular carcinoma

Abhishek K Singh et al. bioRxiv. .

Abstract

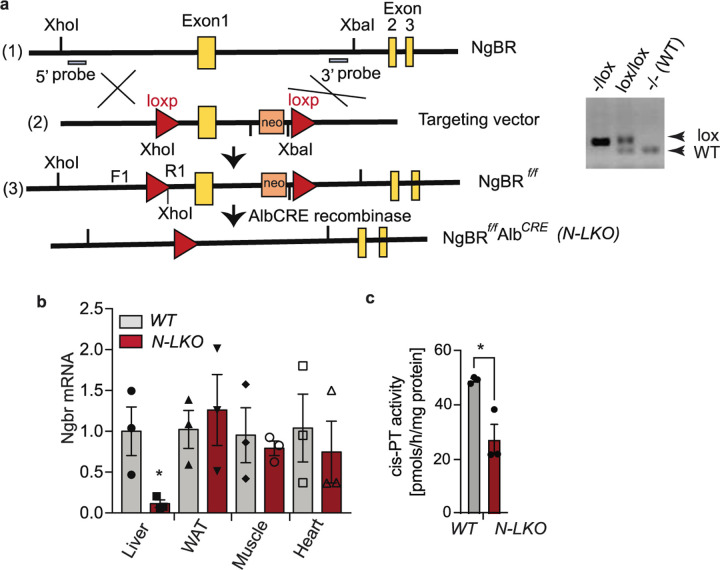
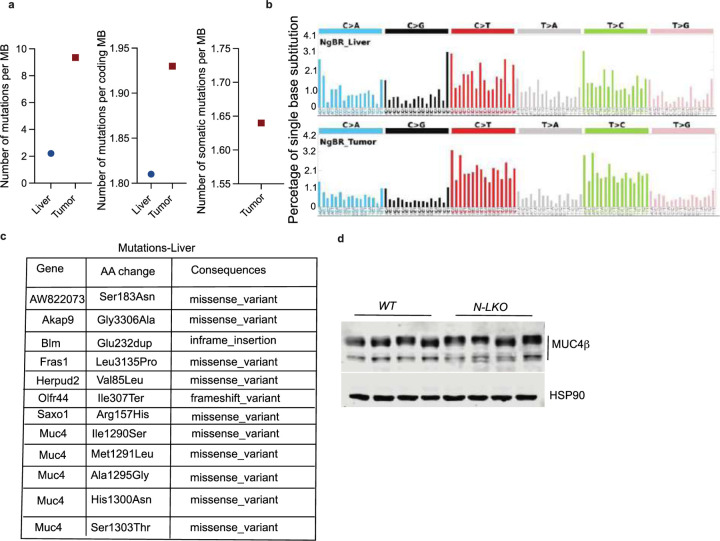
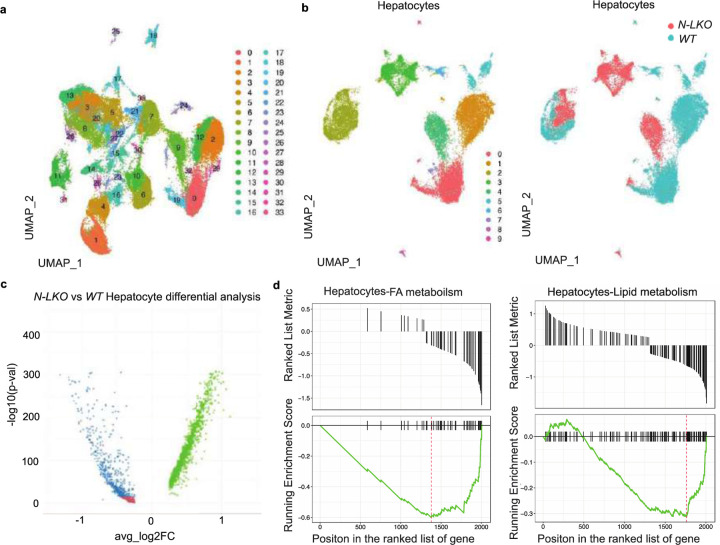
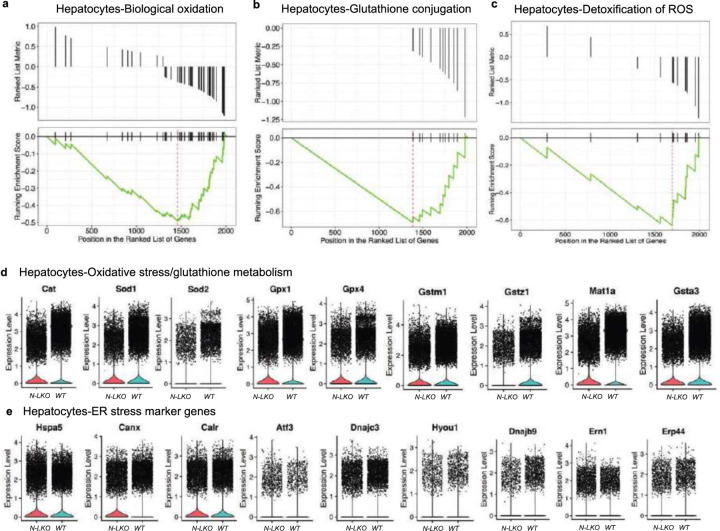
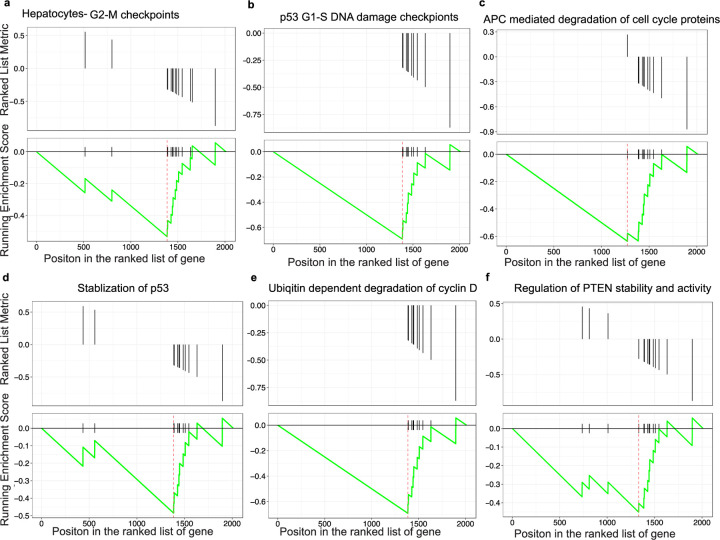
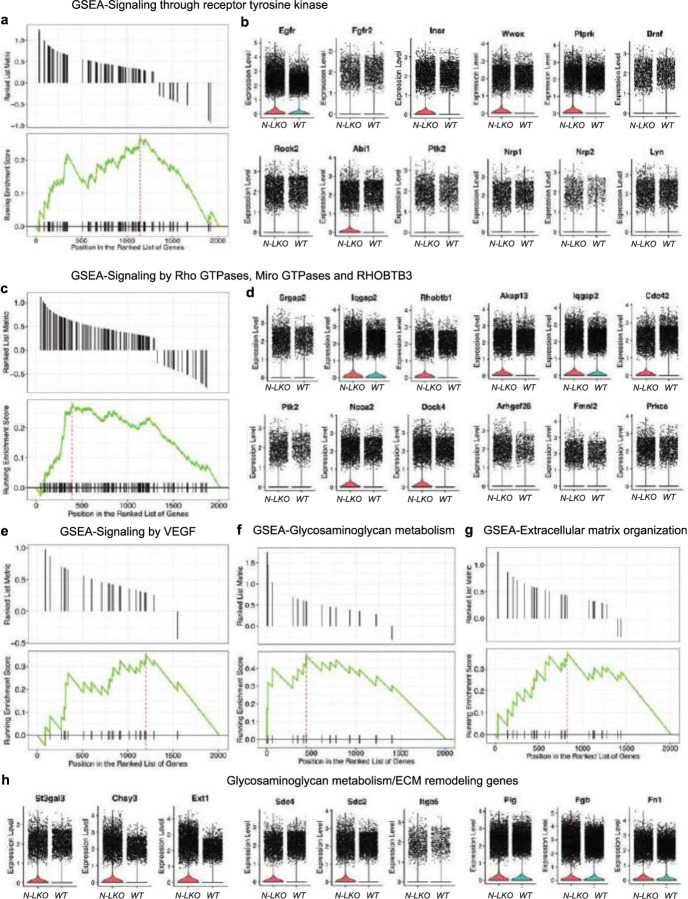
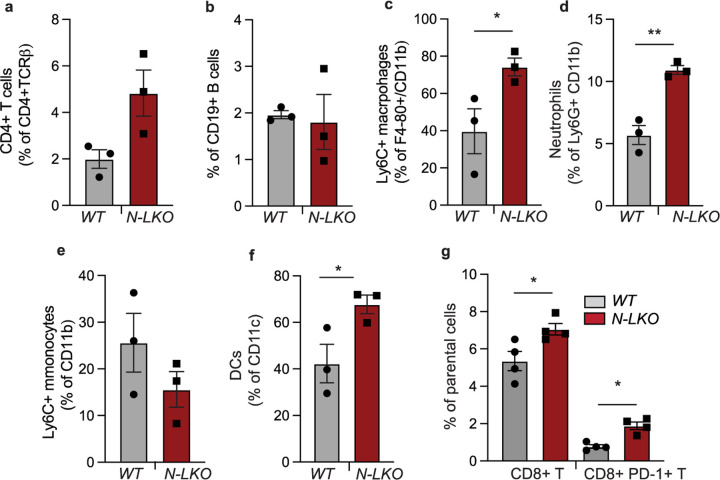
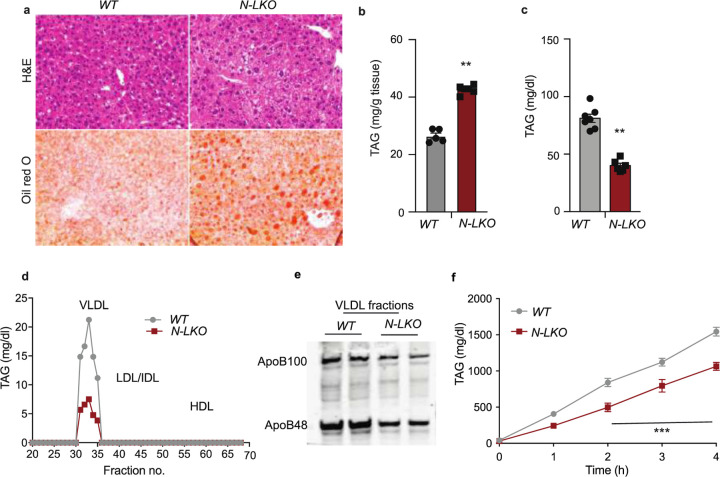
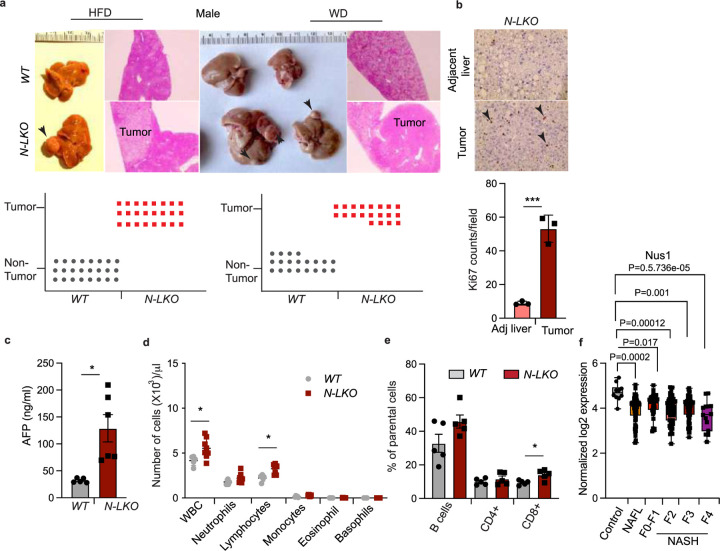
Obesity-linked fatty liver is a significant risk factor for hepatocellular carcinoma (HCC)1,2; however, the molecular mechanisms underlying the transition from non-alcoholic fatty liver disease (NAFLD) to HCC remains unclear. The present study explores the role of the endoplasmic reticulum (ER)-associated protein NgBR, an essential component of the cis-prenyltransferases (cis-PTase) enzyme3, in chronic liver disease. Here we show that genetic depletion of NgBR in hepatocytes of mice (N-LKO) intensifies triacylglycerol (TAG) accumulation, inflammatory responses, ER/oxidative stress, and liver fibrosis, ultimately resulting in HCC development with 100% penetrance after four months on a high-fat diet. Comprehensive genomic and single cell transcriptomic atlas from affected livers provides a detailed molecular analysis of the transition from liver pathophysiology to HCC development. Importantly, pharmacological inhibition of diacylglycerol acyltransferase-2 (DGAT2), a key enzyme in hepatic TAG synthesis, abrogates diet-induced liver damage and HCC burden in N-LKO mice. Overall, our findings establish NgBR/cis-PTase as a critical suppressor of NAFLD-HCC conversion and suggests that DGAT2 inhibition may serve as a promising therapeutic approach to delay HCC formation in patients with advanced non-alcoholic steatohepatitis (NASH).


Figures

Extended Data Fig. 1
Extended Data Fig. 1. The Loss of NgBR function in the liver reduces cis-PTase enzyme activity.
a, Schematic diagram showing the generation of liver-specific NgBR knockout (N-LKO) mice. (1) The NgBR genomic DNA fragment is composed of three exon 1–3 (2) Schematic construct of the NgBR targeting vector. NgBR exon1 is flanked by two loxP sites. (3) Mice with floxed allele are generated after homologous recombination. Consequently, these mice were bred with mice expressing CRE recombinase to generate tissue-specific NgBR-knockout mice. Right panel represents PCR amplification of NgBRf/f mice showing bands from both, one, or none of the floxed alleles. mRNA expression of NgBR in the liver, WAT, heart and muscle of WT and N-LKO mice (n=3). b, NgBR expression in these tissues is normalized to its expression in liver from WT mice. c, Measurement of microsomal Cis-PTase activity in isolated hepatocytes of WT and N-LKO mice (n=3). Two-sided *P < 0.05; comparing N-LKO with WT mice using an unpaired Welch’s t-test.
Extended Data Fig. 2
Extended Data Fig. 2. The hepatic loss of NgBR function reduces circulating TAG levels under obesogenic diet conditions.
a, Circulating TAG levels from overnight fasted WT and N-LKO mice fed high-fat-diet (HFD) for 4 months (n=7). b, TAG content of FPLC-fractionated lipoproteins from pooled plasma (n=5) of overnight-fasted WT and N-LKO mice fed a HFD for 4 months. Two-sided ***P < 0.001, by Welch’s t-test.
Extended Data Fig. 3
Extended Data Fig. 3. Suppression of hepatic NgBR reduces body weight food consumption and water intake without influencing energy expenditure.
a, Body weight of WT and N-LKO mice fed HFD for 16 weeks. b-e, Metabolic analysis of HFD fed WT and N-LKO mice over 48hour period. b, Food consumption. Cumulative graph on the right. c, Water intake. Right panel displays cumulative graph of water intake. d, Energy expenditure (EE) Right section shows cumulative graph. e, Carbon dioxide production. Cumulative graph on the right panel. All data are represented as mean ± SEM. *P < 0.05; comparing N-LKO with WT mice using an unpaired Welch’s t test, (n=7).
Extended Data Fig. 4
Extended Data Fig. 4. Ablation of hepatic NgBR does not affect the locomotor activity.
Metabolic analysis of HFD fed WT and N-LKO mice over 48hour period. a, Oxygen consumption. Right panel shows cumulative graph. (n=7). b, Respiratory exchange ratio (RER) c, Ambulatory activity, d, Locomotor activity, e, fine movement and f, Z Movement (n=7).
Extended Data Fig. 5
Extended Data Fig. 5. Hepatic loss of NgBR drives the HCC development in HFD- diet conditions.
a, The graph show tumor incidence in female N-LKO mice fed an HFD for 16 weeks. b, The graph show no tumor incidence in N-LKO mice fed an CD for ~ 20 months.
Extended Data Fig. 6
Extended Data Fig. 6. Mutation in NgBR drives the HCC development in HFD- diet conditions.
a, Generation of NgBR R-294H mutant mice. PCR and agarose gel electrophoresis of WT, R294H point mutant homozygous and heterozygous tail samples. Genotyping from NgBR R294H mutant mice presentation bands from one (WT,269bp) two (homozygous-154+115bp) or three (heterozygous −269 and 154+115bp). b, Kaplan-Meier survival curves of WT and R294H mutant homozygous mice. c, Representative image of mice with liver cancer of R294H heterozygous mutant and WT fed HFD for 16 weeks. arrow showing toward HCC. d, Right panel shows graph summarizing R294H mutant heterozygous and WT mice with or without tumor on HFD (n=8). Symbols display individual mice. e, Histological analysis of liver and tumor sections stained with H&E and Ki-67 isolated from WT and R294H mutant heterozygous mice on HFD. Scale bar, 200 μm.
Extended Data Fig. 7
Extended Data Fig. 7. Depletion of Dhdds in the liver drives the HCC development in HFD- diet conditions.
a, Schematic diagram showing the generation of liver-specific Dhdds knockout (D-LKO) mice. (1) The cassette is composed of a short flippase recombination enzyme (Flp) recognition target (FRT), a Cre recombinase recognition target (loxP). Dhdds exons 2–3 are flanked by the loxP site. (2) Mice with floxed allele but missing neomycine cassette were generated by crossing with flp recombinase-deleter mice. (3) Afterward, these floxed mice were bred with mice expressing Cre recombinase to generate tissue-specific (D-LKO) mice. Genotyping from Dhddsfl/fl mice presentation bands from one, both, or none of the floxed alleles. b, mRNA expression of Dhdds in the liver, WAT, muscle, and heart of WT and D-LKO mice (n=3). Dhdds expression in the tissue (s) is normalized to its expression in liver from WT mice. c, Representative images of the liver isolated from WT and D-LKO mice fed a HFD for 16 weeks, arrow showing toward HCC. Right panel represents histological analysis of liver and tumor sections stained with H&E and right panel shows graph summarizing D-LKO and WT mice with or without tumor feeding on HFD. Symbols represent individual mice. Scale bar, 200 μm. Two-sided; **P < 0.01; comparing D-LKO with WT mice using an unpaired Welch’s t-test.
Extended Data Fig. 8
Extended Data Fig. 8. Mutation landscape analysis of liver and tumor initiated by hepatic NgBR deficiency in mouse.
a, Comparison of mutation burden, measured as the number of mutations per megabase (MB) or per coding MB, in tumors and tumor-adjacent liver tissue, as well as the number of somatic mutations per MB in tumors from N-LKO mice fed a Western diet (WD) for 16 weeks. b, The array shows the mutation signature analysis of adjacent liver (upper panel) and tumor (lower panel) from a mouse with hepatic NgBR deficiency fed a western-type diet (WD) for 16 weeks. The x-axis represents the base substitution pattern based on trinucleotide context, while the y-axis shows the percentage of single base substitution. c, The table displays the list of gene variants identified in the adjacent liver tissue of N-LKO mice. d, Representative western blots of MUC4 and housekeeping standard HSP90 in liver lysate from WT and N-LKO mice fed a WD for 16 weeks (n=4).
Extended Data Fig. 9
Extended Data Fig. 9. Liver-specific NgBR deficiency enhances the expression of genes related to NAFL and HCC.
a, RNA seq analysis in the livers of WT and N-LKO mice fed a HFD. MBD plot for differential expression genes that showing the log-fold change and average abundance of each gene. Loss of hepatic NgBR upregulated 407 genes and downregulated 290 genes (n=4). b, KEGG pathway analysis of differentially upregulated genes in N-LKO vs WT (n=3). c, RNA seq analysis in livers of WT and N-LKO and tumors of N-LKO mice fed a WD (n=3). Heat map representing differentially expressed genes involved in hepatic cancer.
Extended Data Fig. 10
Extended Data Fig. 10. Liver-specific NgBR ablation induces distinct and differential gene expression patterns in liver cells.
a, Single-cell RNA sequencing analysis of liver cells from WT and N-LKO mice fed a Western diet (WD) UMAP plot showing 33 distinct clusters of cells isolated from the liver of WT and N-LKO mice fed WD. b, UMAP plots representing 9 subclusters of hepatocytes in WT and N-LKO mice. The color represents the subcluster or genotype. c. Volcano plot displaying the differential expression of genes in log-transformed upregulated and downregulated genes. d, Gene set enrichment analysis (GSEA) plot representing the downregulation of genes in hepatocytes involved in fatty acid and lipid metabolism.
Extended Data Fig. 11
Extended Data Fig. 11. Liver-specific NgBR depletion downregulates oxidative stress response.
Single-cell RNA sequencing analysis of hepatic cells from WT and N-LKO mice fed a Western diet (WD). a-c, Gene set enrichment analysis (GSEA) plot representing the downregulation of genes involved in biological oxidation, glutathione conjugation and detoxification of ROS (reactive oxygen species) in hepatocytes of N-LKO mice compared to those of WT mice. d-e, The violin plots indicate a significant reduction in the expression of genes related to oxidative stress, glutathione metabolism, and ER stress in the hepatocytes of N-LKO compared to WT mice.
Extended Data Fig. 12
Extended Data Fig. 12. Lack of NgBR reduces the cell cycle checkpoint regulators.
Single-cell RNA seq analysis distinct gene expression patterns in the hepatocytes of WT and N-LKO mice fed a Western diet. a, Gene set enrichment analysis (GSEA) plot representing genes involved in the G2-M checkpoint regulation are downregulated in the hepatocytes of N-LKO mice compared to WT mice. b, Genes involved in p53-dependent G1-S DNA damage checkpoint regulation are significantly downregulated in N-LKO mice compared to WT mice fed a WD. c, APC-mediated degradation of cell cycle proteins: genes involved in the APC-mediated degradation of cell cycle proteins are downregulated in the N-LKO mice compared to WT mice. d, Stabilization of p53: genes involved in the stabilization of p53, a tumor suppressor protein that regulates the cell cycle, are downregulated in the hepatocyte of N-LKO mice compared to WT mice. e, Ubiquitin-dependent degradation of cyclin D: genes involved in the ubiquitin-dependent degradation of cyclin D, a protein that regulates the G1 phase of the cell cycle, are downregulated in the hepatocyte of N-LKO mice compared to WT mice. f, Regulation of PTEN stability and activity: genes involved in the regulation of PTEN stability and activity, a tumor suppressor protein that regulates cell cycle progression and cell growth, are downregulated in the hepatocytes of N-LKO mice compared to WT mice. The normalized enrichment score (NES) for each gene set is shown on the plot, with negative NES indicating downregulation of genes in the N-LKO mice compared to WT mice.
Extended Data Fig. 13
Extended Data Fig. 13. Absence of NgBR in hepatocytes promotes oncogenic associated pathway.
Single-cell RNA sequencing analysis that identified distinct gene expression patterns in the hepatocytes of N-LKO mice that were fed a Western diet. a, The gene set enrichment analysis (GSEA) plot reveals that genes involved in signaling via tyrosine receptors were upregulated in hepatocytes of N-LKO mice compared to WT mice. b, The violin plots further reveal significantly increased expression levels of hepatocyte genes involved in activation of tyrosine receptor signaling in N-LKO mice compared to WT mice. c, The GSEA plot shows the upregulation of genes involved in Rac/Rho GTPase signaling in hepatocytes of N-LKO mice compared to WT mice. d, The violin plots illustrate expression levels of hepatocyte genes involved in Rac/Rho GTPase signaling were significantly elevated in N-LKO mice relative to WT mice. e-g The GSEA plots show the upregulation of genes involved in VEGF signaling, glucosamine glycans metabolism, and ECM organization in hepatocytes of N-LKO mice compared to WT mice. h, The violin plots demonstrate a significantly increase in the expression of genes involved in glucosamine glycans metabolism and ECM remodeling in N-LKO mice relative to WT mice.
Extended Data Fig. 14
Extended Data Fig. 14. Hepatic loss of NgBR impacts on T cell profile.
The single-cell RNA sequencing analysis of liver cells from WT and N-LKO mice fed a WD revealed important differences in the gene expression patterns of T cells. a-b, The UMAP plot displays four distinct subclusters of T cells from both groups, colored according to genotype. The color represents the subcluster or genotype. c, The Volcano plot illustrates the differential expression of genes in upregulated and downregulated T cells in N-LKO mice compared to WT mice. d, GSEA plot indicates the downregulation of genes involved in mitochondrial respiratory function, fatty acid metabolism, and detoxification of ROS in T cells of N-LKO mice compared to WT mice. e, The violin plots demonstrate that T cells from N-LKO mice had significantly downregulated antioxidant genes compared to those from WT mice. f-g, The Violin plots show a significant upregulation of genes associated with T cell exhaustion and stress in hepatic T cells of N-LKO mice compared to WT mice.
Extended Data Fig. 15
Extended Data Fig. 15. Loss of NgBR in hepatocytes triggers the activation of hepatic stellate cell gene profile.
Impact of hepatic loss of NgBR on the hepatic stellate cell gene profile, as analyzed through single-cell RNA sequencing of liver cells from WT and N-LKO mice fed a Western diet (WD). a, The UMAP plot illustrates distinctive subclusters of hepatic stellate cells in both groups, which are distinguished by color. b, The volcano plots illustrate the differential expression of genes, demonstrating significant upregulation and downregulation of hepatic stellate cells in N-LKO mice compared to WT mice. c-d, Gene Set Enrichment Analysis (GSEA) plots that show the downregulation of HSC genes involved in lipid oxidation in N-LKO compared to WT mice e, The violin plots visually depicted the significant downregulation of expression levels of HSC genes involved in the oxidative stress response in N-LKO mice relative to WT mice. f-h, GSEA plots that show upregulation of HSC genes on extracellular cell matrix (ECM) remodeling
Extended Data Fig. 16
Extended Data Fig. 16. Lack of NgBR in the liver enhances hepatic immune infiltration.
a-g, Hepatic lymphoid cells including CD4+ T cells and CD19+ B cells and myeloid cells including macrophages, neutrophil cells, monocytes and dendritic cells (DCs) and immunosuppressive CD8+PD1+ T cells isolated from WT and N-LKO mice fed an HFD for 16 weeks assessed by flow cytometry. Two-sided; *P < 0.05; **P < 0.01; comparing N-LKO with WT mice using an unpaired Welch’s t-test.
Extended Data Fig. 17
Extended Data Fig. 17. absence of NgBR in the liver induces oxidative and ER stress.
a, Analysis of cellular ROS production in the primary hepatocytes isolated from WT, N-LKO fed a HFD (n=6). b, Membrane lipid peroxidation determined via MDA assay in the liver isolated from WT and N-LKO fed HFD (n=3). c, Representative immunoblot blot and densiometric analysis of an ER key stress response proteins ATF4 and Bip1 and housekeeping standard HSP90 in the liver isolated from WT and N-LKO fed HFD (n=3). Two-sided **P < 0.01; comparing N-LKO with WT mice using an unpaired Welch’s t-test.
Fig. 1.
Fig. 1.. The loss of NgBR functions in the liver impairs hepatic VLDL-TAG secretion.
a, Representative images of H&E-stained and oil red O-stained (ORO) liver sections, and b, hepatic TAG levels, both obtained from WT and N-LKO mice fed a chow diet (CD) for 6 months (n=4). c, Circulating TAG levels in overnight-fasted WT and N-LKO mice on a 6-month CD (n=6). d, TAG content of FPLC-fractionated lipoproteins from pooled plasma (n=5) of overnight-fasted WT and N-LKO mice fed a CD for 6 months. e, Representative western blot analyses of plasma ApoB100 and ApoB48 in the VLDL fractions from FPLC-fractionated lipoproteins (n=5). f, Plasma TAG levels in overnight fasted WT and N-LKO mice treated with LPL inhibitor 407 to block the lipolysis of circulating TAG-rich lipoprotein (n=5). Statistical significance: **P < 0.01 using Welch’s t-test (b) and ***P < 0.001 using two-way ANOVA with Sidak’s multiple comparisons test (f).
Fig. 2.
Fig. 2.. Loss of hepatic NgBR drives HCC development in diet-induced obesity and correlates with NAFLD-NASH progression in human liver.
a, Representative images of livers from wild-type (WT) and liver-specific NgBR-deficient (N-LKO) male mice fed a high-fat diet (HFD) or western-type diet (WD) for 16 weeks, with arrows indicating HCC. Histological analysis of liver and tumor sections stained with H&E are shown in the right panel, and the graph summarizes the incidence of HCC (lower panel) in N-LKO and WT mice on HFD (n=24) and WD (n=16). The scale bar represents 200 μm and the icons indicate individual mice. b, IHC analysis of the proliferation marker Ki-67 in tumor and tumor-adjacent liver of N-LKO mice kept on WD for 16 weeks, with quantification of Ki-67/field (n=3) shown in the lower panel. Scale bar, 50 μm; c, Circulating AFP levels in WT and N-LKO mice fed HFD (n=5,6). d, Peripheral blood cell counts from WT and N-LKO mice fed HFD for 16 weeks, measured using a hemavet hematology analyzer (n=5). e, Flow cytometry analysis of circulating B and T cells (n=5). f, The log2 normalized mRNA expression levels of NgBR (Nus1) in human liver samples with non-alcoholic fatty liver (NAFL) and varying stages of non-alcoholic steatohepatitis (NASH) with different degrees of fibrosis. The expression levels were obtained through RNA sequencing of 15 healthy liver samples, 30 steatosis samples, and 20 NASH samples at stages F0-F4. The analysis was adjusted for P values. Each data point represents a biological replicate. All data are represented as mean ± SEM, and two-sided *P < 0.05; ***P < 0.001, comparing N-LKO with WT mice using an unpaired Welch’s t-test (b-e).
Fig. 3.
Fig. 3.. Liver-specific NgBR depletion induces gene expression patterns associated with NAFLD and HCC in hepatic cells.
a, Single-cell RNA sequencing of the livers isolated from WT and liver-specific NgBR knockout (N-LKO) mice using the 10x Genomics Chromium platform. Uniform manifold approximation and projection (UMAP) visualize clustering of liver single-cell transcriptomes (7000 cells from WT and 7000 cells from N-LKO mice fed WD). Color annotating cell type or genotypes, circle around cluster represent cancer cells. b-c, Enrichment Score curves Gene set enrichment analysis (GSEA) plots of significant differentially expressed genes between WT and N-LKO hepatocytes. The peak in the plot shows the downregulation of the gene sets associated with Lipoprotein packaging and secretion and mitochondrial oxidative function. d-e, The violin plots compare the expression levels of hepatic stellate cell (HSC) quiescent marker genes (upper panel) and activation marker genes (lower panel) that are downregulated and upregulated, respectively, in N-LKO mice relative to WT mice. The plots illustrate a significant shift in the phenotype of hepatic stellate cells in N-LKO mice, as demonstrated by the altered expression of quiescent and activation markers.
Fig. 4.
Fig. 4.. Hepatic NgBR deficiency exacerbates NASH-fibrosis phenotype in response to overnutrition.
a, Representative images of liver sections stained with H&E, and b, hepatic TAG levels in WT and N-LKO mice fed a HFD for 16 weeks (n=7). Scale bar, 50 μm. (c-d) Liver lymphoid cells including CD8+ T cells and NK cells (n=3) isolated from WT and N-LKO mice fed an HFD for 16 weeks assessed by flow cytometry. e, The violin plots illustrate the expression of acute phage response genes is elevated in the hepatocytes of N-LKO compared WT mice that were fed a WD. f, Representative images and quantification of Sirius red staining in the liver sections from WT and N-LKO mice fed HFD for 16 weeks (n=7). Scale bar, 100 μm g, Log transformed mRNA expression of Col6a2 and Col1a1 from liver of WT and N-LKO mice fed an HFD for 16 weeks (n=3). h-i, Plasma ALT and AST levels in WT and N-LKO mice fed an HFD (n=5). All data are represented as mean ± SEM. Two-sided *P < 0.05; **P < 0.01; ***P < 0.001, comparing N-LKO– with WT mice using an unpaired Welch’s t-test.
Fig. 5.
Fig. 5.. DGAT2 inhibitor treatment prevents the diet-induced NAFL-HCC pathogenesis.
This study involved three groups of mice: WT mice receiving Western diet (WD) for 16 weeks and N-LKO mice of the same age group, with N-LKO divided into two subgroups - one receiving a WD only and the other receiving formulated WD with a DGAT2 inhibitor (designated as N-LKO+DGI) for 16 weeks. After 16 weeks, the following parameters were measured. a, Hepatic TAG levels in all three groups of mice (n=5). b, Representative images and quantification of Sirius red staining (Upper and right panel) and Trichome staining (lower panel) in liver sections from all three groups of mice (n=5). Scale bar, 100 μm. c-d, Serum ALT and AST levels in all three groups of mice (WT n=5, N-LKO n=6, N-LKO+DGI n=7). e, Analysis of cellular ROS in primary hepatocytes isolated from all three groups of mice (n=3). f, Membrane lipid peroxidation determined through MDA assay in the liver of all three groups of mice (n=4). g, Representative western blot and densitometric analysis of a key ER stress response protein ATF4 and housekeeping standard HSP90 in all three groups of mice (n=3). h, Representative photographs of livers isolated from N-LKO and N-LKO+DGI mice, with histological analysis of liver and tumor sections stained with H&E, and a graph summarizing the occurrence of tumors in both groups (n=8). Scale bar, 200 μm. i, Plasma AFP levels in all three groups of mice (WT n=5, N-LKO n=8, N-LKO+DGI n=8). The bar with dot plots represents the mean ± SEM, with each point representing a biological sample. Statistical analysis was performed using one-way ANOVA with Tukey’s multiple comparisons test (*P < 0.05; **P < 0.01; ***P < 0.001).

Similar articles

References

    1. Grohmann M. et al. Obesity Drives STAT-1-Dependent NASH and STAT-3-Dependent HCC. Cell 175, 1289–1306 e1220, doi:10.1016/j.cell.2018.09.053 (2018). - DOI - PMC - PubMed
    1. Park E. J. et al. Dietary and genetic obesity promote liver inflammation and tumorigenesis by enhancing IL-6 and TNF expression. Cell 140, 197–208, doi:10.1016/j.cell.2009.12.052 (2010). - DOI - PMC - PubMed
    1. Park E. J. et al. Mutation of Nogo-B receptor, a subunit of cis-prenyltransferase, causes a congenital disorder of glycosylation. Cell Metab 20, 448–457, doi:10.1016/j.cmet.2014.06.016 (2014). - DOI - PMC - PubMed
    1. El-Serag H. B. Hepatocellular carcinoma. N Engl J Med 365, 1118–1127, doi:10.1056/NEJMra1001683 (2011). - DOI - PubMed
    1. Garrido A. & Djouder N. Cirrhosis: A Questioned Risk Factor for Hepatocellular Carcinoma. Trends Cancer 7, 29–36, doi:10.1016/j.trecan.2020.08.005 (2021). - DOI - PubMed

Publication types