[Preprint]. 2024 Sep 25:2023.11.17.567650.
doi: 10.1101/2023.11.17.567650.

Fast and accurate local ancestry inference with Recomb-Mix

Affiliations

Fast and accurate local ancestry inference with Recomb-Mix

Yuan Wei et al. bioRxiv. .

Update in

Abstract

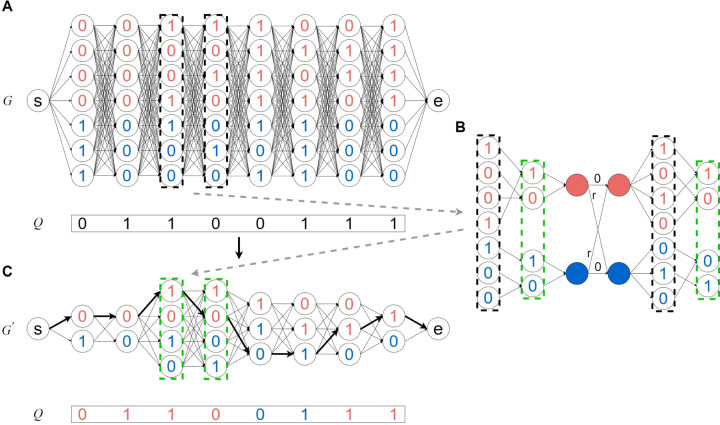
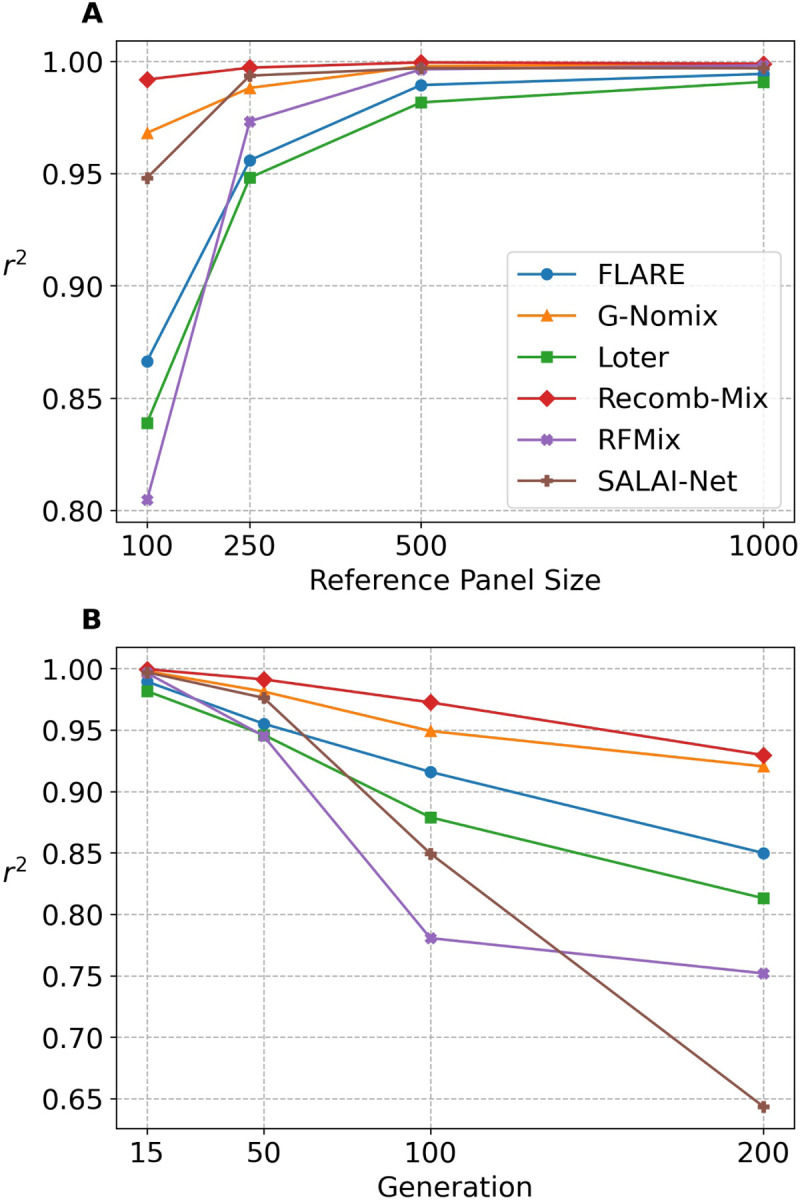
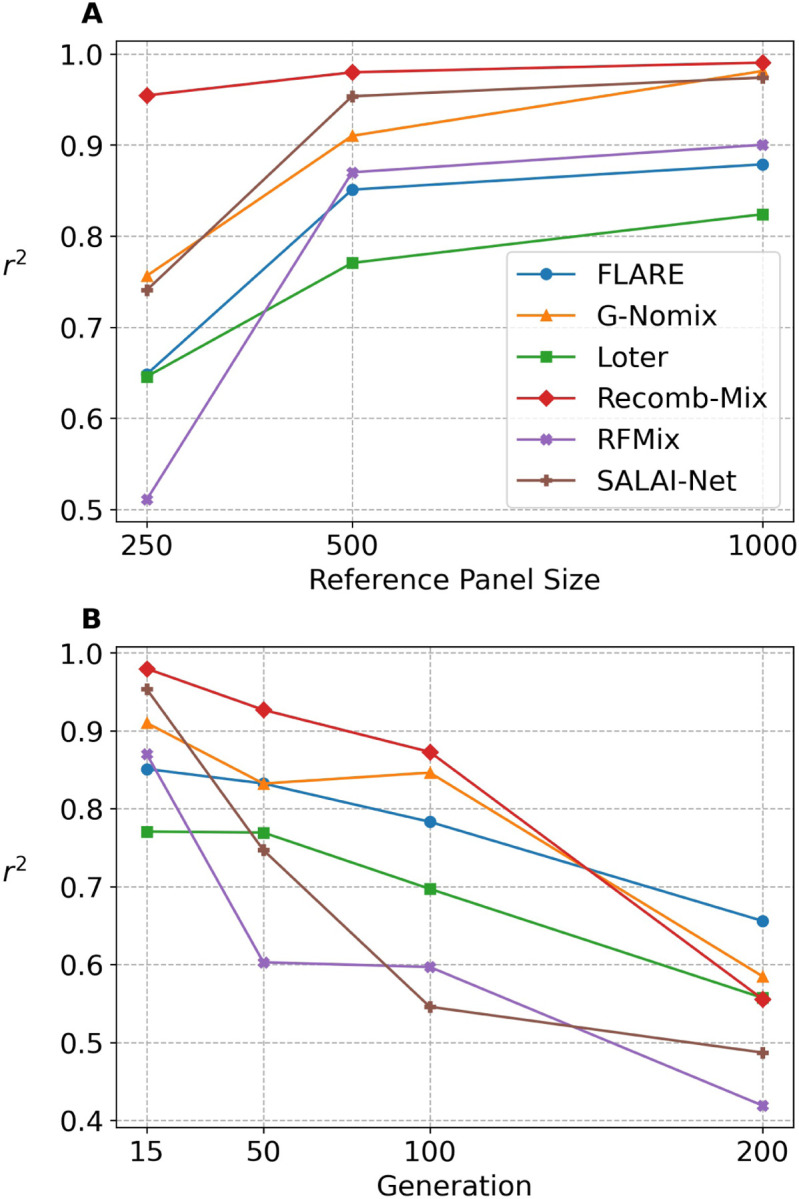
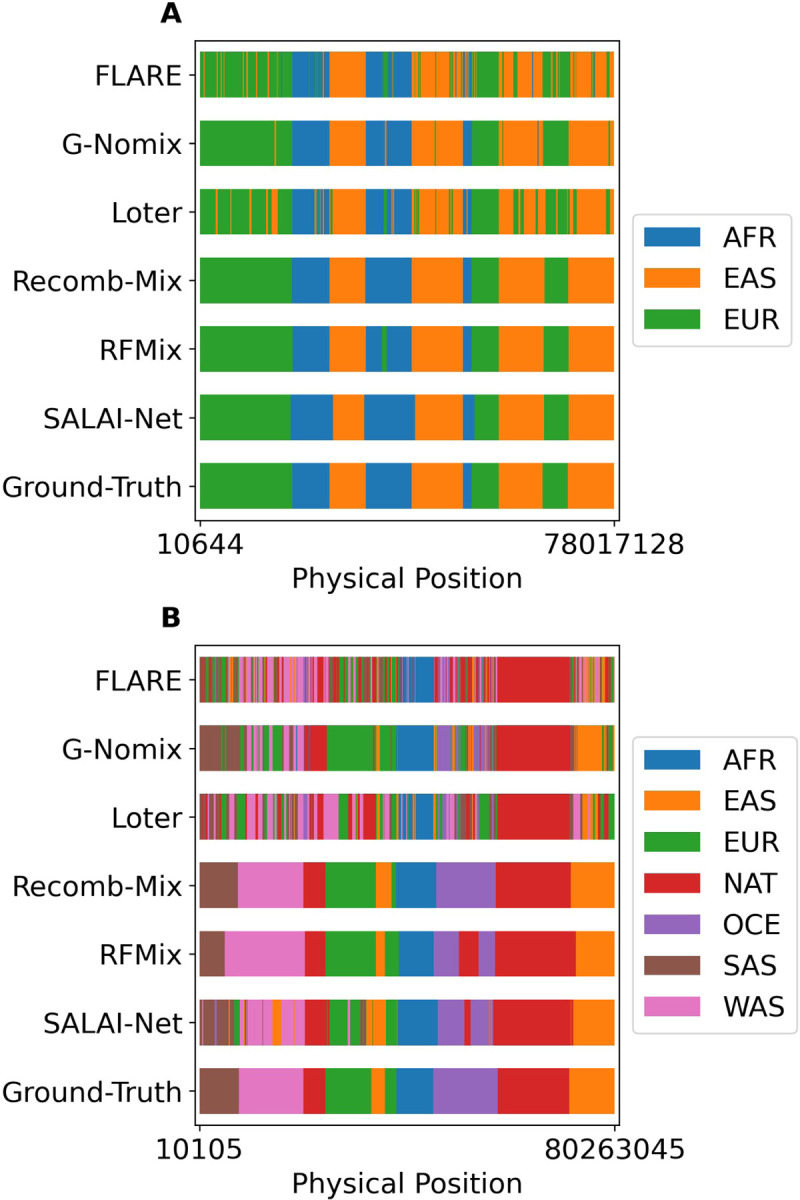
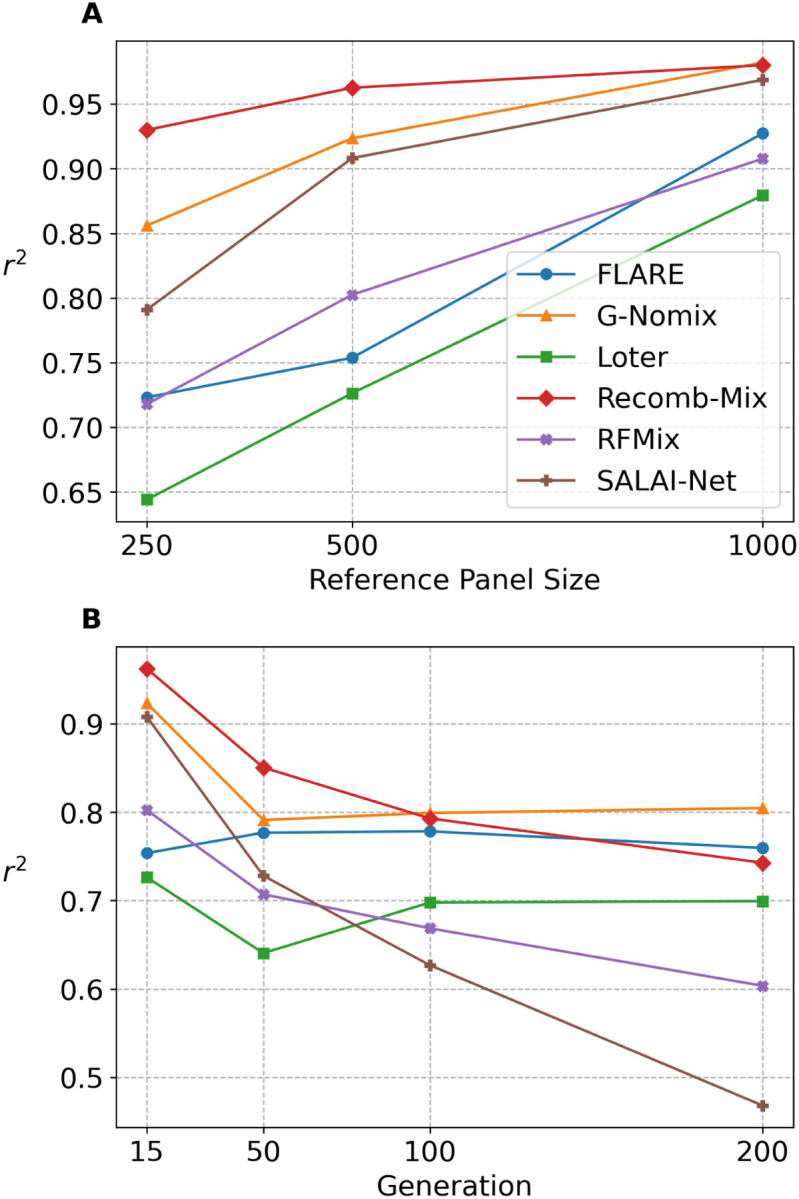
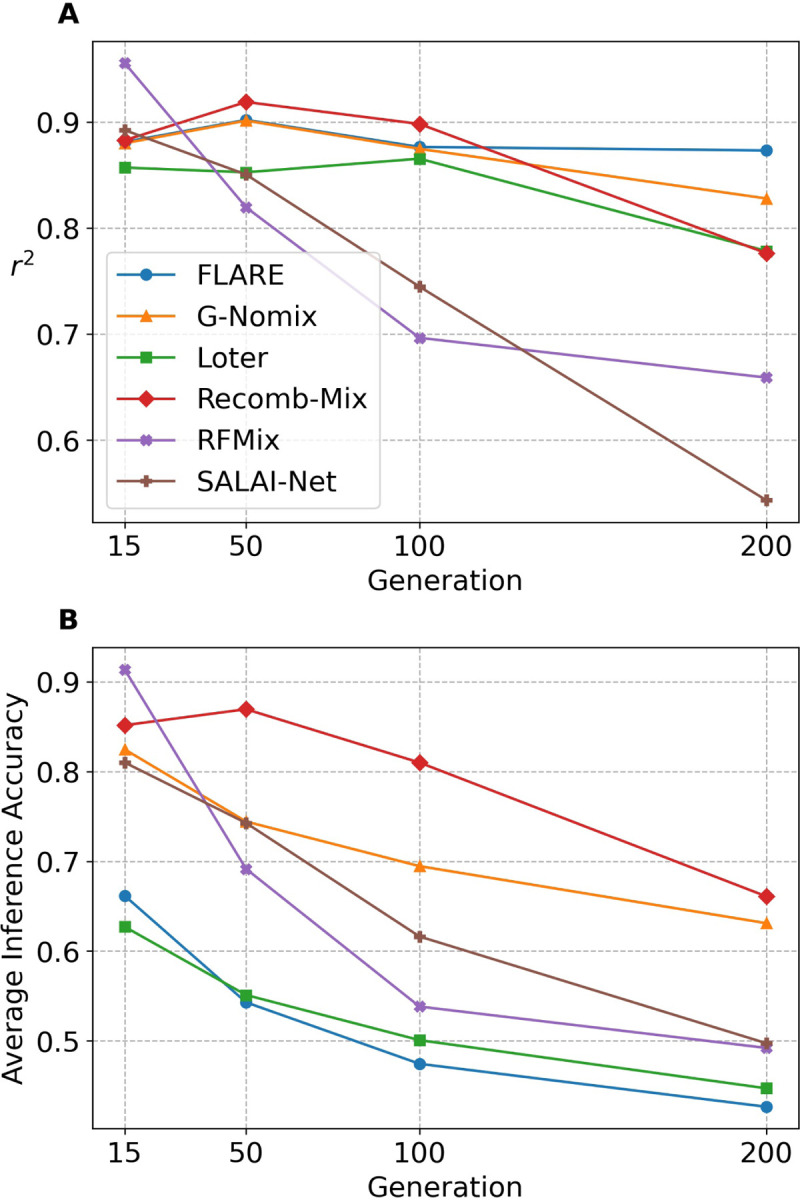
The availability of large genotyped cohorts brings new opportunities for revealing the high-resolution genetic structure of admixed populations via local ancestry inference (LAI), the process of identifying the ancestry of each segment of an individual haplotype. Though current methods achieve high accuracy in standard cases, LAI is still challenging when reference populations are more similar (e.g., intra-continental), when the number of reference populations is too numerous, or when the admixture events are deep in time, all of which are increasingly unavoidable in large biobanks. Here, we present a new LAI method, Recomb-Mix. Recomb-Mix integrates the elements of existing methods of the site-based Li and Stephens model and introduces a new graph collapsing trick to simplify counting paths with the same ancestry label readout. Through comprehensive benchmarking on various simulated datasets, we show that Recomb-Mix is more accurate than existing methods in diverse sets of scenarios while being competitive in terms of resource efficiency. We expect that Recomb-Mix will be a useful method for advancing genetics studies of admixed populations.


Figures

Figure 1:
Figure 1:
An example of local ancestry inference with Recomb-Mix. (A) G is a population graph representing the HMM in Recomb-Mix, constructed from a given reference panel. G contains seven haplotypes with eight sites belonging to two populations (shown in red and blue). Q is a query of an admixed individual haplotype. (B) A transformation process from nodes in sites three and four in G to nodes in the corresponding sites in G. Nodes in black boxes correspond to the nodes in sites three and four in G. Nodes in green boxes correspond to the nodes in sites three and four in G. The filled nodes in red and blue are population emission nodes in sites three and four. r is a cross-population penalty. (C) G is a compact population graph transformed from G. Q is assigned with estimated ancestral labels for each site (shown in red and blue on allele values), according to a threading path selected with minimum penalty score (shown as bold edges) in G.
Figure 2:
Figure 2:
The squared Pearson’s correlation coefficient r2 of three-way inter-continental simulated datasets on FLARE, G-Nomix, Loter, Recomb-Mix, RFMix, and SALAI-Net. Markers were filtered with minor allele frequency 0.005 and minor allele count 50. (A) The three-way 15-generation datasets with the reference panel sizes 100, 250, 500, and 1,000 (values are in Supplemental Table S3). (B) The three-way 500-reference datasets with the generations 15, 50, 100, and 200 (values are in Supplemental Table S4).
Figure 3:
Figure 3:
The squared Pearson’s correlation coefficient r2 of seven-way inter-continental simulated datasets on FLARE, G-Nomix, Loter, Recomb-Mix, RFMix, and SALAI-Net. Markers were filtered with minor allele frequency 0.005 and minor allele count 50. (A) The seven-way 15-generation datasets with the reference panel sizes 250, 500, and 1,000 (values are in Supplemental Table S8). The reference panel size 100 case was not included because the number of markers was too small and may have influenced the outcome after the filtering. (B) The seven-way 500-reference datasets with the generations 15, 50, 100, and 200 (values are in Supplemental Table S9).
Figure 4:
Figure 4:
Sample haplotypes inferred by FLARE, G-Nomix, Loter, Recomb-Mix, RFMix, and SALAI-Net with the ground truth of ancestry labels. (A) An inferred sample haplotype from a three-way 15-generation 500-reference inter-continental simulated dataset. (B) An inferred sample haplotype from a seven-way 15-generation 500-reference inter-continental simulated dataset.
Figure 5:
Figure 5:
The squared Pearson’s correlation coefficient r2 of three-way intra-continental simulated datasets on FLARE, G-Nomix, Loter, Recomb-Mix, RFMix, and SALAI-Net. Markers were filtered with minor allele frequency 0.005 and minor allele count 50. (A) The three-way 15-generation datasets with the reference panel sizes 250, 500, and 1,000 (values are in Supplemental Table S12). The reference panel size 100 case was not included because the number of markers was too small and may have influenced the outcome after the filtering. (B) The three-way 500-reference datasets with the generations 15, 50, 100, and 200 (values are in Supplemental Table S13).
Figure 6:
Figure 6:
The performance of local ancestry inference with generations 15, 50, 100, and 200 of the three-way 500-misspecified-reference inter-continental simulated datasets on FLARE, G-Nomix, Loter, Recomb-Mix, RFMix, and SALAI-Net. (A) The squared Pearson’s correlation coefficient r2 (values are in Supplemental Table S17). Markers were filtered with minor allele frequency 0.005 and minor allele count 50. (B) The average accuracy rates (values are in Supplemental Table S18).
Figure 7:
Figure 7:
The average global ancestry proportions in the TGP Chromosome 18 data using four reference ancestries from the HGDP data. Descriptions of the populations are in Supplemental Table S1.
Figure 8:
Figure 8:
The average global ancestry proportions in the HGDP Chromosome 18 data using four reference ancestries from the TGP data. Descriptions of the populations are in Supplemental Table S1.
Figure 9:
Figure 9:
The discrete AIM (dAIM) density in the HGDP dataset per population on Chromosome 18. Each bin is 1 centiMorgan (cM), showing the markers’ dAIM percentage.

Similar articles

References

    1. Adrion JR, Cole CB, Dukler N, Galloway JG, Gladstein AL, Gower G, Kyriazis CC, Ragsdale AP, Tsambos G, Baumdicker F, et al. 2020. A community-maintained standard library of population genetic models. eLife 9: e54967. - PMC - PubMed
    1. Atkinson EG, Maihofer AX, Kanai M, Martin AR, Karczewski KJ, Santoro ML, Ulirsch JC, Kamatani Y, Okada Y, Finucane HK, et al. 2021. Tractor uses local ancestry to enable the inclusion of admixed individuals in GWAS and to boost power. Nature Genetics 53: 195–204. - PMC - PubMed
    1. Auton A, Abecasis GR, Altshuler DM, Durbin RM, Bentley DR, Chakravarti A, Clark AG, Donnelly P, Eichler EE, Flicek P, et al. 2015. A global reference for human genetic variation. Nature 526: 68–74. - PMC - PubMed
    1. Baran Y, Pasaniuc B, Sankararaman S, Torgerson DG, Gignoux C, Eng C, Rodriguez-Cintron W, Chapela R, Ford JG, Avila PC, et al. 2012. Fast and accurate inference of local ancestry in Latino populations. Bioinformatics 28: 1359–1367. - PMC - PubMed
    1. Bergström A, McCarthy SA, Hui R, Almarri MA, Ayub Q, Danecek P, Chen Y, Felkel S, Hallast P, Kamm J, et al. 2020. Insights into human genetic variation and population history from 929 diverse genomes. Science 367: eaay5012. - PMC - PubMed

Publication types