[Preprint]. 2023 Nov 14:rs.3.rs-3463730.
doi: 10.21203/rs.3.rs-3463730/v1.

CXCL9 recombinant adeno-associated virus (AAV) virotherapy sensitizes glioblastoma (GBM) to anti-PD-1 immune checkpoint blockade

Affiliations

CXCL9 recombinant adeno-associated virus (AAV) virotherapy sensitizes glioblastoma (GBM) to anti-PD-1 immune checkpoint blockade

Christina von Roemeling et al. Res Sq. .

Update in

Abstract

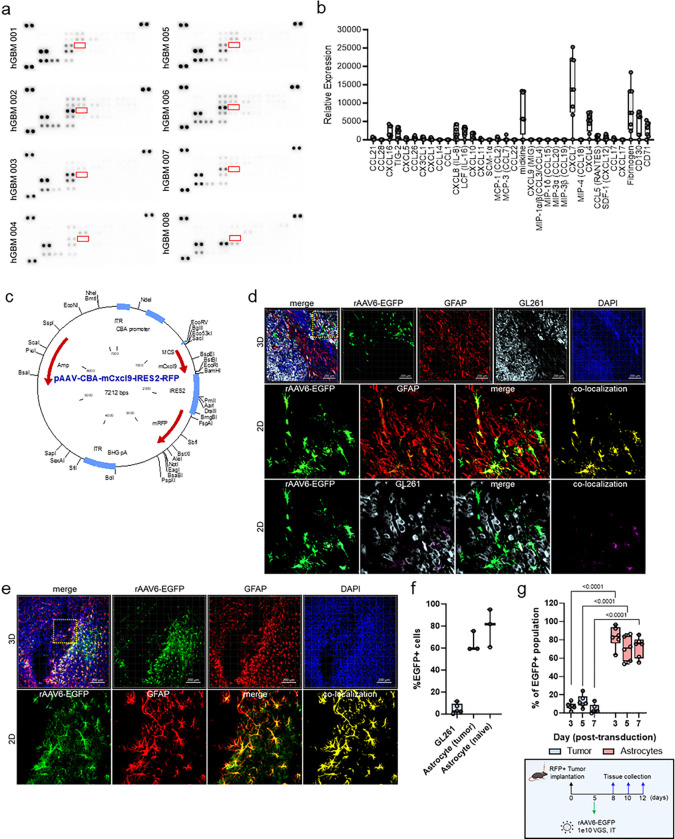
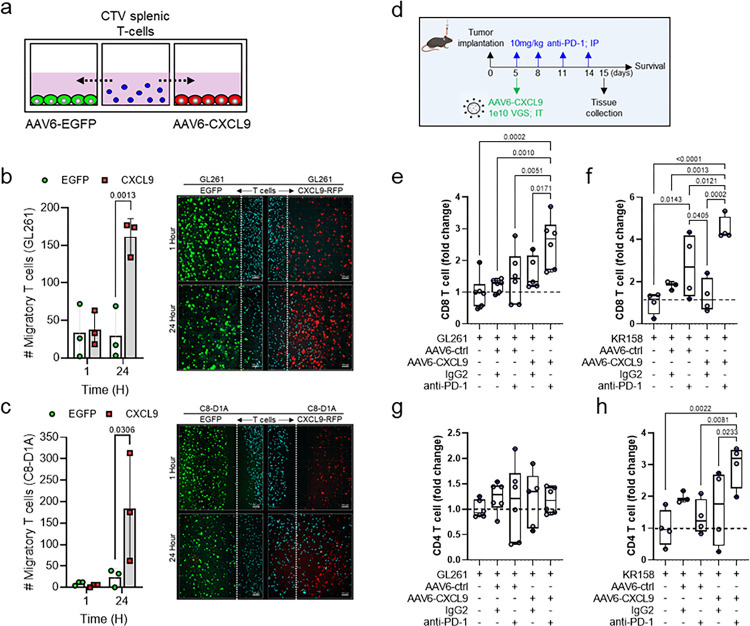
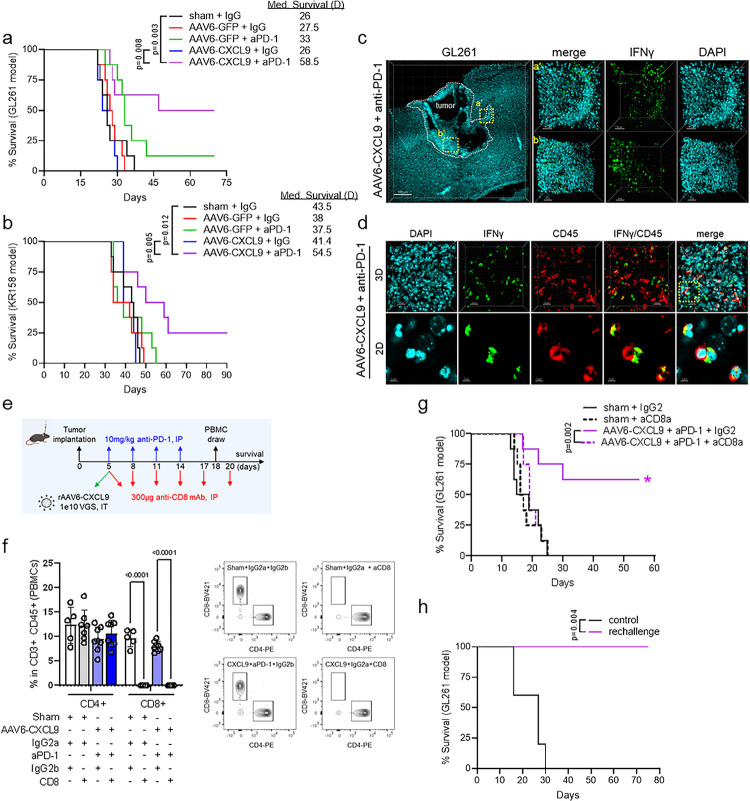
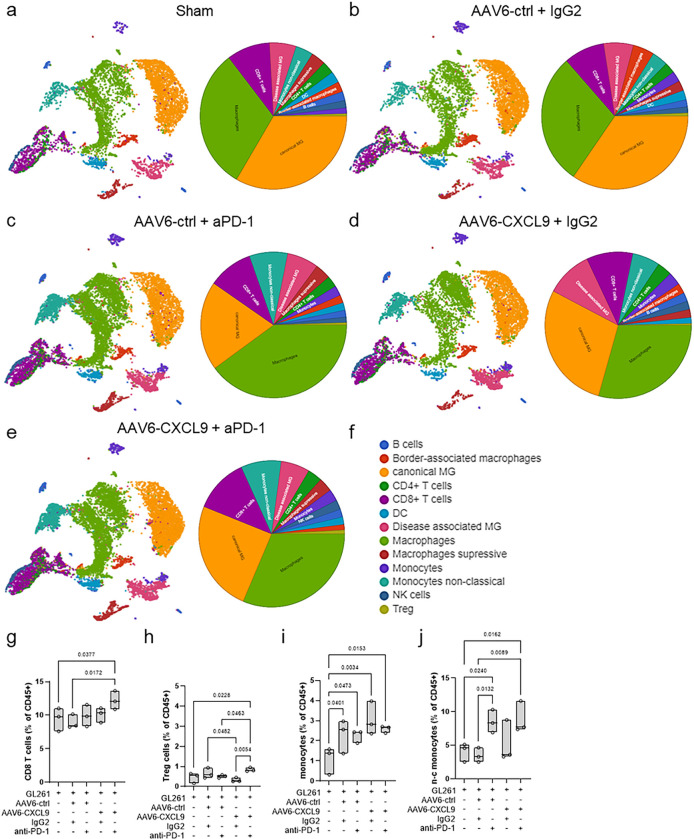
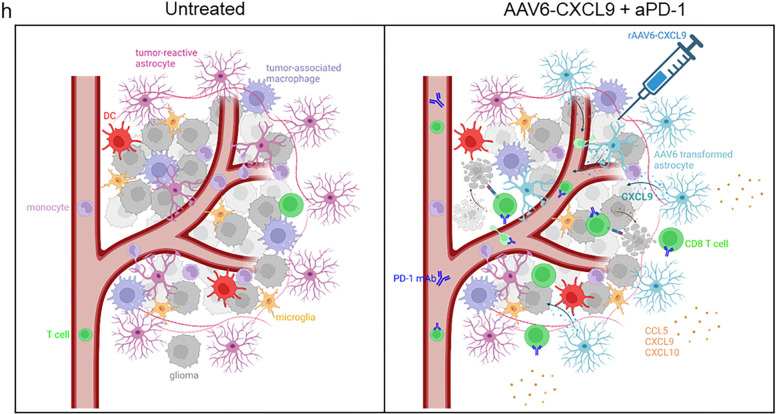
The promise of immunotherapy to induce long-term durable responses in conventionally treatment resistant tumors like glioblastoma (GBM) has given hope for patients with a dismal prognosis. Yet, few patients have demonstrated a significant survival benefit despite multiple clinical trials designed to invigorate immune recognition and tumor eradication. Insights gathered over the last two decades have revealed numerous mechanisms by which glioma cells resist conventional therapy and evade immunological detection, underscoring the need for strategic combinatorial treatments as necessary to achieve appreciable therapeutic effects. However, new combination therapies are inherently difficult to develop as a result of dose-limiting toxicities, the constraints of the blood-brain barrier, and the suppressive nature of the GBM tumor microenvironment (TME). GBM is notoriously devoid of lymphocytes driven in part by a paucity of lymphocyte trafficking factors necessary to prompt their recruitment, infiltration, and activation. We have developed a novel recombinant adeno-associated virus (AAV) gene therapy strategy that enables focal and stable reconstitution of the GBM TME with C-X-C motif ligand 9 (CXCL9), a powerful call-and-receive chemokine for cytotoxic T lymphocytes (CTLs). By precisely manipulating local chemokine directional guidance, AAV-CXCL9 increases tumor infiltration by CD8-postive cytotoxic lymphocytes, sensitizing GBM to anti-PD-1 immune checkpoint blockade (ICB). These effects are accompanied by immunologic signatures evocative of an inflamed and responsive TME. These findings support targeted AAV gene therapy as a promising adjuvant strategy for reconditioning GBM immunogenicity given its excellent safety profile, TME-tropism, modularity, and off-the-shelf capability, where focal delivery bypasses the constrains of the blood-brain barrier, further mitigating risks observed with high-dose systemic therapy.


Conflict of interest statement

Declarations Conflict of Interest The authors declare no potential conflicts of interest

Figures

Figure 1.
Figure 1.. Chemokine signature of glioblastoma tumors.
(a) Immunoblots of GBM samples showing signal intensity of 31 chemokines (n=8). CXCL9 (undetected) is outlined in red. (b) Cumulative relative protein expression of immunoblots shown in panel (a). (c) Recombinant AAV6 vector design encoding CXCL9 and the fluorescent reporter gene RFP. (d) 3D IHC of RFP-labeled GL261 tumor tissue collected 1 week following AAV6-EGFP injection. The top row depicts 3D rendering of tissue captured at 10x magnification. AAV6 transduced cells are shown in green pseudocolor, GFAP in red pseudocolor, RFP+ tumor cells in light blue pseudocolor, and DAPI nuclear stain in dark blue pseudocolor. 2nd and 3rd rows depict 2D digital zoom as outlined by the yellow dashed line in the top row to enhance cellular resolution. Voxel-based co-localization performed using Imaris imaging software between AAV6 and GFAP (2nd row) and AAV6 and tumor cells (3rd row) is shown as a separate channel (yellow or pink pseudocolor). Representative images selected from a minimum of 3 replicates. (e) 3D IHC of AAV6-EGFP transduction in age-matched naïve control mice. The top row depicts 3D rendering of tissue captured at 10x magnification. AAV6 transduced cells are shown in green pseudocolor, GFAP in red pseudocolor, and DAPI nuclear stain in dark blue pseudocolor. 2nd row depicts 2D digital zoom as outlined by the yellow dashed line in the top row to enhance cellular resolution. Voxel-based co-localization performed using Imaris imaging software between AAV6 and GFAP is shown as a separate channel (yellow pseudocolor). Representative images selected from a minimum of 3 replicates. (f) Quantitative summary of voxel-based AAV6 co-localization with either tumor (GL261, n=5) or astrocytes in each tumor-bearing (n=3) and naïve mice (n=3). Values are presented as the cumulative mean ± standard deviation. (g) Box-whisker plot of flow cytometry quantitation of AAV6 (EGFP+) co-localization with either tumor cells (GL261, RFP+) or astrocytes (GFAP+, RFP−) at 3-, 5-, and 7-days post AAV6 transduction as illustrated in the schematic below. Two-way ordinary ANOVA statistical analysis performed comparing percent transduction between tumor and astrocytes across matched time points, n=6 per time point. P-values = or < 0.05 are considered statistically significant.
Figure 2.
Figure 2.. AAV6 tumor tropism.
3D IHC displaying geospatial distribution of AAV6 encoded transgene (BFP) in (a) GL621 and (b) KR158 tumors collected 1 week following in vivo transduction (green pseudocolor), n=2 per model. DRAQ5 nuclear dye (pink pseudocolor) is used to identify tumor borders, as outlined by the white dashed line. (c) Intra-tumor AAV6 treatment schematic for protein detection of AAV6 encoded CXCL9. ELISA detection of CXCL9 protein in serum extracted from peripheral blood draws at one and two weeks following AAV6-CXCL9 or AAV6-EGFP control intracranial injection in (d) GL261 and (e) KR158 models, n=3 per time point, per group. Age-matched naïve controls used to establish baseline CXCL9 levels indicated by dashed black line. ELISA detection of CXCL9 protein in brain tissues isolated at 1 and 2 weeks following AAV6-CXCL9 or AAV6-EGFP control intracranial injection in (f) GL261 and (g) KR158 models. Cerebellar tissue was removed and left and right hemispheres lysed separately to reflect tumor-bearing and contralateral (focal and distal) signal detection. Statistical analyses performed using two-way ANOVA analysis with Tukey’s multiple comparisons test. Age-matched naïve brain, and sham (saline) injected tumors included as negative control and tumor baseline control, with the latter represented by the dashed black line, n=3–6 per group with individual values shown. P-values = or < 0.05 are considered statistically significant.
Figure 3.
Figure 3.. AAV6-CXCL9 directed lymphocyte chemotaxis.
(a) Diagrammatic overview of in vitro competitive T lymphocyte chemotaxis assay. (b) Competitive chemotaxis measured as the number of T lymphocytes (CTV+, blue pseudocolor) in either AAV6-EGFP (control, green pseudocolor) transduced GL261 field or AAV6-CXCL9 (RFP+, red pseudocolor) transduced GL261 field at 1- and 24-hours following co-culture. Statistical analyses performed by two-way ANOVA with Sidak’s multiple comparisons test, n=3 per time point, per group. Representative images of competitive chemotaxis shown. Dashed white line represents the lymphocyte-tumor border at assay start. (c) Competitive chemotaxis measured as described in (b) in C8-D1A astrocytes field at 1- and 24-hours following co-culture. (d) Schematic outlining combination AAV6 and PD-1 ICB treatment and tissue collection and survival analysis in preclinical models. Multicolor flow cytometric detection of tumor-infiltrating CD8+ lymphocyte subsets in single or combination AAV6-CXCL9 plus anti-PD-1 ICB treatment in (e) GL261 and (f) KR158 models. AAV6-EGFP and IgG2 mAb control included as treatment controls. Fold-change normalization based on values detected in sham (saline) injected tumor control samples, with mean expression indicated by dashed black line. Statistical analysis performed using ordinary one-way ANOVA with Fisher’s least significant difference (LSD) test for multiple comparisons, n=3–6 per treatment group, individual values shown. Multicolor flow cytometric detection of tumor-infiltrating CD4+ lymphocyte subsets in single or combination AAV6-CXCL9 plus anti-PD-1 immune checkpoint blockade treatment in (g) GL261 and (h) KR158 models. AAV6-EGFP and IgG2 mAb treatment controls included. Fold-change normalization based on values detected in sham (saline) injected tumor control samples, with mean expression indicated by dashed black line. Statistical analysis performed using ordinary one-way ANOVA with Fisher’s LSD test for multiple comparisons, n=3–6 per treatment group, individual values shown. P-values = or < 0.05 are considered statistically significant.
Figure 4.
Figure 4.. AAV6-CXCL9 sensitizes GBM tumors to anti-PD-1 immunotherapy.
Survival analysis in (a) GL261 and (b) KR158 tumor-bearing mice treated with sham (saline) control, AAV6-CXCL9, and anti-PD-1 ICB alone and in combination. AAV6-EGFP and IgG2 are included as treatment controls. Median survival for each treatment group shown n=8 per group. Statistical analysis was performed using Log-rank (Mantel-Cox) test comparing individual treatment groups. (c) Tile-stitch 10× 3D IF imaging of GL261 tumors resected from combination AAV6-CXCL9 plus anti-PD-1 ICB treated GREAT mice. DAPI nuclear dye (blue pseudocolor) used to identify tumor area outlined by the dashed white line. (a’-b’) Digital magnification of regions outlined in the far-left panel to show higher image resolution. Green pseudocolor depicts endogenous EYFP, correlating with IFNγ expression. (d) 3D IF of tissue from GL261 tumor tissue as shown in (c) immunolabeled for CD45 expression (red pseudocolor). Digital zoom of region outlined in the far-right panel shows co-localization between CD45 and IFNγ, indicating these are immune cells. (e) Diagrammatic summary of combination treatment strategy with concomitant CD8α antibody depletion. (f) Flow cytometry detection of lymphocyte subsets isolated from peripheral blood (retro-orbital) collected at day 18 of study. Bar graph depicts the percent of each CD4 T lymphocytes (CD45+CD3+CD4+CD8−) and CD8 T lymphocytes (CD45+CD3+CD4−CD8+) detected within the total CD45+ population of PBMCs. Statistical analyses performed using Sidak’s multiple comparisons test, n=5–8 per group. Individual values shown. (g) Survival analysis in GL261 tumor-bearing mice treated with combination AAV6-CXCL9 plus anti-PD-1 monoclonal antibody, with or without anti-CD8α depletion. Sham (saline) injected GL261 tumors treated with anti-CD8α or control IgG2 included as treatment controls. Statistical analysis performed using Log-rank (Mantel-Cox) test comparing individual treatment groups, n=8 per group. (h) Survival analysis in long-term survivors from combination treated animals re-challenged with tumor at day 55 of study (n=5). Age-matched naïve control mice were orthotopically implanted with GL261 as survival control arm. Statistical analysis was performed using Log-rank (Mantel-Cox) test comparing individual treatment groups. P-values = or < 0.05 are considered statistically significant.
Figure 5.
Figure 5.. Immunological landscape of GBM tumors treated with AAV6-CXCL9 and anti-PD-1 immunotherapy.
UMAP of cell types clustered by scRNA transcriptional analysis of 52,344 CD45+ cells isolated from GL261 tumor bearing mice treated with: (a) sham (saline), (b) AAV6-ctrl + IgG2, (c) AAV6-ctrl + aPD-1, (d) AAV6-CXCL9 + IgG2, and (e) combination AAV6-CXCL9 + aPD-1 treated GL261 tumors, n=3 per group. Summary circle chart depicting cell cluster population frequency detected for each treatment included alongside each UMAP. (f) Summary of UMAP cell clusters. Quantitative change in population frequency of (g) CD8+ T cells, (h) Treg cells, (i) monocytes, and (j) non-classical (n-c) monocytes across treatment groups. Statistical analyses performed using ordinary one-way ANOVA with Fisher’s LSD test for multiple comparisons, n=3 per group, individual values shown.
Figure 6.
Figure 6.. AAV6-CXCL9 and anti-PD-1 immunotherapy stimulates CD8 lymphocyte activation.
(a) Venn Diagram representing differentially expressed genes affiliated with each treatment. (b) Heatmap depicting scRNA-seq-derived cell-cell communication networks enriched or decreased in response to combination AAV6-CXCL9 + aPD-1 as compared to AAV6-CXCL9 + IgG2 treatment across identified cell clusters. (c) Heatmap depicting scRNA-seq-derived cell-cell communication networks enriched or decreased in response to combination AAV6-CXCL9 + aPD-1 as compared to AAV6-EGFP + aPD-1 treatment across identified cell clusters. (d) Waterfall summary plot of scRNA-seq-derived signaling pathways enriched in CD8+ T cells following combination AAV6-CXCL9 + aPD-1 as compared to AAV6-CXCL9 + IgG2 treatment. (e) Waterfall summary plot of scRNA-seq-derived signaling pathways enriched in CD8+ T cells following combination AAV6-CXCL9 + aPD-1 as compared to AAV6-EGFP + aPD-1 treatment. (f) Heatmap representation of gene expression analysis derived from all cell clusters using the nCounter® Immune Exhaustion Panel (nanoString) following AAV6-CXCL9 gene therapy with or without PD-1 ICB. CD8+ T cell populations outlined in black for each treatment group. (g-l) Quantification of common pathways found to be differentially regulated in CD8+ T cells in response to treatment. Statistical analyses performed using Kruskal-Wallis test followed by Dunn’s multiple comparisons, with individual values shown. P-values = or < 0.05 are considered statistically significant.
Figure 7.
Figure 7.
Inflammatory signature of preclinical GBM treated with AAV6-CXCL9 and anti-PD-1 ICB. (a) Heatmap summary of scRNA-seq-derived CCL-CXC expression in CD8+ T cells isolated from GL261 tumors in response to AAV6-CXCL9 and anti-PD-1 ICB treatment created using GraphPad Prism. (b-i) Quantification of CCL-CXC genes found to be differentially expressed in CD8+ T cells in response to treatment. Statistical analyses performed using Kruskal-Wallis test followed by Dunn’s multiple comparisons, with individual values shown. (j) Representative immunoblots depicting chemokine and cytokine protein expression detected in GL261 tumors resected following treatment with AAV6-CXCL9 with and without PD-1 ICB (n=3–4 per group). (k) Heatmap summary of CCL-CXC relative protein expression found to be differentially expressed in response to AAV6-CXCL9 with and without PD-1 ICB, created using GraphPad Prism. (l) Circos interactome analysis of detected differentially expressed proteins and predicted receptors. P-values = or < 0.05 are considered statistically significant.
Figure 8.
Figure 8.
Diagrammatic summary of findings. Intra-tumor delivery of AAV6 encoding CXCL9 results in robust transduction of tumor-reactive astrocytes, creating a chemotactic gradient of secreted CXCL9. This improves lymphocyte trafficking in combination with anti-PD-1 ICB through chemokine-receptor engagement between CXCL9 in the TME and CXCR3 expression on lymphocytes. CD8+ T cells are required for durable survival response to treatment, indicating that tumor cell killing is mediated by the adaptive arm of immunity. Combination treatment also transforms the inflammatory milieu of tumors, creating a pro-inflammatory environment evidenced by the presence of cytokines and chemokines that further promote innate and adaptive immune activation. Created with BioRender.com.

References

    1. Guha P., Heatherton K.R., O’Connell K.P., Alexander I.S. & Katz S.C. Assessing the Future of Solid Tumor Immunotherapy. Biomedicines 10(2022). - PMC - PubMed
    1. Melero I., Rouzaut A., Motz G.T. & Coukos G. T-cell and NK-cell infiltration into solid tumors: a key limiting factor for efficacious cancer immunotherapy. Cancer Discov 4, 522–526 (2014). - PMC - PubMed
    1. Morotti M., et al. Promises and challenges of adoptive T-cell therapies for solid tumours. Br J Cancer 124, 1759–1776 (2021). - PMC - PubMed
    1. Havel J.J., Chowell D. & Chan T.A. The evolving landscape of biomarkers for checkpoint inhibitor immunotherapy. Nat Rev Cancer 19, 133–150 (2019). - PMC - PubMed
    1. Bausart M., Preat V. & Malfanti A. Immunotherapy for glioblastoma: the promise of combination strategies. J Exp Clin Cancer Res 41, 35 (2022). - PMC - PubMed

Publication types