[Preprint]. 2023 Nov 13:2023.11.13.23298409.
doi: 10.1101/2023.11.13.23298409.

Spatial proteo-transcriptomic profiling reveals the molecular landscape of borderline ovarian tumors and their invasive progression

Affiliations

Spatial proteo-transcriptomic profiling reveals the molecular landscape of borderline ovarian tumors and their invasive progression

Lisa Schweizer et al. medRxiv. .

Update in

Abstract

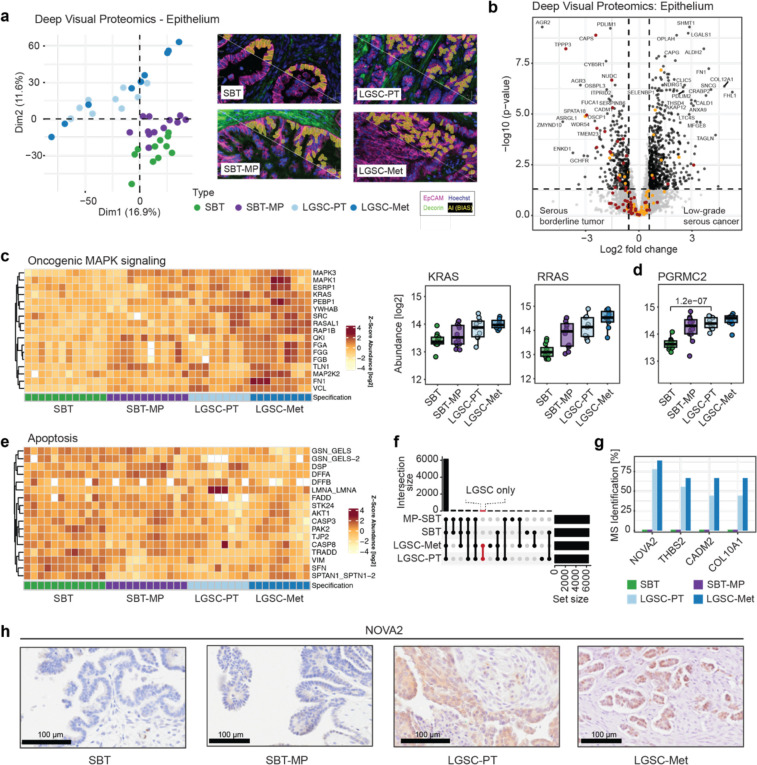
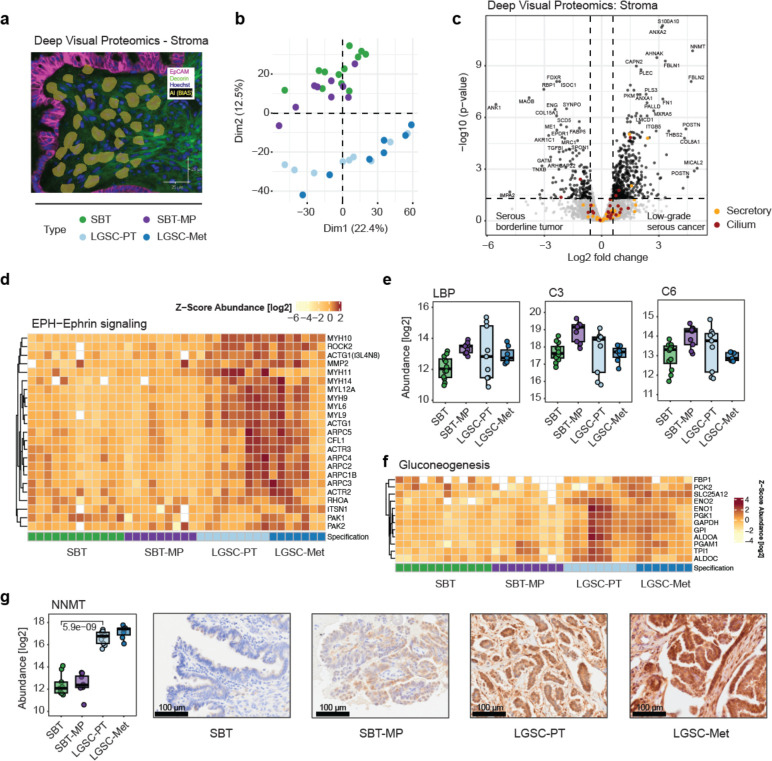
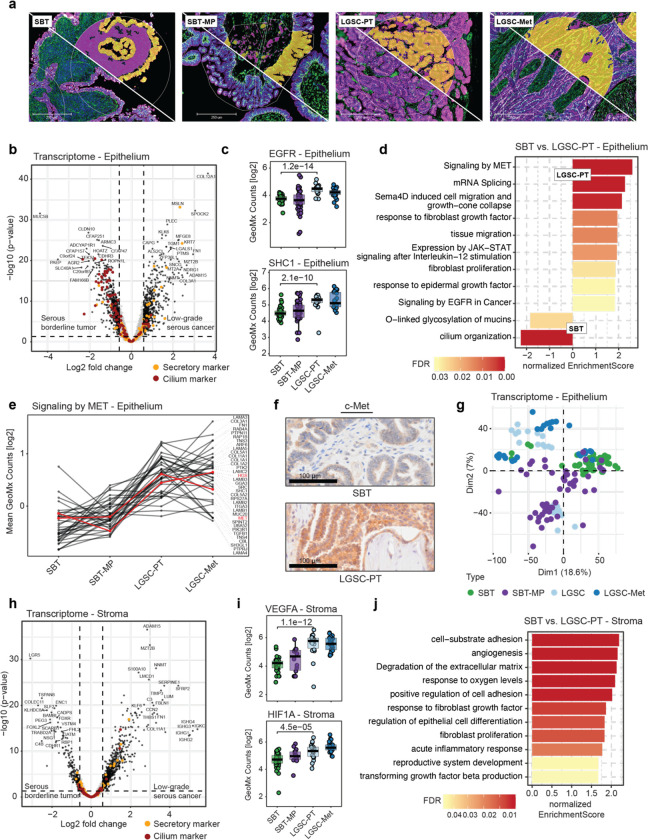
Serous borderline tumors (SBT) are epithelial neoplastic lesions of the ovaries that commonly have a good prognosis. In 10-15% of cases, however, SBT will recur as low-grade serous cancer (LGSC), which is deeply invasive and responds poorly to current standard chemotherapy1,2,3. While genetic alterations suggest a common origin, the transition from SBT to LGSC remains poorly understood4. Here, we integrate spatial proteomics5 with spatial transcriptomics to elucidate the evolution from SBT to LGSC and its corresponding metastasis at the molecular level in both the stroma and the tumor. We show that the transition of SBT to LGSC occurs in the epithelial compartment through an intermediary stage with micropapillary features (SBT-MP), which involves a gradual increase in MAPK signaling. A distinct subset of proteins and transcripts was associated with the transition to invasive tumor growth, including the neuronal splicing factor NOVA2, which was limited to expression in LGSC and its corresponding metastasis. An integrative pathway analysis exposed aberrant molecular signaling of tumor cells supported by alterations in angiogenesis and inflammation in the tumor microenvironment. Integration of spatial transcriptomics and proteomics followed by knockdown of the most altered genes or pharmaceutical inhibition of the most relevant targets confirmed their functional significance in regulating key features of invasiveness. Combining cell-type resolved spatial proteomics and transcriptomics allowed us to elucidate the sequence of tumorigenesis from SBT to LGSC. The approach presented here is a blueprint to systematically elucidate mechanisms of tumorigenesis and find novel treatment strategies.


Conflict of interest statement

Competing interests E.L. receives research funding to study ovarian cancer from Arsenal Bioscience and AbbVie through the University of Chicago unrelated to this work. The authors declare no competing interests in the context of this manuscript.

Figures

Fig. 1 |
Fig. 1 |. Characterization of serous borderline and low-grade ovarian cancer
a) Representative H&E images of the putative transformation sequence from (i) serous borderline tumor (SBT, not invasive) via (ii) micropapillary lesions (SBT-MP) to (iii) low-grade serous cancer-primary tumor (LGSC-PT), and (iv) metastasis (LGSC-Met). The papillary architecture with hierarchical branching pattern is characteristic of SBT. b) Gross pathology of a bilateral borderline tumor and low-grade serous cancer. SBT often present as bilateral adnexal tumors (left). Experimental strategy, bioinformatics and functional studies (right). c) AI-based cell recognition and laser-based dissection in DVP. (i) H&E of an SBT. (ii, iii) Immunofluorescence. Staining for malignant epithelial cells (EpCAM, purple) and stromal (decorin, green) as well as artificial intelligence (AI)-based recognition of tumor cells (yellow – below diagonal line) using the BIAS software. (iii) Morphology of single epithelial cells as recognized by artificial intelligence. (iv) Brightfield image of the same sample in i and ii showing the tissue after single cell extraction. Microdissected epithelial cells (arrows) and stroma (arrowheads). Serous borderline tumor (SBT), micropapillary SBT (MP-SBT), low-grade serous cancer primary tumor (LGSC-PT) and corresponding metastases (LGSC-Met).
Fig. 2 |
Fig. 2 |. Deep Visual Proteomics on the epithelial tumor compartment confirms known and identifies novel pathways in transition of SBT to LGSC
a) Principal Component Analysis (PCA) for the epithelium clearly separates serous borderline tumors, serous borderline tumors with a micropapillary pattern, invasive low grade serous cancer, and corresponding metastasis. This transition is evident in the diagonal of PC1 and PC2 from lower right to upper left. AI-based recognition of epithelial cells using immunofluorescence (EpCAM-purple, decorin-green) below the white diagonal line, followed by AI segmentation (yellow). b) Volcano plot of the differential epithelial protein expression between SBT and LGSC-PT in the epithelial compartment. A fold change cutoff of 1.5 and a q-value cutoff of 0.05 are indicated by vertical and horizontal lines, respectively. Proteins matching the significance for differential regulation (DR) criteria are highlighted in black, markers of secretory cells in orange and ciliated cells in red. c) Proteins of the mitogen-activated protein kinase (MAPK)-signaling pathway show a gradual increase towards LGSC and corresponding metastasis (Heatmap). Commonly altered Ras and Ras-regulating proteins (box plots). d)Boxplots of significantly changed membrane-associated progesterone receptor component 2 (PGRMC2) between the four groups (Student’s T-test). e) Heatmap. Proteins involved in apoptosis show reduced abundance from SBT to LGSC-Met. f) Upset plot. Comparison of MS-detected peptides/proteins detected in specific groups but completely absent in others and therefore not included in Fig. 1e and 2b (methods). The set size is the number of identified proteins, while the intersection size shows the number of overlapping proteins. g) Bar plot of the protein subset highlighted in (f). Bars present the percentage of samples in which the four most frequent proteins were identified per group using mass spectrometry. NOVA2 was solely detectable in more than 75% of LGSC-PT and LGSC-Met, but not in SBT and SBT-MP. h) Immunohistochemistry for NOVA2.
Fig. 3 |
Fig. 3 |. Deep Visual Proteomics of the stromal compartment uncovers a bimodality in the transition of SBT to LGST
a) Immunofluorescence outlining the extraction of cell equivalents from the stroma (EpCAM-purple, decorin-green, AI-segmentation - yellow). b) Principal Component Analysis comparing stromal protein expression shows the separation of serous borderline and micropapillary tumors from invasive low grade serous cancer and corresponding metastases. The variability was most evident in dimension 2 (12.5%). c) Volcano plot of differential stroma protein expression between SBT and LGSC-PT in the epithelial compartment. A fold change cutoff of 1.5 and a q-value cutoff of 0.05 are indicated by vertical and horizontal lines, respectively. Proteins matching the significance for differential regulation (DR) criteria are highlighted in black, markers of secretory in orange and ciliated cells in red. d) Proteins that are involved in actin-rearrangement suggested by ephrin (EPH) signaling show an increase towards LGSC and corresponding metastasis in the stromal compartment. e) Boxplots of proteins involved in acute inflammation and the complement system across the transition. f) Proteins involved in gluconeogenesis show an increase towards LGSC and corresponding metastasis. g) NNMT protein abundance (left) and immunohistochemistry (right).
Fig. 4 |
Fig. 4 |. Spatial transcriptomics of SBT and LGSC
a) Immunofluorescence for pan-cytokeratin (purple), decorin (green), and nuclei (blue) for exemplary regions. Tumor and stroma compartments for subsequent UV illumination are shown above the white diagonal line in yellow and magenta, respectively. Regions of interest are outlined with fine white lines. b) Epithelium. Differential transcript abundance of borderline versus low-grade serous cancer (Volcano plot). Protein markers for ciliated and secretory cells are highlighted in orange and red, respectively. c) GeoMx counts for EGFR and SHC1 transcripts across the progression series (Student’s t-test). d) GSEA biological pathway enrichment analysis based on the spatial transcript results comparing SBT and LGSC-PT in the epithelial compartment (Pathway REACTOME, Gene Ontology Biological Processes) on the comparison in (b). e) Profile plot of pathway-associated proteins determined in (d) for ‘Signaling by MET’. Proteins with critical roles in the pathway (MET, HGS) are annotated in red. All other proteins are summarized in Supplementary Table 8. f) IHC of c-MET in SBT and LGSC-PT. g) Nanostring Principal Component Analysis using transcripts in the epithelium for the indicated histologies. h) Stroma. Differential transcript abundance of SBT versus LGSC-PT. Protein markers for ciliated and secretory cells are highlighted in orange and red, respectively. i) GeoMx counts for VEGFA and HIF1α across the progression series (Student’s t-test). j) GSEA biological pathway enrichment analysis using the spatial transcript results in SBT and LGSC-PT in the stromal compartment (Pathway REACTOME, Gene Ontology Biological Processes) on the comparison in (h).
Fig. 5 |
Fig. 5 |. Integration of spatial transcriptomics and proteomics
a) Multi-layer integration of Deep Visual Proteomics and spatial transcriptomics for the four histologic subtypes. (i) H&E, (ii) spatial transcriptomics regions of interest, (iii) Deep Visual Proteomics including AI based cell recognition/segmentation, and (iv) brightfield image after DVP laser microdissection. Immunofluorescence showing malignant epithelial cells (EpCAM, purple) and stroma (decorin, green) in both spatial proteomics and transcriptomics (ii, iii). AI-based recognition in the DVP or Nanostring technology is shown in yellow (tumor compartment) and magenta (stromal compartment in spatial transcriptomics), respectively. Microdissected epithelial cells (black arrows) and stroma (arrowheads) (iv). ROIs of spatial transcriptomics matched to the previously selected regions. The top layer of the visual integration (left panel) shows the laser microdissected cells in different regions for the epithelium (blue/yellow/red) and in the stroma (purple/orange/green) used in DVP. b, c) Correlation of protein and transcript expression comparing spatial proteomics and transcriptomics. Genes that are significantly correlated are in black and are above the dashed line (Pearson coefficient ≥ 0.05). A negative correlation coefficient indicates opposite trends of protein and transcript expression. Anticorrelating genes discussed in the text are annotated in blue. Significant genes among the set of 70 of biological interest are highlighted in red and annotated in black (see also Extended Data 12).
Fig. 6 |
Fig. 6 |. Functional studies characterizing the significant ‘omics’ genes and pathways in the transitions of SBT to LGSC
a) Pearson coefficient. Correlation analysis of protein expression (DVP) from SBT (left) and LGSC (right) human epithelial tissue compared to epithelial LGSC cell lines. Cell lines of highest similarity are highlighted in black. b) siRNA screening of 23 priority genes (Fig. 5) using the LGSC cell line VOA4627 measuring cell migration. Box plots +/− standard deviation. c) Validation of the most promising siRNA hits in the LGSC cell line VOA4627 measuring proliferation (left) and invasion (right). d) Inhibitor testing in VOA4627 proliferation (left) and invasion (right). e) VOA4627 cells were treated with either condition media from immortalized human CAFs where NNMT was inhibited using shRNA (shNNMT CAF CM), shRNA control transfected CAF condition media (shCtrl CAF CM) or control media (Ctrl M). f) Nude mice were injected intraperitoneal with the VOA6406ip1 cell line at day 0. Treatment of mice started at day 11 and was continued daily with either the NNMTi, the inactive enantiomer or vehicle control biweekly and tumor volume measured from 11–40 days after cancer cell injection. All growth curves and bar graphs show mean +/− SEM. The data presented in c-e was repeated in 3 independent experiments. Significance levels by p-value: * 0.05, ** 0.01, ***, 0.001, *** 0.0001. g) Schematic summary on pathways and distinct proteins/transcripts involved in the transition from SBT to LGSC.

References

    1. Gershenson D. M. et al. Recurrent low-grade serous ovarian carcinoma is relatively chemoresistant. Gynecol Oncol 114, 48–52 (2009). - PubMed
    1. Gershenson D. M. et al. Hormonal Maintenance Therapy for Women With Low-Grade Serous Cancer of the Ovary or Peritoneum. J. Clin. Oncol., JCO2016710632 (2017). - PMC - PubMed
    1. Tang M. et al. PARAGON: A Phase II study of anastrozole in patients with estrogen receptorpositive recurrent/metastatic low-grade ovarian cancers and serous borderline ovarian tumors. Gynecol. Oncol. 154, 531–538 (2019). - PubMed
    1. Singer G. et al. Patterns of p53 mutations separate ovarian serous borderline tumors and low- and high-grade carcinomas and provide support for a new model of ovarian carcinogenesis: A mutational analysis with immunohistochemical correlation. American Journal of Surgical Pathology 29, 218–224 (2005). - PubMed
    1. Mund A. et al. Deep Visual Proteomics defines single-cell identity and heterogeneity. Nat. Biotechnol. (2022). - PMC - PubMed

Publication types