[Preprint]. 2023 Nov 13:2023.11.09.566494.
doi: 10.1101/2023.11.09.566494.

Genome folding principles revealed in condensin-depleted mitotic chromosomes

Affiliations

Genome folding principles revealed in condensin-depleted mitotic chromosomes

Han Zhao et al. bioRxiv. .

Update in

Abstract

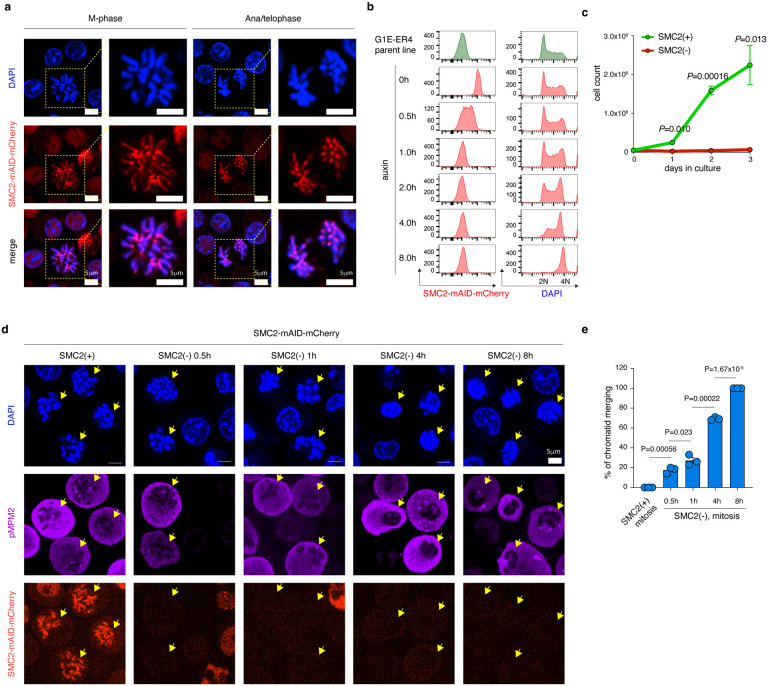
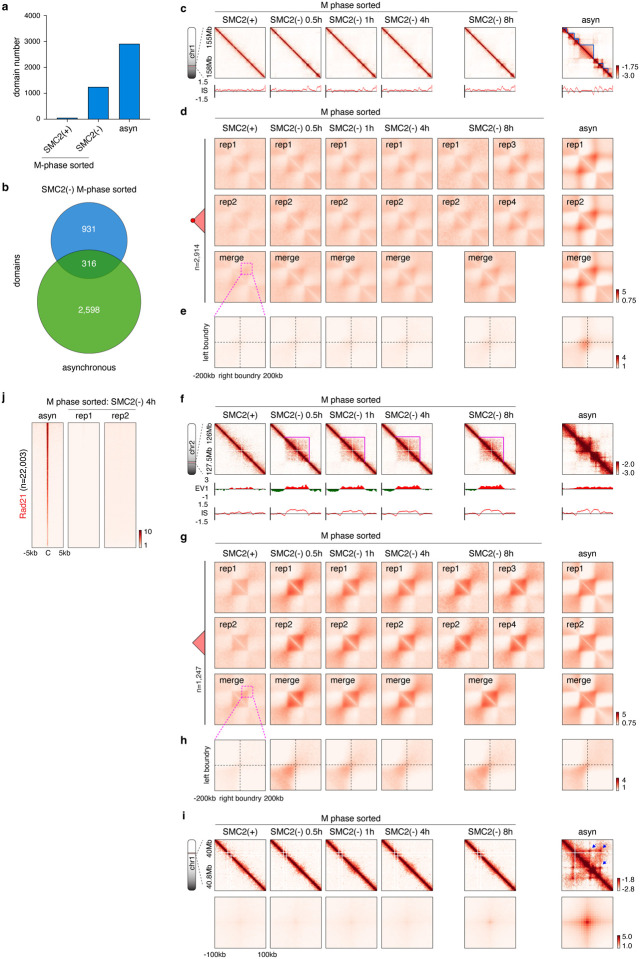
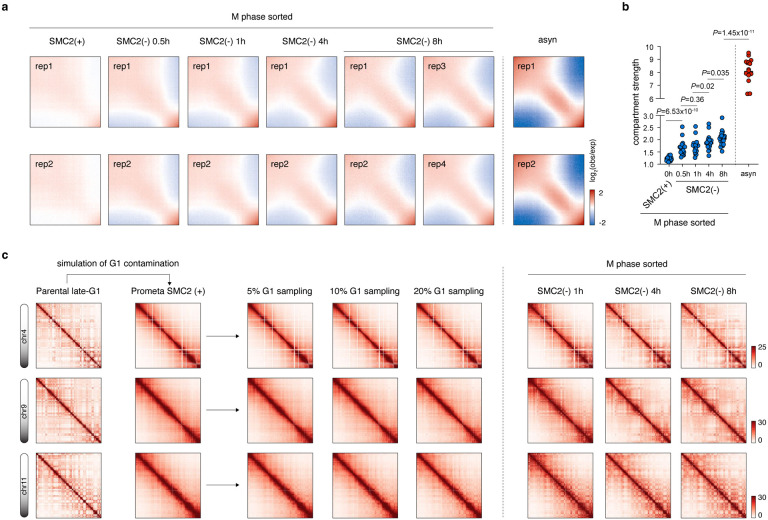
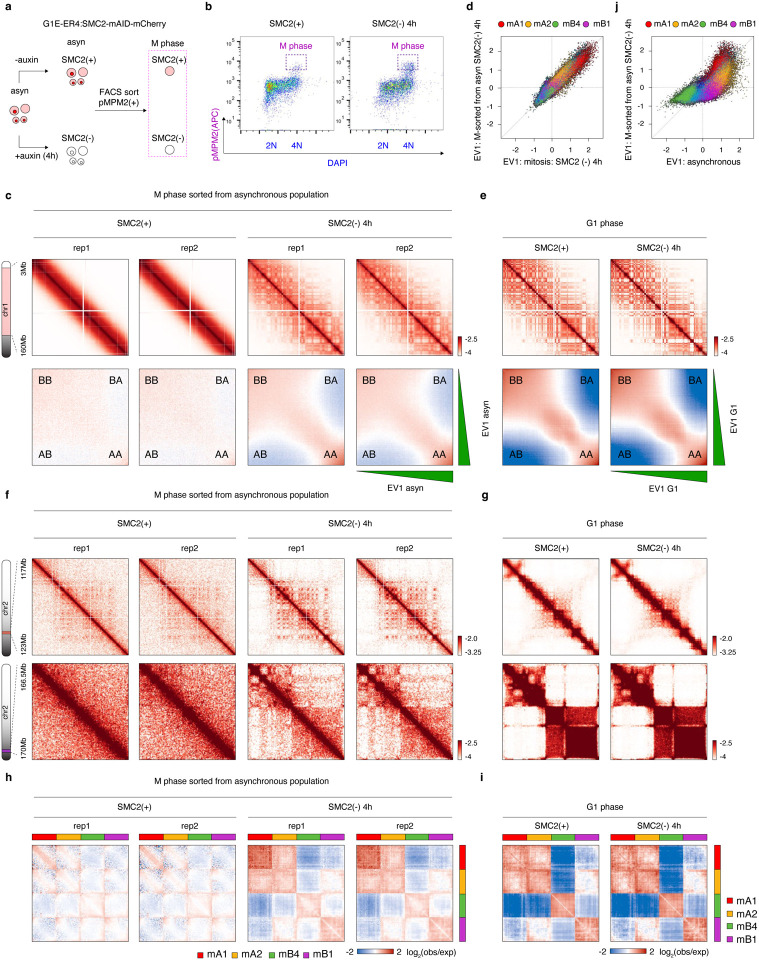
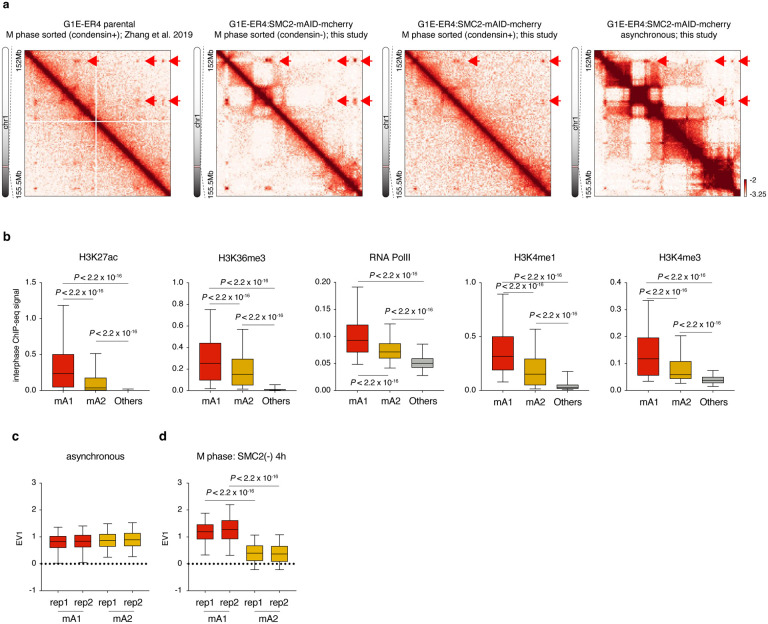
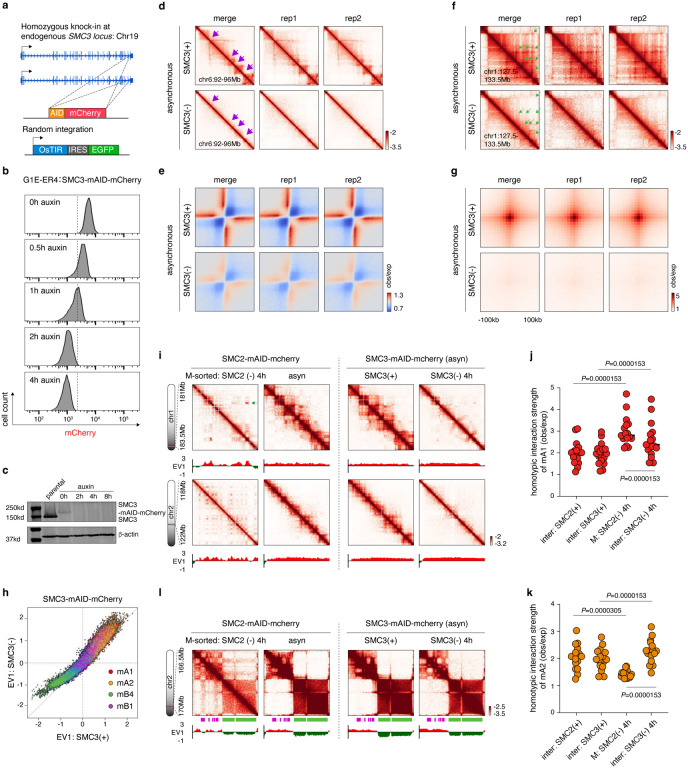
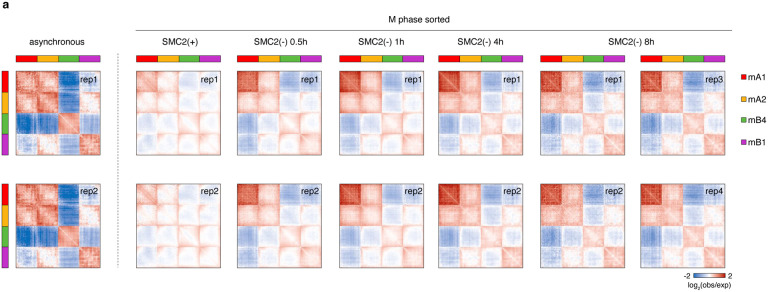
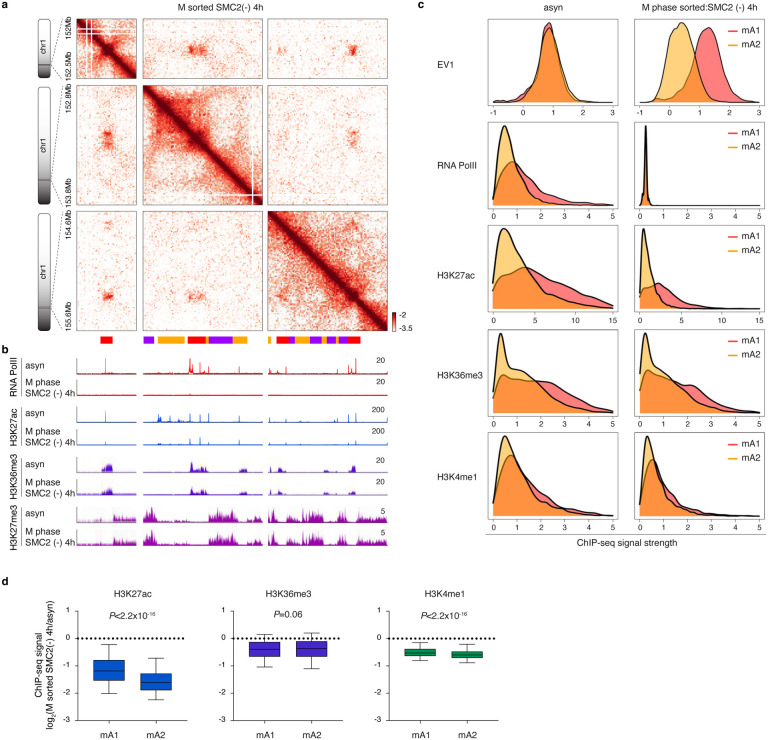
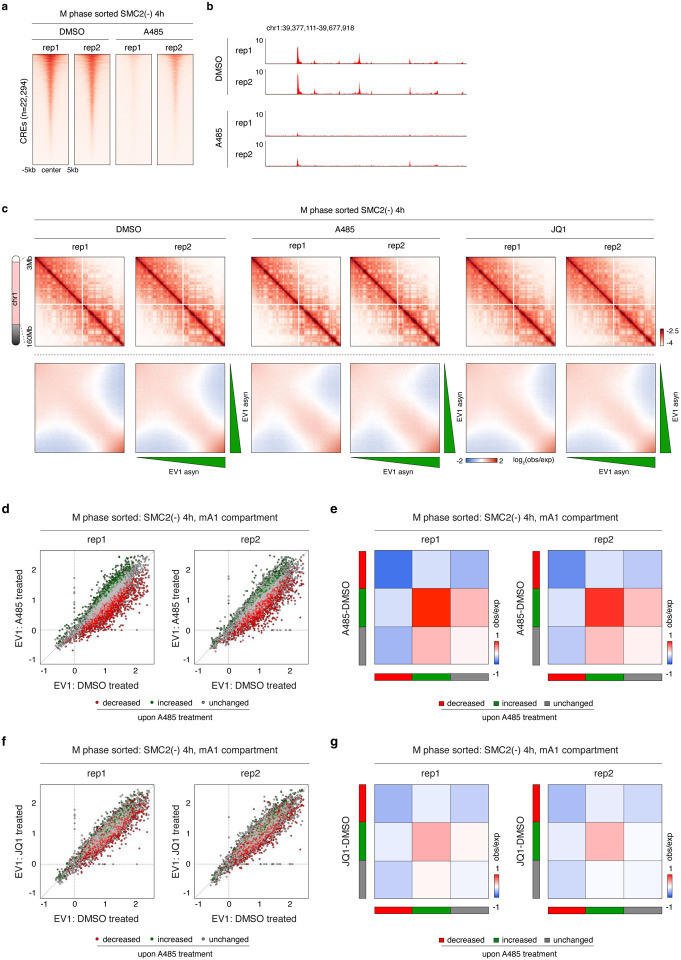
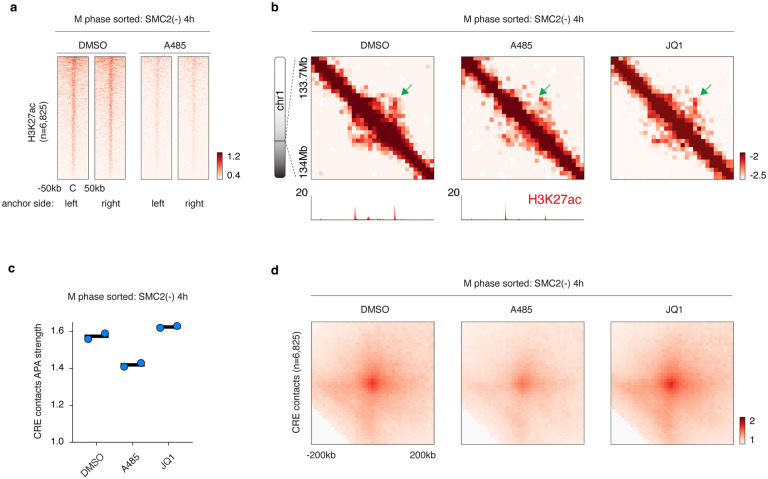
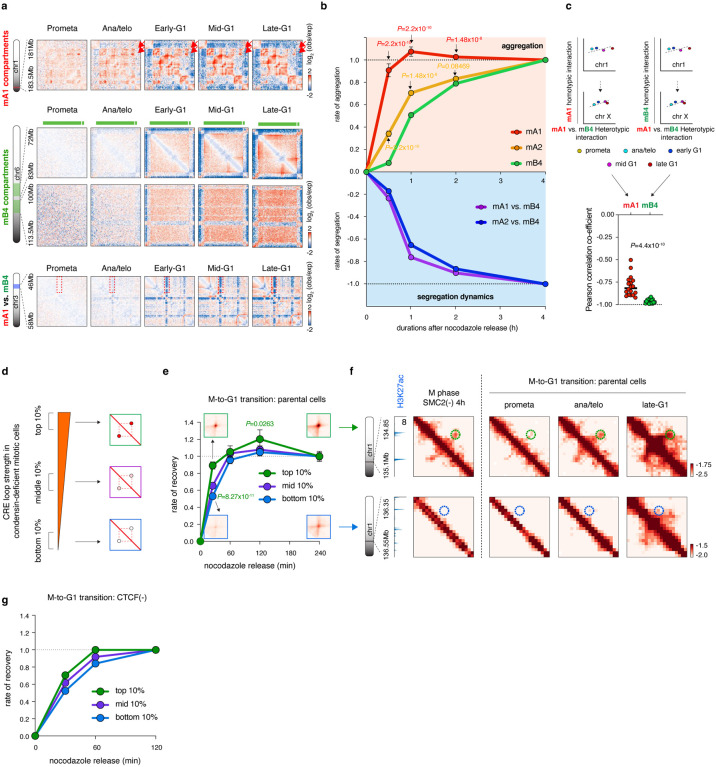
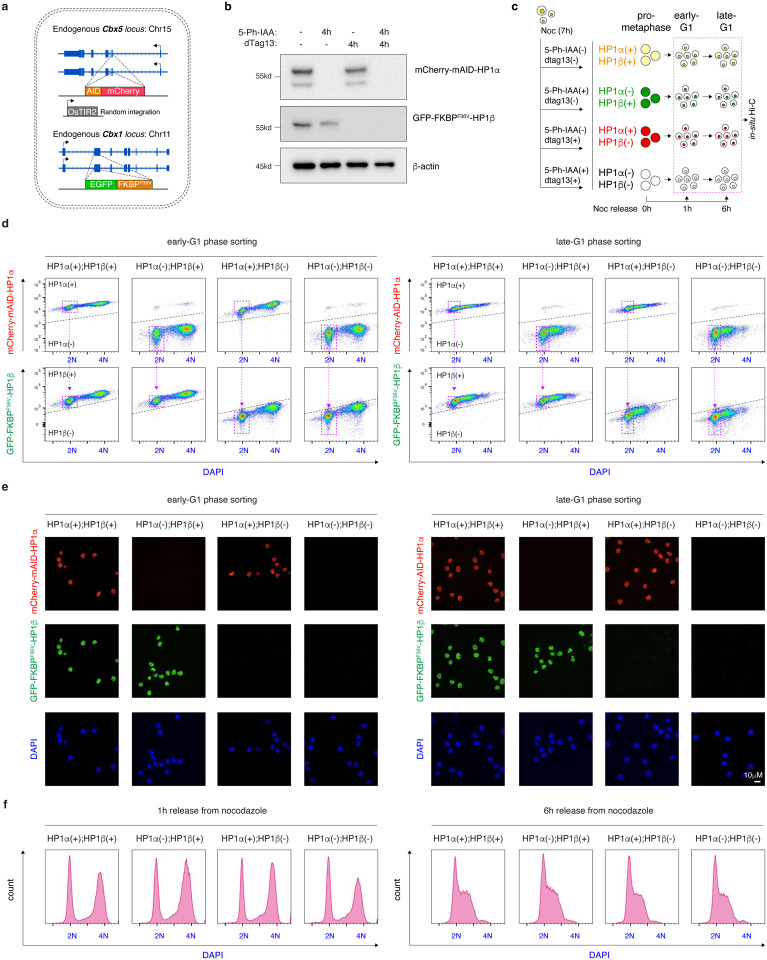
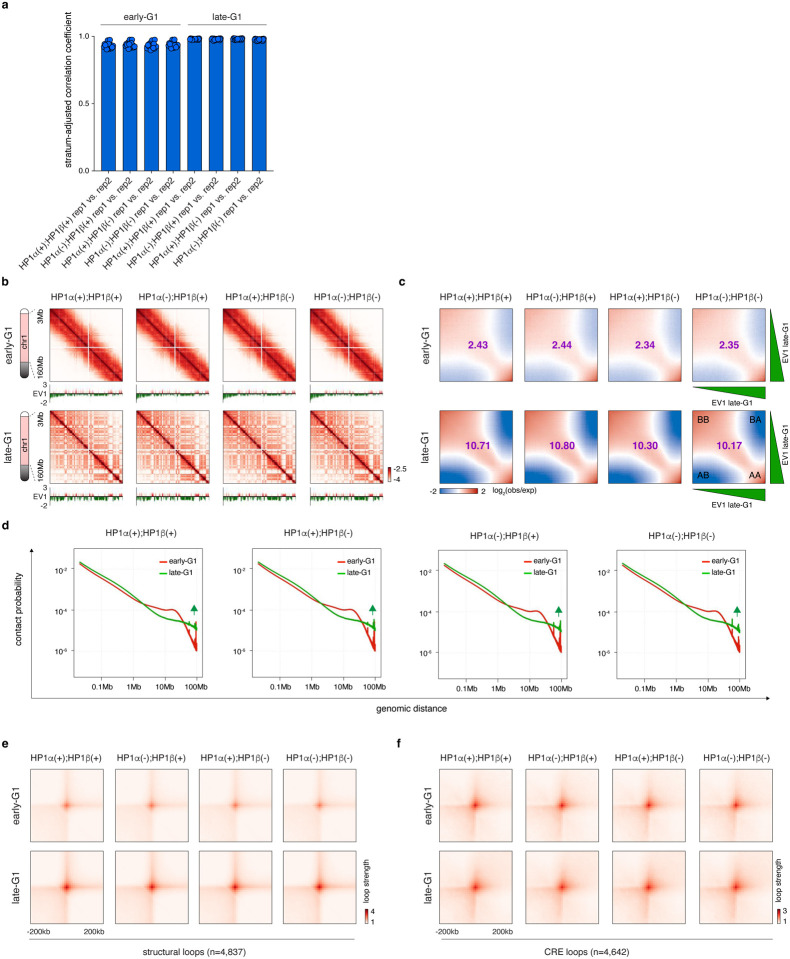
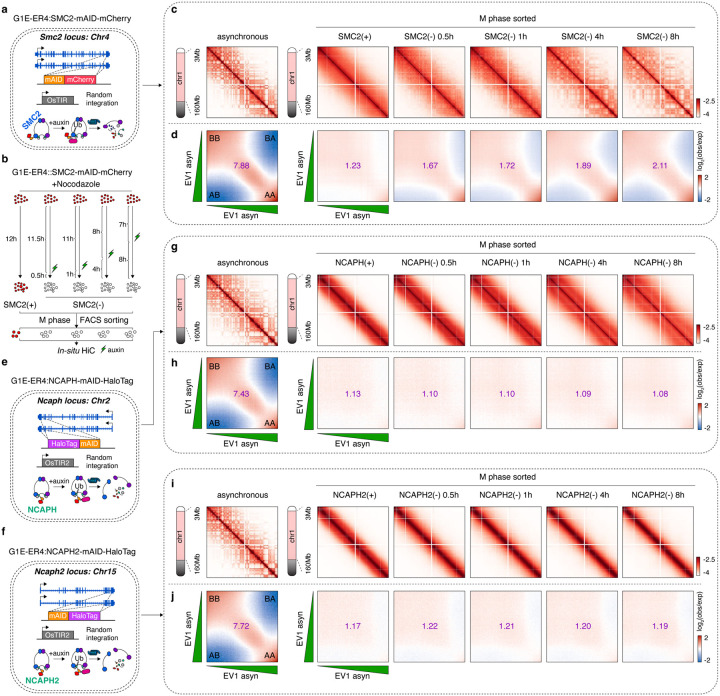
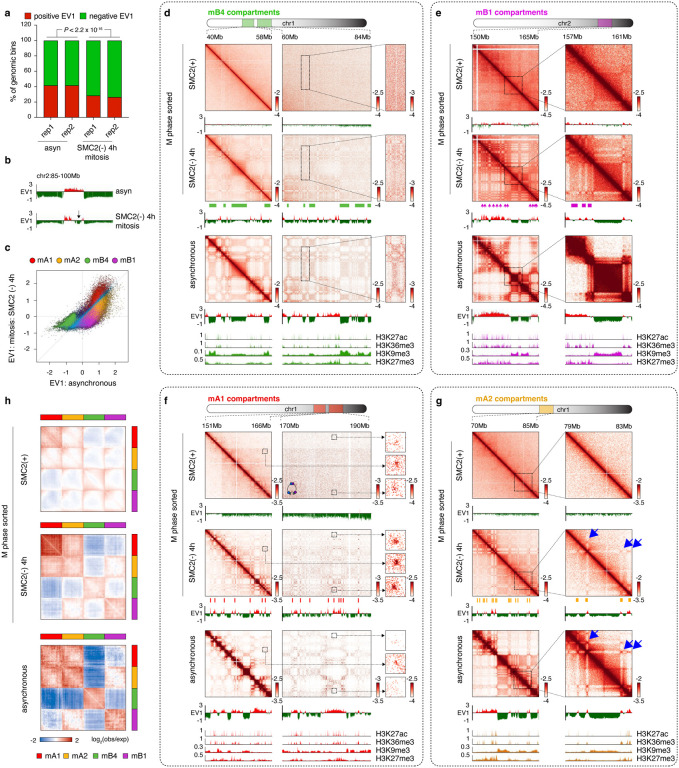
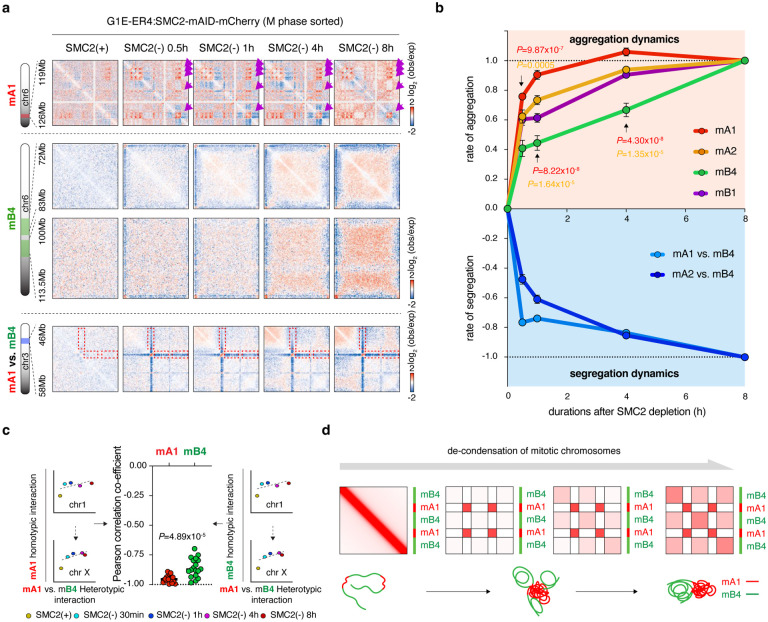
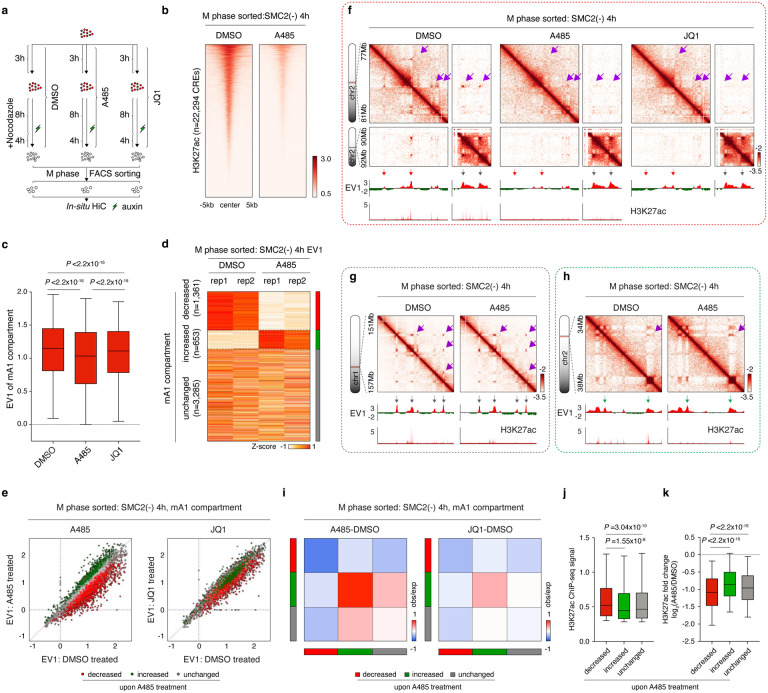
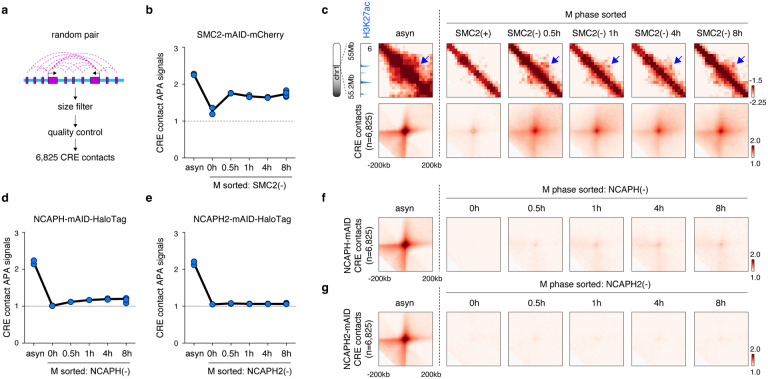
During mitosis, condensin activity interferes with interphase chromatin structures. Here, we generated condensin-free mitotic chromosomes to investigate genome folding principles. Co-depletion of condensin I and II, but neither alone, triggered mitotic chromosome compartmentalization in ways that differ from interphase. Two distinct euchromatic compartments, indistinguishable in interphase, rapidly emerged upon condensin loss with different interaction preferences and dependence on H3K27ac. Constitutive heterochromatin gradually self-aggregated and co-compartmentalized with the facultative heterochromatin, contrasting with their separation during interphase. While topologically associating domains (TADs) and CTCF/cohesin mediated structural loops remained undetectable, cis-regulatory element contacts became apparent, providing an explanation for their quick re-establishment during mitotic exit. HP1 proteins, which are thought to partition constitutive heterochromatin, were absent from mitotic chromosomes, suggesting, surprisingly, that constitutive heterochromatin can self-aggregate without HP1. Indeed, in cells traversing from M- to G1-phase in the combined absence of HP1α, HP1β and HP1γ, re-established constitutive heterochromatin compartments normally. In sum, "clean-slate" condensing-deficient mitotic chromosomes illuminate mechanisms of genome compartmentalization not revealed in interphase cells.


Conflict of interest statement

DECLARATION OF INTERESTS The authors declare no competing interests.

Figures

Extended Data Figure 1.
Extended Data Figure 1.. Characterization of the G1E-ER4:SMC2-AID-mCherry cell line.
a, Left panel: representative image showing the condensation of mitotic chromosomes and correct nuclear localization of SMC2-mAID-mCherry fusion protein. Scale bar: 5μm. Right panel: representative image showing the correct separation of chromatids during ana/telophase. Scale bar: 5μm. Three independent experiments replicates were performed. b, Left panel: flow cytometry plots showing the rapid degradation of SMC2-mAID-mCherry fusion protein upon auxin treatment. Right panel: flow cytometry plot showing the shift of cell cycle distribution upon long-term auxin treatment. Two independent experiments were performed. c, Growth curve of G1E-ER4:SMC2-mAID-mCherry cells with or without auxin treatment. Error bar denotes SEM (n=3). P values were calculated using a two-sided student’s t test. d, Representative image showing the morphology of mitotic chromosomes after auxin treatment for indicated durations. Cells were stained with anti-pMPM2 antibody to indicate mitotic population. Scale bar: 5μm. Three independent experiments were performed. e, Bar graph showing the percentage of mitotic cells with extensive chromatid entanglements after auxin treatment for indicated durations. Error bar denotes SEM (n=3). P values were calculated using a two-sided student’s t test.
Extended Data Figure 2.
Extended Data Figure 2.. Purification of condensin-deficient mitotic cells.
a, Flow cytometry plot showing the gating strategy to purify mitotic cells at different time points after addition of auxin. Cells were sorted by pMPM2, DAPI and mCherry signals. More than two independent experiments were performed. b, Bar graph showing the high stratum-adjusted correlation coefficient for each chromosome (n=19) between biological replicates for each condition. c, KR balanced Hi-C contact matrices (chr2 vs. chr3) showing the gradual increase of trans-chromosome interactions over time upon condensin loss. d, Dot plot showing the percentage of tran-chromosome interactions for independent biological replicates at each tested time point. n=2 for SMC2(+), 0.5h, 1h and 4h auxin treated samples. n=4 for 8h auxin treated samples.
Extended Data Figure 3.
Extended Data Figure 3.. TADs and structural loops are not resumed in condensin-deficient mitotic cells.
a, Bar graph showing the number of domains identified in control mitotic, SMC2 deficient mitotic and asynchronous cells. b, Venn-diagram showing the intersection results of domains for SMC2 deficient mitotic samples and asynchronous control samples. c, KR-balanced Hi-C contact maps showing representative domains (chr1:155–158Mb) identified in asynchronously growing cells. Bin size: 10kb. Browser tracks of insulation score profiles were shown. TAD was highlighted by blue lines. d, Composite contact plots of the rescaled 2,914 domains identified in asynchronous cells. Plots for independent biological replicates as well as replicate-merged samples were shown. e, Aggregated peak analysis showing the strong summit corner dots for domains identified in the asynchronous control cells. f, KR-balanced Hi-C contact maps showing the emergence of a representative domains (chr2:126–127.5Mb) in the SMC2 deficient mitotic cells. Bin size: 10kb. Browser tracks of EV1 values and insulation score profiles were shown. Domain was highlighted by pink lines. g, Composite contact plots of the rescaled 1,247 domains identified in SMC2 deficient mitotic cells. Plots for independent biological replicates as well as replicate-merged samples were shown. h, Aggregated peak analysis showing lack of summit corner dots for domains identified in the SMC2 deficient mitotic cells. i, Upper panel: KR-balanced Hi-C contact maps showing representative structural loops (chr1:40–40.8Mb) in condensin deficient mitotic cells and asynchronous control cells. Bin size: 10kb. Lower panel: Aggregated peak analysis for structural loop signals (n=4,837) in the SMC2 deficient mitotic cells. j, Density heatmaps showing loss of cohesin positioning in the condensin-deficient (4h) mitotic cells.
Extended Data Figure 4.
Extended Data Figure 4.. Progressively strengthened compartments in mitotic cells upon condensin loss.
a, Saddle plot of independent biological replicates of asynchronous and condensin deficient mitotic cells. b, Dot plot showing progressive gain of compartmental strength of each individual chromosome (n=20). P values were calculated using a two-sided paired Wilcoxon signed-rank test. c, Raw Hi-C contact matrices showing the results of in-silicon simulation of various level of G1 contamination in mitotic control cells. Note that even 20% of G1 contamination, failed to show as strong compartmentalization as mitotic cells without condensin.
Extended Data Figure 5.
Extended Data Figure 5.. Compartmentalization of mitotic chromosomes from asynchronous population.
a, Schematic showing the sorting strategy of condensin-deficient and control mitotic cells from asynchronous populations. b, Flow cytometry plot showing the gating strategy to purify mitotic cells from asynchronous population. Two independent experiments were performed. c, Upper panel: KR balanced Hi-C contact matrices (chr1:3–160Mb) of condensin-deficient (4h) and control mitotic cells from asynchronous population. Bin size: 100kb. Lower panel: Saddle-plots showing the compartment strength in the condensin-deficient (4h) and mitotic cells from asynchronous population. Each biological replicate is shown. d, Scatter plot showing the high correlation of EV1 values between condensin-deficient (4h) mitotic cells from nocodazole arrested (x-axis) vs. asynchronous populations (y-axis). e, Upper panel: KR balanced Hi-C contact matrices (chr1:3–160Mb) of condensin-deficient (4h) and control G1 phase cells. Bin size: 100kb. Lower panel: Saddle-plots showing the compartment strength in the condensin-deficient (4h) and control G1 mitotic cells. f, Upper panel: KR balanced Hi-C contact maps (chr2:117–123Mb) showing representative mA1 homotypic interactions in condensin-deficient (4h) mitotic cells from asynchronous population. Lower panel: KR balanced Hi-C contact maps (chr2:156.5–170Mb) showing mB1 and mB4 co-compartmentalization in condensin-deficient (4h) mitotic cells from asynchronous population. Bin size: 25kb. g, KR balanced Hi-C contact maps showing the same regions in (f) in condensin-deficient (4h) and control G1 phase cells. Bin size: 25kb. h, Attraction-repulsion plots of condensin-deficient (4h) and control mitotic cells from asynchronous population. Each biological replicate is shown. i, Attraction-repulsion plots of condensin-deficient (4h) and control G1 cells. j, Scatter plot showing the EV1 values of 25kb genomic bins in asynchronous control cells (x-axis) against condensin-deficient (4h) mitotic cells from asynchronous population (y-axis). Bins were color coded based on their compartment assignment.
Extended Data Figure 6.
Extended Data Figure 6.. Characterization of G1E-ER4:NCAPH-mAID-HaloTag and G1E-ER4:NCAPH2-mAID-HaloTag cell lines.
a, Representative image showing the correct localization of NCAPH-mAID-HaloTag fusion protein (Halo-646) in mitosis and ana/telophase. Scale Bar: 5μm. Two independent experiments were performed. b, Representative image showing the correct localization of NCAPH2-mAID-HaloTag fusion protein (Halo-646) in mitosis and ana/telophase. Scale Bar: 5μm. Two independent experiments were performed. c, Flow cytometry plots showing the rapid degradation of NCAPH-mAID-HaloTag and NCAPH2-mAID-HaloTag upon 5-Ph-IAA treatment. Two independent experiments were performed. d, Representative image showing the morphology of mitotic chromosomes after NCAPH degradation for indicated durations. Scale Bar: 5μm. Two independent experiments were performed. e, Representative image showing the morphology of mitotic chromosomes after NCAPH2 degradation for indicated durations. Scale Bar: 5μm. Two independent experiments were performed. f, Flow cytometry showing the cell cycle distribution after NCAPH or NCAPH2 are degraded for indicated durations. Two independent experiments were performed.
Extended Data Figure 7.
Extended Data Figure 7.. Characterization of NCAPH or NCAPH2 deficient mitotic chromosomes.
a, KR balanced Hi-C contact matrices (chr2 vs. chr3) showing trans-chromosome interactions in mitotic cells upon NCAPH depletion. Bin size: 100kb. b, Dot plot showing the percentage of tran-chromosome interactions for independent biological replicates in NCAPH deficient mitotic cells. c, KR balanced Hi-C contact matrices (chr2 vs. chr3) showing trans-chromosome interactions in mitotic cells upon NCAPH2 depletion. Bin size: 100kb. d, Dot plot showing the percentage of tran-chromosome interactions for independent biological replicates in NCAPH2 deficient mitotic cells. e, P(s) curve showing progressive reconfiguration of mitotic chromosomes after NCAPH loss. f, Left panel: P(s) curve showing progressive reconfiguration of mitotic chromosomes after NCAPH2 loss. Right panel: enlarged plot of left panel showing genomic separations between 10–30Mb. g, Chromatin spread analysis showing the mitotic chromosome morphology in control and NCAPH2 deficient (4h) cells. Scale Bar: 5μm
Extended Data Figure 8.
Extended Data Figure 8.. Initial clustering of mitotic specific compartments based on EV1 values.
a, Scatter plot showing the EV1 values of 25kb genomic bins in asynchronous control cells (x-axis) against condensin-deficient (4h) mitotic cells (y-axis). Bins belong to group I, II and III were marked by red, blue and green colors respectively. b-f, Scatter plot showing the enrichment of indicated histone modification intensity or RNA Polymerase binding intensity for 25kb genomic bins (group I and II) in asynchronous control cells (x-axis) against condensin-deficient (4h) mitotic cells (y-axis). i, Heatmap showing the clustering result to group the genome into different mitotic specific compartments. The upper panel describes results from the initial clustering based on EV1 values. The lower panel illustrates the second step of clustering using chromatin-associating features.
Extended Data Figure 9.
Extended Data Figure 9.. Additional examples of mA1-, mB4- and mB1-compartments in a single view of Hi-C contact map.
a, KR balanced Hi-C contact matrices showing a genomic locus (chr5:110–135Mb) to illustrate homotypic and heterotypic interactions of compartment mA1, mB4 and mB1 in control mitosis, condensin-deficient (4h) mitosis and asynchronous control samples (replicate 1). Homotypic interactions of mA1 (chr5:121–127Mb) and mB1 (chr5:116–121Mb) compartments as well as heterotypic interactions between mB4 and mB1 (chr5:116–121Mb vs. chr5:121–127Mb) compartments were highlighted by dotted boxes. Bin size: 25kb. mA1, mB4 and mB1 compartments were indicated by red, green and purple bars respectively. Browser tracks of EV1 values for each condition as well as H3K27ac, H3K36me3, H3K9me3 and H3K27me3 from asynchronously growing cells were shown. b, Similar to (a) showing Hi-C maps of biological replicate 2.
Extended Data Figure 10.
Extended Data Figure 10.. Characterization of repressive compartments in the condensin-deficient mitotic cells.
a, Pie chart showing the fraction of different mitotic compartments in the genome. b, Bar graph showing the percentage of genomic bins with inverted EV1 values during mitosis in each type of compartments. P values were calculated using a two-sided Fisher’s exact test. c, Schematic illustration showing how to generate the chromosome-location dependent attraction-repulsion curve. d, Pseudo-data showing analytical results of (c). e, Chromosome-location dependent attraction-repulsion curve between mB1 and mB4 compartments for condensin-deficient (4h) mitotic and asynchronous cells.
Extended Data Figure 11.
Extended Data Figure 11.. Characterization of active compartments in the condensin-deficient mitotic cells.
a, KR balanced Hi-C contact matrices showing the prominent interactions among mA1 compartment (chr1:152–155.5Mb) in the condensin replete mitotic samples (from this study and a prior study by Zhang et al.) as well as condensin-deficient (4h) mitotic samples and asynchronous samples. b, Box-plots showing the enrichment of indicated chromatin associating features (histone modification and transcription) for mA1 (n=5,299 genomic bins), mA2 (n=11,531 genomic bins) compartments and the rest of the genome (n=77,997 genomic bins). For all box plots, central lines denote medians; box limits denote 25th–75th percentile; whiskers denote 5th–95th percentile. P values were calculated using a two-sided Wilcoxon signed-rank test. c, Box-plots showing the asynchronous EV1 values for mA1 (n=5,299 genomic bins) and mA2 (n=11,531 genomic bins) compartments for both biological replicates. For all box plots, central lines denote medians; box limits denote 25th–75th percentile; whiskers denote 5th–95th percentile. c, Box-plots showing the EV1 values for mA1 (n=5,299 genomic bins) and mA2 (n=11,531 genomic bins) compartments in the condensin-deficient (4h) mitotic cells for both biological replicates. For all box plots, central lines denote medians; box limits denote 25th–75th percentile; whiskers denote 5th–95th percentile. P values were calculated using a two-sided Wilcoxon signed-rank test.
Extended Data Figure 12.
Extended Data Figure 12.. Comparison of the “extrusion-free” mitotic and interphase chromatin.
a, Schematic illustration showing homozygous insertion of mAID-mCherry tag at the C terminus of endogenous SMC3. b, Flow-cytometry showing the rapid degradation of SMC3 upon auxin treatment. Two independent experiments were performed. c, Western blot showing the degradation of SMC3 upon auxin treatment. One experiment was performed. d, KR balanced Hi-C contact matrices (chr6:92–96Mb) showing the loss of TADs boundaries upon SMC3 depletion. Contact maps of both biological replicates and replicate-merged samples were shown. Bin size: 10kb. TAD boundaries were indicated by purple arrows. e, Composite contact map of TAD boundary showing reduced insulation after SMC3 depletion. f, KR balanced Hi-C contact matrices (chr1:127.5–133.5Mb) showing elimination of chromatin loops upon SMC3 depletion. Contact maps of both biological replicates and replicate-merged samples were shown. Bin size: 10kb. Chromatin loops were indicated by green arrows. g, APA plots showing disappearance of structural loops upon SMC3 loss. h, Scatter plot showing the EV1 values of 25kb genomic bins in SMC3 (+) (x-axis) against SMC3 (−) G1 phase cells (y-axis). Bins were color coded by their compartment assignment. i, KR balanced Hi-C contact matrices (chr1:181–183.5Mb and chr2:118–112Mb) showing mild increase of mA1 homotypic interactions after SMC3 loss. Bin size: 25kb. Browser tracks of EV1 values were shown. j, Dot plot showing the strength of mA1 homotypic interactions in indicated samples. Each dot represents an individual chromosome (n=17). P values were calculated using a two-sided paired Wilcoxon signed-rank test. k, Dot plot showing the strength of mA2 homotypic interactions in indicated samples. Each dot represents an individual chromosome (n=17). P values were calculated using a two-sided paired Wilcoxon signed-rank test. l, KR-balanced Hi-C contact matrices (chr2:166.5–170Mb and chr2:118–112Mb) showing the lack of mB1-to-mB4 interactions in interphase cells without SMC3. mB1 and mB4 compartments were highlighted by purple and green bars respectively. Browser tracks of EV1 values were shown. Bin size: 25kb.
Extended Data Figure 13.
Extended Data Figure 13.. Dynamics of mitotic compartmentalization upon condensin loss.
a, Attraction-repulsion plots showing the homotypic and heterotypic interactions among four different compartments: mA1, mA2, mB4 and mB1. Plots for biological replicates of control mitotic, condensin-deficient mitotic (all tested time points) and asynchronous cells were shown.
Extended Data Figure 14.
Extended Data Figure 14.. Epigenetic landscape of mitotic chromosomes in the absence of condensin
a, KR balanced Hi-C contact matrices (chr1:152–152.5Mb and chr1:152.8–153.8Mb and chr1:154.6–155.6Mb) showing mitotic compartments. Bin size: 25kb. mA1, mA2 and mB1 compartments are labeled by red, yellow and purple bars respectively. b, Representative tracks corresponding to the genomic regions in (a), showing the ChIP-seq profiles of RNA PolII, H3K27ac, H3K36me3 and H3K27me3 in asynchronous as well as condensin-deficient (4h) mitotic cells. c, Density plots showing the EV1 values as well as ChIP-seq signal strength of indicated marks in mA1 and mA2 compartments in the asynchronous and condensin-deficient mitotic cells. d, Box-plots showing the log2 fold change of indicated marks between condensin-deficient mitotic and asynchronous samples. For all box plots, central lines denote medians; box limits denote 25th–75th percentile; whiskers denote 5th–95th percentile. P values were calculated using a two-sided Wilcoxon signed-rank test.
Extended Data Figure 15.
Extended Data Figure 15.. Effects of A485 and JQ1 treatment on condensin-deficient mitotic chromosome architecture.
a, Density heatmaps showing loss of H3K27ac signals in the condensin-deficient (4h) mitotic chromosomes after A485 treatment. Individual biological replicates are shown. b, Genomic tracks of a representative region showing loss of H3K27ac signals in the condensin-deficient (4h) mitotic chromosomes after A485 treatment. Individual biological replicates are shown. c, Upper panel: KR balanced Hi-C contact matrices (chr1:3–160Mb) of condensin-deficient (4h) mitotic cells treated with DMSO, A485 or JQ1. Bin size: 100kb. Lower panel: Saddle-plots showing the compartment strength in the condensin-deficient (4h) mitotic cells treated with DMSO, A485 or JQ1. Independent biological replicates were shown. d, Scatter plot showing the EV1 values of mA1 25kb genomic bins in DMSO treated (x-axis) against A485 treated (y-axis) condensin-deficient (4h) mitotic cells. Bins were color coded based on their response to A485 treatment. Each biological replicate was shown. e, Heatmap showing the differential interaction strengths among mA1-D, mA1-I and mA1-U compartments upon A485 treatment compared to DMSO treated control. Each biological replicate was shown. f, Scatter plot showing the EV1 values of mA1 25kb genomic bins in DMSO treated (x-axis) against JQ1 treated (y-axis) condensin-deficient (4h) mitotic cells. Bins were color coded based on their response to A485 treatment. Each biological replicate was shown. e, Heatmap showing the differential interaction strengths among mA1-D, mA1-I and mA1-U compartments upon JQ1 treatment. Each biological replicate was shown.
Extended Data Figure 16.
Extended Data Figure 16.. Effects of A485 and JQ1 treatment on mitotic CRE contacts.
a, Density heatmaps showing mitotic H3K27ac ChIP-seq signals with or without A485 treatment flanking the center of the up-stream or down-stream anchors of CRE contacts. b, KR balanced Hi-C contact maps (chr1:133.7–134Mb) for DMSO and A485 treated condensin-deficient (4h) mitotic cells showing a representative mitotic CRE contact. Bin size: 10kb. Tracks of corresponding H3K27ac ChIP-seq results were coupled. c, Dot plot showing the APA signals of mitotic CRE contacts upon DMSO, A485 or JQ1 treatment. Each dot represents a biological replicate. d, APA plots showing a mild reduction of CRE contact strength in condensin-deficient (4h) mitotic cells after A485 treatment but not after JQ1 treatment.
Extended Data Figure 17.
Extended Data Figure 17.. Mitotic mA1 compartmentalization and CRE contacts emerge swiftly in the unperturbed post-mitotic cells.
a, Upper panel: KR balanced Hi-C contact matrices (chr1:181–183.5Mb) showing rapid emergence of mA1 homotypic interactions in parental G1E-ER4 cells during mitotic exit. Bin size: 25kb. Middle panel: KR balanced Hi-C contact matrices showing the representative (chr6:72–83Mb vs. chr6:100–113.5Mb) delay of the formation of mB4 homotypic interactions. Bin size: 100kb. Lower panel: KR balanced Hi-C contact matrices (chr3:46–58Mb) showing segregation of mA1 from mB4 compartments during mitotic exit. Bin size: 25kb. b, Line plots showing the differential reformation kinetics for mA1, mA2 and mB4 as well as the repulsion kinetics between mA1 vs. mB4 and mA2 vs. mB4 in the parental G1E-ER4 cells during mitotic exit. Error-bar denotes SEM (n=18 chromosomes). Statistic tests were performed for comparison of the aggregation dynamics between mA1 vs. mB4 compartments (red) and mA2 vs. mB4 compartments (yellow). P values were calculated using a two-sided Wilcoxon signed-rank test. c, Left and right: schematics showing how correlations are computed between mA1 or mB4 aggregation strength and mA1 vs mB4 segregation over time. Middle: Dot plot showing the Pearson correlation coefficients between mA1 or mB4 compartment strength and mA1 vs. mB4 segregation in parental cells during mitotic exit. Each dot represents an individual chromosome (n=18). P values were calculated using a two-sided Wilcoxon signed-rank test. d, Schematic showing the ranking of CRE contacts based on their strength in condensin-deficient mitotic cells. e, Line plots showing the faster reformation of the top10% CRE contacts in the parental cells during mitotic exit. APA plots of top and bottom10% CRE contacts in ana/telophase and late-G1 phase were shown. Error bar denotes SEM (n=641). Statistic tests were performed for comparison of the reformation dynamics between top10% and bottom10% CRE contacts. P values were calculated using a two-sided Wilcoxon signed-rank test. f, Representative KR balanced Hi-C interaction matrices showing the fast reformation of a top10% CRE contact (chr1:134.85–135.1Mb) and the slow reformation of a bottom10% CRE contact (chr1:136.35–136.55Mb) in the parental cells after mitosis. Bin size: 10kb. g, Line plots showing the faster reformation of the top10% CRE contacts in the CTCF deficient cells during mitotic exit.
Extended Data Figure 18.
Extended Data Figure 18.. Characterization of the G1E-ER4:mCherry-mAID-HP1α;GFP-FKBPF36V-HP1β cell line.
a, Schematic illustration showing the homozygous insertion of mCherry-mAID tag and GFP-FKBPF36V tag to the N terminus of endogenous Cbx5 and Cbx1 locus respectively. b, Western blot showing the degradation of HP1α and HP1β upon 5-Ph-IAA or/and dTag13 treatment. One experiment was performed. c, Schematic illustration showing the strategy of nocodazole based arrest/release in conjunction with 5-Ph-IAA or/and dTag13 treatment. Early and late-G1 phase cells with four distinct HP1 protein configurations were collected. d, Flow cytometry plot showing the sorting strategy of early-G1 and late-G1 phase cells with distinct HP1 protein configurations. Two biological replicates were performed. e, Representative confocal images showing the successful depletion of HP1α or HP1β or both in the sorted G1 phase cells. Scale bar: 10μm. Two biological replicates were performed. f, Flow cytometry plot showing the mitotic progression of cells under distinct configurations of HP1 proteins after nocodazole release. Two biological replicates were performed.
Extended Data Figure 19.
Extended Data Figure 19.. HP1α and HP1β are dispensable for post-mitotic genome refolding.
a, Bar graph showing the high stratum-adjusted correlation coefficient for each chromosome (n=19) between biological replicates for each condition. b, KR balanced Hi-C contact matrices (chr1:3–160Mb) showing chromatin the compartmentalization in early-G1 and late-G1 cells. Samples with four distinct HP1 protein configurations were shown. Bin size: 100kb. Browser tracks of EV1 values were shown for each contact map. c, Saddle-plots showing the progressive compartmentalization of chromatin from early-G1 to late-G1. Samples with four distinct HP1 protein configurations were shown. Compartmental strength for sample were labeled for each plot. d, P(s) curves for early-G1 and late-G1 phase samples under distinct HP1 protein configurations. e, APA plots for structural loop (n=4,837) signals in early-G1 and late-G1 phase samples under distinct HP1 protein configurations. f, APA plots for CRE loop (n=4,642) signals in early-G1 and late-G1 phase samples under distinct HP1 protein configurations.
Extended Data Figure 20.
Extended Data Figure 20.. HP1α, HP1β and HP1γ are dispensable for post-mitotic genome refolding.
a, Bar graph showing the high stratum-adjusted correlation coefficient for each chromosome (n=19) between biological replicates for each condition. b, P(s) curves for early-G1 and late-G1 phase samples with or without three HP1 proteins. c, APA plots for structural loop (n=4,837) and CRE loop (n=4,642) signals in early-G1 and late-G1 phase samples with or without three HP1 proteins.
Figure 1.
Figure 1.. Progressive compartmentalization of the condensin-depleted mitotic chromosomes.
a, Schematic illustration showing the homozygous insertion of mAID-mCherry tag to the C terminus of endogenous SMC2 protein. b, Experimental design, showing the strategy of prometaphase arrest and auxin treatment. c, KR balanced Hi-C contact matrices showing the global re-configuration of mitotic chromosomes after condensin removal. Hi-C maps of asynchronous cells were shown as control. Bin size: 100kb. d, Saddle-plots showing the progressive compartmentalization of mitotic chromosomes after condensin removal. Compartmental strength is shown for each sample. e, Schematic illustration showing the homozygous insertion of mAID-Halotag to the C terminus of endogenous NCAPH protein. f, Schematic illustration showing the homozygous insertion of mAID-Halotag to the C terminus of endogenous NCAPH2 protein. g, KR balanced Hi-C contact matrices of mitotic chromosomes after condensin I removal. Bin size: 100kb. h, Saddle-plots showing lack of compartmentalization during mitosis after condensin I removal. i, KR balanced Hi-C contact matrices of mitotic chromosomes after condensin II removal. Bin size: 100kb. j, Saddle-plots showing lack of compartmentalization during mitosis after condensin II removal.
Figure 2.
Figure 2.. Intricate patterns of mitotic compartments
a, Bar graph showing the composition of 25kb genomic bins with positive or negative EV1 values in condensin-deficient mitotic and asynchronous control cells. P values were calculated using a two-sided Fisher’s exact test. b, Browser tracks showing the EV1 values of asynchronous and condensin-depleted mitotic cells (4h). Arrow indicates the compartment switch. c, Scatter plot showing the EV1 values of 25kb genomic bins in asynchronous control cells (x-axis) against condensin-deficient mitotic cells (y-axis). Bins were color coded based on their compartment assignment. d, KR balanced Hi-C contact matrices showing a representative (chr1:40–58Mb vs. chr1:60–84Mb) homotypic mB4 interactions in condensin-deficient (4h) mitotic cells. Bin size: 25kb (10kb for enlarged view). mB4 compartments were indicated by green bars. Browser tracks of EV1 values for each condition as well as H3K27ac, H3K36me3, H3K9me3 and H3K27me3 from asynchronously growing cells were shown. e, Similar to (d), showing representative mB1-type compartments and highlighting a conversion of interaction patterns between mB1 and mB4 compartments from asynchronous to condensin-deficient mitotic cells. mB1 compartments were indicated by purple bars. f, KR balanced Hi-C contact matrices showing a representative (chr1:151–166Mb vs. chr1:170–190Mb) strengthening of the mA1 compartmental interactions in condensin-deficient (4h) mitotic cells. Bin size: 25kb (10kb for enlarged view). mA1 compartment was indicated by red bars. g, Similar to (f), showing representative examples (chr1:70–85Mb) of mA2 compartmental interactions. mA2 compartment was indicated by yellow bars. Homotypic interactions of mA2 was highlighted by blue arrows. h, Attraction-repulsion plots showing the homotypic and heterotypic interactions among four different compartments: mA1, mA2, mB4 and mB1. Plots for control mitotic, condensin-deficient (4h) mitotic and asynchronous cells were shown.
Figure 3.
Figure 3.. Dynamic attraction and segregation of compartments during mitosis upon condensin loss.
a, Upper panel: KR balanced Hi-C contact matrices (chr6:119–126Mb) showing rapid emergence of mA1 homotypic interactions in mitosis upon condensin loss. Bin size: 25kb. Middle panel: KR balanced Hi-C contact matrices (chr6:72–83Mb vs. chr6:100–113.5Mb) showing the delay of the formation of mB4 homotypic interactions. Bin size: 100kb. Lower panel: KR balanced Hi-C contact matrices (chr3:46–58Mb) showing rapid segregation of mA1 from B4 compartments in mitosis after condensin loss. Bin size: 25kb. Depletion of interactions was indicated by red dotted boxes. b, Line plots showing the differential reformation kinetics for mA1, mA2, mB1 and mB4 as well as the repulsion kinetics between mA1 vs. mB4 and mA2 vs. mB4. Error-bar denotes SEM (n=18 chromosomes). Statistic tests were performed for comparison of the aggregation dynamics between mA1 vs. mB4 compartments (red) and mA2 vs. mB4 compartments (yellow). P values were calculated using a two-sided Wilcoxon signed-rank test. c, Left and right: schematics showing how correlations are computed between mA1 or mB4 aggregation and mA1 vs mB4 segregation over time. Middle: dot plot showing the Pearson correlation coefficients between mA1 or mB4 compartment strength and mA1 vs. mB4 segregation. Each dot represents an individual chromosome (n=18). P values were calculated using a two-sided Wilcoxon signed-rank test. d, Schematic showing the fast aggregation of mA1 and rapid exclusion of mA1 from mB4 and delayed self-attraction of mB4, implying that mA1 compartment initiates the formation of checkerboard compartmental interaction pattern in mitotic chromosomes upon condensin loss.
Figure 4.
Figure 4.. H3K27ac contributes to mA1 compartmentalization in the condensin-deficient mitotic cells.
a, Schematic showing A485 and JQ1 treatment strategy. b, Density heatmaps showing loss of H3K27ac signals in the condensin-deficient (4h) mitotic chromosomes after A485 treatment. c, Box-plots showing the EV1 values of each 25kb genomic bins (n=5,299) of mA1 compartment in the condensin-deficient mitotic cells upon DMSO, A485 or JQ1 treatment. For all box plots, central lines denote medians; box limits denote 25th–75th percentile; whiskers denote 5th–95th percentile. P values were calculated using a two-sided paired Wilcoxon signed-rank test. d, Heatmap showing the clustering result of EV1 values between DMSO and A485 treated samples. e, Left panel: Scatter plot showing the EV1 values of mA1 25kb genomic bins in DMSO treated (x-axis) against A485 treated (y-axis) condensin-deficient (4h) mitotic cells. Right panel: Scatter plot showing impact of JQ1 on mA1 compartment. Bins were color coded based on their response to A485 treatment. f, KR balanced Hi-C contact matrices showing representative (chr2:77–81Mb vs. chr2:90–92Mb) mA1-D compartments in the DMSO, A485 or JQ1 treated condensin-deficient mitotic cells. Compartmental interactions were indicated by purple arrows. Bin size: 25kb. Browser tracks of EV1 values for each condition as well as H3K27ac were shown. Red arrows indicate the reduction of EV1 values upon A485 treatment. Gray arrows indicate unaffected regions. g, Similar to (f), showing representative mA1-U compartmental interactions. h, Similar to (f), showing representative mA1-I compartmental interactions. i, Left panel: Heatmap showing the differential interaction strengths among mA1-D, mA1-I and mA1-U compartments upon A485 treatment compared to DMSO treated controls. Right panel: Heatmap showing the differential interaction strengths among mA1-D, mA1-I and mA1-U compartments upon JQ1 treatment. j, Box-plots H3K27ac ChIP-seq signal strength in the condensin-deficient mitotic cells for mA1-D (n=1,361), mA1-I (n=653) and mA1-U (n=3,285) compartments. For all box plots, central lines denote medians; box limits denote 25th–75th percentile; whiskers denote 5th–95th percentile. P values were calculated using a two-sided Wilcoxon signed-rank test. k, Similar to (j) Box-plots showing the log2 fold change of H3K27ac signals within the mA1-D (n=1,880), mA1-I (n=861) and mA1-U (n=4,518) compartments.
Figure 5.
Figure 5.. Formation of CRE contacts in mitotic chromosomes upon condensin loss.
a, Schematic showing stratification of the 6,825 interphase CRE contacts. b, Line plot showing the APA signals of CRE contacts in condensin-deficient mitotic cells. c, Upper panel: representative KR balanced Hi-C contact matrices (chr1:55–55.2Mb) showing the emergence of focalized signal between CREs in mitotic cells upon condensin loss. Bin size: 10kb. Lower panel: APA plots of CRE contacts in asynchronous and mitotic cells with or without condensin. d, Line plot showing the APA signals of CRE contacts in condensin I-deficient mitotic cells. e, Line plot showing the APA signals of CRE contacts in condensin II-deficient mitotic cells. f, APA plots of CRE contacts in asynchronous and mitotic cells with or without condensin I. g, APA plots of CRE contacts in asynchronous and mitotic cells with or without condensin II.
Figure 6.
Figure 6.. HP1 proteins are dispensable for chromatin re-compartmentalization during mitosis-to-G1 phase transition.
a, Representative KR balanced Hi-C contact map (chr4:124–129Mb) showing mB4 homotypic interactions. Bin size: 25kb. mB4 compartments are indicated by green bars. b, Representative tracks corresponding to the genomic regions in (a), showing EV1 values and the ChIP-seq profiles of HP1α, HP1β and HP1γ in asynchronous as well as condensin-deficient (4h) mitotic cells. c-e, Box-plots showing the enrichment of indicated HP1 protein in asynchronous and condensin-deficient (4h) mitotic cells for mB4 (n=2,866) and random genomic regions (n=5,000). For all box plots, central lines denote medians; box limits denote 25th–75th percentile; whiskers denote 5th–95th percentile. P values were calculated using a two-sided paired Wilcoxon signed-rank test. f, Schematic showing the genome editing strategy to generate the triple inducible degradation cell line targeting HP1α, HP1β and HP1γ simultaneously. g, Representative images showing the effect of acute protein degradation for HP1α, HP1β and HP1γ (Halo-646). Nuclei was marked by DAPI staining. Scale bar: 5μm. Two independent experiments were performed. h, Schematic illustration showing the strategy of nocodazole based arrest/release in conjunction with 5-Ph-IAA and dTag13 treatment. Early and late-G1 phase cells with or without all HP1 proteins were collected. i, KR balanced Hi-C contact matrices (chr9:3–160Mb) showing chromatin the compartmentalization in early- and late-G1 cells. Samples with or without HP1 proteins were shown. Bin size: 100kb. Tracks of corresponding EV1 values were coupled. j, Saddle-plots showing the progressive compartmentalization of chromatin from early-G1 to late-G1. Samples with or without HP1 proteins were shown. Compartmental strength for sample were shown for each plot.

References

    1. Nichols M. H. & Corces V. G. Principles of 3D compartmentalization of the human genome. Cell reports 35, 109330, doi:10.1016/j.celrep.2021.109330 (2021). - DOI - PMC - PubMed
    1. Zhang H. et al. Chromatin structure dynamics during the mitosis-to-G1 phase transition. Nature 576, 158–162, doi:10.1038/s41586-019-1778-y (2019). - DOI - PMC - PubMed
    1. Zhang H. et al. CTCF and transcription influence chromatin structure re-configuration after mitosis. Nature communications 12, 5157, doi:10.1038/s41467-021-25418-5 (2021). - DOI - PMC - PubMed
    1. Abramo K. et al. A chromosome folding intermediate at the condensin-to-cohesin transition during telophase. Nature cell biology 21, 1393–1402, doi:10.1038/s41556-019-0406-2 (2019). - DOI - PMC - PubMed
    1. Pelham-Webb B. et al. H3K27ac bookmarking promotes rapid post-mitotic activation of the pluripotent stem cell program without impacting 3D chromatin reorganization. Molecular cell 81, 1732–1748 e1738, doi:10.1016/j.molcel.2021.02.032 (2021). - DOI - PMC - PubMed

Publication types