[Preprint]. 2023 Nov 18:2023.11.18.567597.
doi: 10.1101/2023.11.18.567597.

Cell morphology QTL reveal gene by environment interactions in a genetically diverse cell population

Affiliations

Cell morphology QTL reveal gene by environment interactions in a genetically diverse cell population

Callan O'Connor et al. bioRxiv. .

Abstract

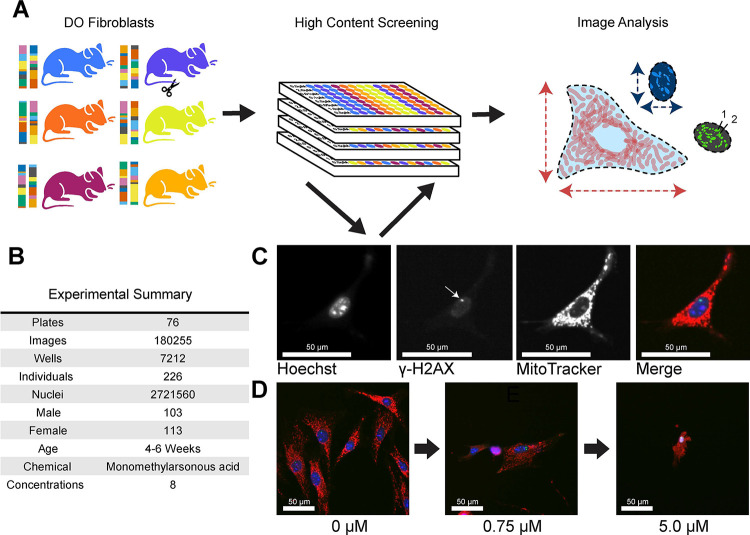
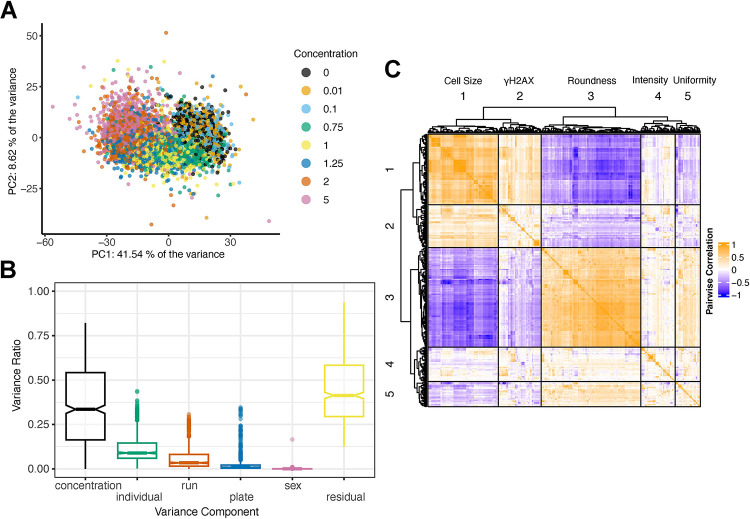
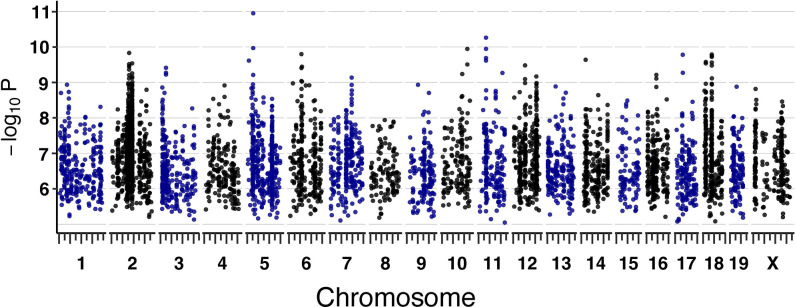
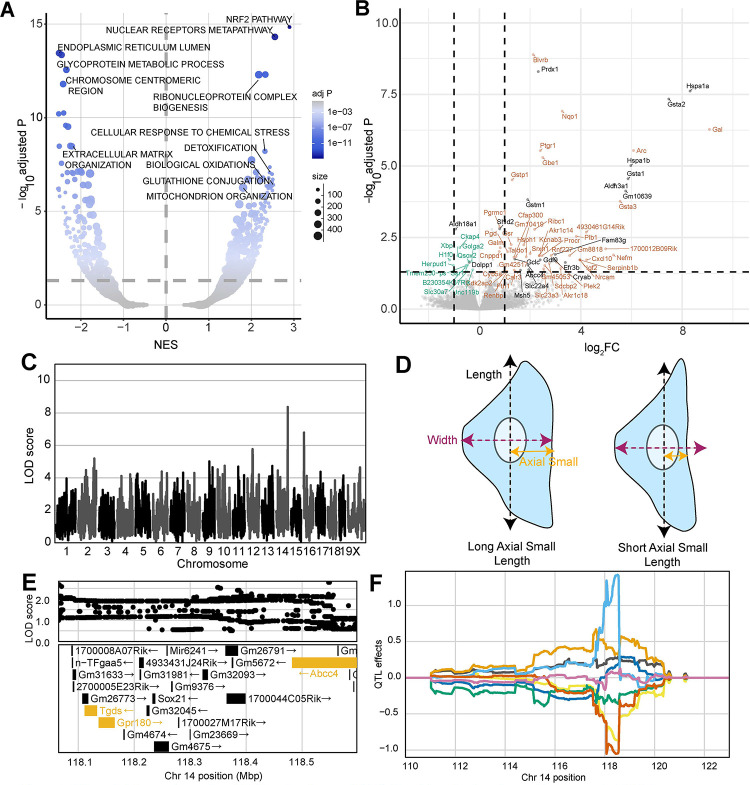
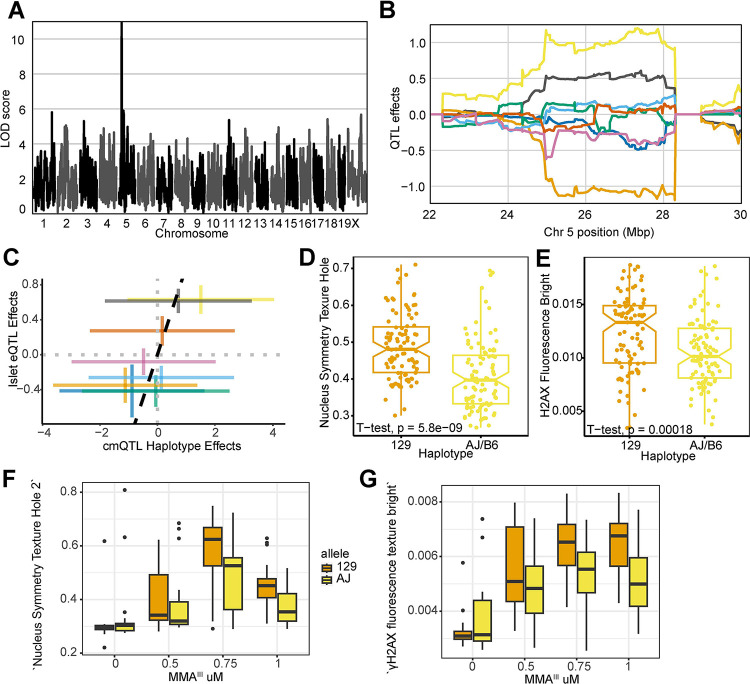
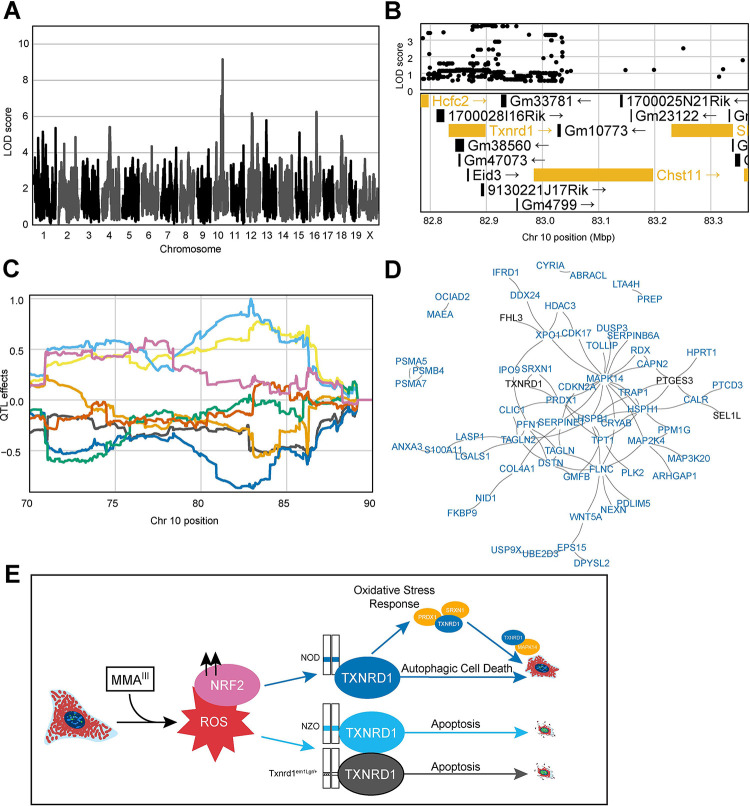
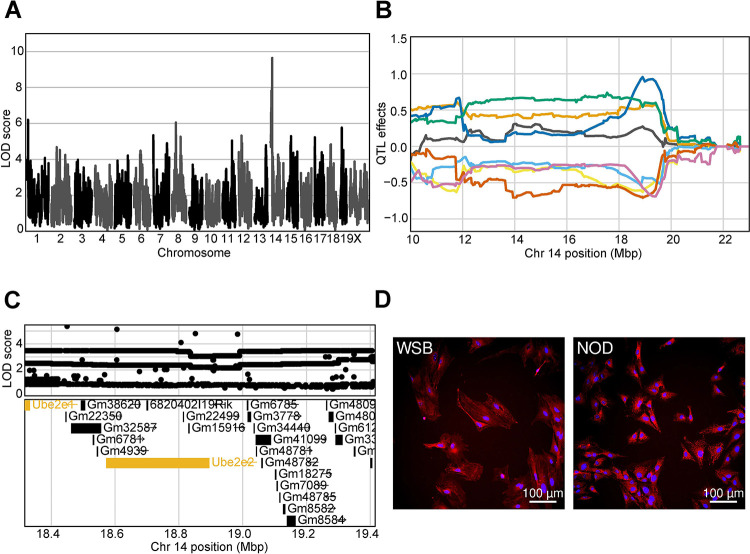
Genetically heterogenous cell lines from laboratory mice are promising tools for population-based screening as they offer power for genetic mapping, and potentially, predictive value for in vivo experimentation in genetically matched individuals. To explore this further, we derived a panel of fibroblast lines from a genetic reference population of laboratory mice (the Diversity Outbred, DO). We then used high-content imaging to capture hundreds of cell morphology traits in cells exposed to the oxidative stress-inducing arsenic metabolite monomethylarsonous acid (MMAIII). We employed dose-response modeling to capture latent parameters of response and we then used these parameters to identify several hundred cell morphology quantitative trait loci (cmQTL). Response cmQTL encompass genes with established associations with cellular responses to arsenic exposure, including Abcc4 and Txnrd1, as well as novel gene candidates like Xrcc2. Moreover, baseline trait cmQTL highlight the influence of natural variation on fundamental aspects of nuclear morphology. We show that the natural variants influencing response include both coding and non-coding variation, and that cmQTL haplotypes can be used to predict response in orthogonal cell lines. Our study sheds light on the major molecular initiating events of oxidative stress that are under genetic regulation, including the NRF2-mediated antioxidant response, cellular detoxification pathways, DNA damage repair response, and cell death trajectories.

Keywords: QTL mapping; arsenic; cell morphology; cell painting; cmQTL; fibroblasts; genetic diversity; genetic mapping; genetics; high content imaging; monomethylarsonous acid; new approach methodologies; systems genetics; systems toxicology.


Conflict of interest statement

Conflicts of Interest None to disclose.

Figures

Figure 1:
Figure 1:. HCS of MMAIII-exposed DO Fibroblasts
(A) 600+ primary fibroblasts were derived from Diversity Outbred (DO) mice aged 4–6 weeks. 226 DO fibroblast lines were exposed to 8 concentrations of MMAIII (0 μM, 0.01 μM, 0.1 μM, 0.75 μM, 1.0 μM, 1.25 μM, 2.0 μM, and 5.0 μM). Cell lines were semi-randomly seeded into 96-well plates (4 columns spanning two plates, see Supplementals for more information). Image analysis was performed at the whole well level and summarized across concentrations using dose response modeling. (B) Table with experimental summary (C) Example images showing fibroblasts labeled with MitoTracker Deep Red, Hoechst 33342, an anti-gamma γH2AX antibody with a Alexafluor 488 donkey anti-rabbit secondary, and the merged image. Plates were imaged using an Operetta High Content Imager (PerkinElmer) at 20X. (D) Example merged images showing a fibroblasts’ morphology across three representative doses of MMAIII (0 μM, 0.75 μM, 5.0 μM).
Figure 2:
Figure 2:. HCS Features are Influenced by MMAIII Concentration and Genetic Background
(A) Principal Component Analysis (PCA) of the raw image analysis feature dataset colored by the concentration of MMAIII. Among known factors, increasing MMAIII contributed the majority of the variance for both PC1 (41.54 %) and PC2 (8.62 %). (B) Boxplot showing the aggregated results from variance component analysis (VCA) performed across all cellular features including MMAIII concentrarions (concentration), DO cell lines (individual), each 96-well plate (plate), residual variation, run, and sex. (D) Heatmap showing the Pearson’s pairwise correlation structure of the all the raw cellular features. Theheatmap and dendrogram were generated using the R package ComplexHeatmap’s Heatmap() function with column_split and row_split each set to 5.
Figure 3:
Figure 3:. Dose-Response Modeled cmQTL in DO Fibroblasts Exposed to MMAIII
Summary of cmQTL maximum peaks for 5100 cmDRPs. Each points represents the strength of the genetic association as a LOD score on the y-axis (−log10P) across the mouse genome (x-axis). On the x-axis, long tick marks represent the start of the chromosome and 50 Mbp intervals, while the short tick marks are 25 Mbps.
Figure 4:
Figure 4:. Differential Expression and cmQTL Together Support MMAIII Glutathione Conjugation and its Export via ABCC4
(A) Volcano plot showing the normalized effect sizes (NES) and adjusted p-values (−log10 transformed) of the score-based gene set enrichment (GSEA) results from differential expression (DE) analysis across the 0 and 0.75 μM MMAIII exposed DO fibroblasts groups (n = 32, 16 individuals). Expression was filtered based on a median transcript per million ≥ .5 or removed if at least half of the points were below this cutoff. Each point represent a gene set from ‘GO:Component’,‘REACTOME’, ‘KEGG’, ‘WikiPathways’, ‘GO:Tissue’, ‘GO:Molecular Function’ and ‘GO:Biological Process’. The size of each points represents the number of genes within the gene set and the color represents the −log10(adjusted P) (y-axis). Horizontal dashed line indicates the adj. p-value significance threshold (adj. P = 0.05) (B) Volcano plot showing the log2-fold change (log2FC) and adjusted p-values (−log10adjusted P) for single genes. The horizontal indicates ithe adj. p-value significance threshold (adj. P = 0.05) and the vertical lines represent the ± 1 log2fold change for a point of reference. Points labeled with gene names are significantly differentially expressed (adj. p-value < .05) with effect sizes > 0.75 log2FC or < −0.25 log2FC. Colors represent genes withing cmQTL confidence intervals (black), upregulated (orange) and downregulated (green) DE. (C) QTL scan for the ‘EC5 Mitosmooth Axial Small length mean per well’ cmQTL with the maximum peak at chromosome 14: 118483436 bp (m38) and a LOD score of 8.36. (D) Cartoon fibroblast cells depicting the two measurements of cell length (black), width (purple), and axial small width (yellow). Fibroblast on the left has a longer axial small length compared to the fibroblast on the right, (E) Variant association mapping within the Cl the cmQTL ‘EC5 Mitosmooth Axial Small length mean per well’. Top panel shows the LOD scores of the known, segregating variants in the 8 DO founders (m38). Bottom panel shows the gene models within the respective Cl. Each point represents a variant. Colors indicate whether a gene is expressed > 0.5 TPM (gold) or < 0.5 TPM (black). The arrow indicates the direction of transcription. (F) Allele effects plot showing the eight DO founders (colors, see Methods) for the ‘EC5 Mitosmooth Axial Small length mean per well’ cmQTL across the surrounding region on chromosome 14 (Mbp).
Figure 5:
Figure 5:. Xrcc2 haplotype modulates chromosomal organization and DNA damage during acute MMAIII exposure
(A) QTL scan for the ‘EC90 Hoechst Nucleus Symmetry (02) Hole Mean per Well’ cmQTL with the maximum peak at chromosome 5: 27327254 bp(m38) and a LOD score of 10.95. (B) Allele effects plot showing the eight DO founders (colors, see Methods) for the ‘EC90 Hoechst Nucleus Symmetry (Hoechst) Hole Mean per Well’ cmQTL across the surrounding region on chromosome 5 (Mbp). Colors indicate founder mouse strains: A/J (yellow), C57BL/6J (gray), 129S1/SvImJ (orange), NOD/ShiLtJ (dark blue), NZO/HILtJ (light blue), CAST/EiJ (green), PWK/PhJ (red), and WSB/EiJ (purple) (C) Pairwise correlation of the haplotype effects of Xrcc2 expression in pancreatic islet cells at chromsome 5:27,327,254 bp (GRCm38) compared to the haplotype effects of ‘EC90 Hoechst Nucleus Symmetry (Hoechst) Hole Mean per Well’. Colors are the same as panel B. (D) Boxplot showing the significant difference (t-test, p value = 5.8e-9) in ‘Nucleus Symmetry Texture Hole 2’ at 1 μM MMAIII for the top 129 (n = 24; orange) and AJ/B6 (n = 24; yellow) haplotypes in the DO fibroblasts. (E) Boxplot showing the significant difference (t-test, p value = .00018) in ‘γH2AX fluorescence texture bright’ at 1 μM MMAIII for the top 129 (n = 24) and AJ/B6 (n = 24) haplotypes in the DO fibroblasts. (F) Boxplot showing the ‘EC90 Hoechst Nucleus Symmetry (02) Hole Mean per Well’ cellular phenotype in a follow-up experiment where DO fibroblasts with 129 (n = 5; orange) and AJ (n = 5; yellow) haplotypes exposed to increasing MMAIII concentrations. (G) Boxplot showing the ‘γH2AX fluorescence texture bright’ cellular phenotype in a follow-up experiment where DO fibroblasts with 129 (n = 5) and AJ (n = 5) haplotypes exposed to increasing MMAIII concentrations. Colors indicate the DO founder strains (see Methods).
Figure 6:
Figure 6:. Noncoding Variation in Txnrd1 Modulates MMAIII-Induced Cell Death
(A) QTL scan for the ‘H2AX-negative cells slope Cell Area μm2 mean per well’ cmQTL with the maximum peak at Chromosome 10: 82906780 bp (m38) and a LOD score of 9.16. (B) Variant association mapping within the Cl the cmQTL ‘H2AX-negative cells slope Cell Area μm2 mean per well’. Top panel shows the LOD scores of the known, segregating variants in the 8 DO founders (GRCm38). Bottom panel shows the gene models within the respective Cl. Each point represents a variant. Colors indicate whether a gene is expressed > 0.5 TPM (gold) or < 0.5 TPM (black). The arrow indicates the direction of transcription. (C) Allele effects plot showing the eight DO founders (colors, see Methods) for the ‘H2AX-negative cells slope Cell Area μm2 mean per well’ cmQTL across the surrounding region on chromosome 10 (Mbp). (D) String-db functional enrichment network of the significantly increased protein interactors detected using immunoprecipitation mass spectrometry (IP-MS) in DO fibroblasts with NOD alleles (n = 6) at the maximum locus for the ‘H2AX-negative cells slope Cell Area μm2 mean per well’ cmQTL exposed to 0 and 0.75 μM MMAIII concentrations. Colors indicate whether a protein, or node, was shared with a similar experiment in DO fibroblasts with the NZO allele (n = 5). Black represents shared TXNRD1 interactors, and blue represents unique NOD-TXNRD1 interactors. (E) Mechanistic summary of allele-specific Txnrd1 responses across the NOD haplotype (blue), NZO haplotype (light blue), and heterozygous SECIS knockout model (Txnrd1em1Lgr/+). Our data suggest DO fibroblasts with the NOD allele have a more robust oxidative stress response upon MMAIII exposure, ultimately succumbing to autophagic cell death represented by increased cell size at medium MMAIII concentrations. In comparison, DO fibroblasts with the NZO allele or the Sec+/− alleles undergo a more apoptotic cell fate as shown by brighter Hoechst 33342 labeling and smaller cells.
Figure 7:
Figure 7:. Genetic variation influences fibroblast morphology at baseline
(A) QTL scan for the ‘Hoechst 33342 texture bright 1 pixel mean per well’ cmQTL with the maximum peak at chromosome 14: 19401644 bp (GRCm38) and a LOD score of 9.64. (B) Allele effects plot showing the eight DO founders (colors, see Methods) for the ‘Hoechst 33342 texture bright 1 pixel mean per well’ cmQTL across the surrounding region on chromosome 14 (Mbp). (C) Variant association mapping within the Cl the cmQTL ‘Hoechst 33342 texture bright 1 pixel mean per well’. Top panel shows the LOD scores of the known, segregating variants in the 8 DO founders (m38). Bottom panel shows the gene models within the respective Cl. Each point represents a variant. Colors indicate whether a gene is expressed > 0.5 TPM (gold) or < 0.5 TPM (black). The arrow indicates the direction of transcription. (D) Representative images for the two fibroblast lines showing higher Hoechst 33342 texture bright in the sample with the NOD allele at the chromsome 14 locus comapred to the WSB. Nuclei are labeled in blue by Hoechst 33342 labeling and mitochondria are labeled in red by MitoTracker Deep Red. Scale bar indicates 100 μm.

Similar articles

References

    1. Nogami S., Ohya Y., and Yvert G. (2007). Genetic complexity and quantitative trait loci mapping of yeast morphological traits. PLoS Genet 3, e31. 10.1371/journal.pgen.0030031. - DOI - PMC - PubMed
    1. Matthew T., Jatin A., Samira A., Beth A.C., Emily P., Dhara L., Gregory W., Erin W., Aparna N., Tiffany A., et al. (2023). High-dimensional phenotyping to define the genetic basis of cellular morphology. bioRxiv, 2023.2001.2009.522731. 10.1101/2023.01.09.522731. - DOI
    1. Bray M.-A., Singh S., Han H., Davis C.T., Borgeson B., Hartland C., Kost-Alimova M., Gustafsdottir S.M., Gibson C.C., and Carpenter A.E. (2016). Cell Painting, a high-content image-based assay for morphological profiling using multiplexed fluorescent dyes. Nature Protocols 11, 1757–1774. 10.1038/nprot.2016.105. - DOI - PMC - PubMed
    1. Taylor D.L., and Giuliano K.A. (2005). Multiplexed high content screening assays create a systems cell biology approach to drug discovery. Drug Discov Today Technol 2, 149–154. 10.1016/j.ddtec.2005.05.023. - DOI - PubMed
    1. Abraham V.C., Taylor D.L., and Haskins J.R. (2004). High content screening applied to large-scale cell biology. Trends Biotechnol 22, 15–22. 10.1016/j.tibtech.2003.10.012. - DOI - PubMed

Publication types