[Preprint]. 2023 Nov 17:2023.11.17.566254.
doi: 10.1101/2023.11.17.566254.

Insulin at the Intersection of Thermoregulation and Glucose Homeostasis

Affiliations

Insulin at the Intersection of Thermoregulation and Glucose Homeostasis

Nathan C Winn et al. bioRxiv. .

Update in

Abstract

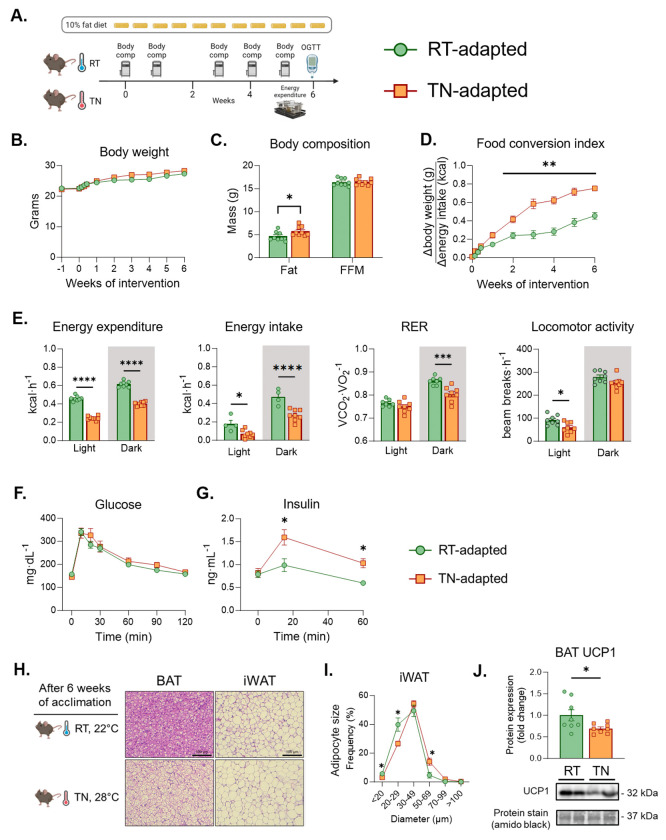
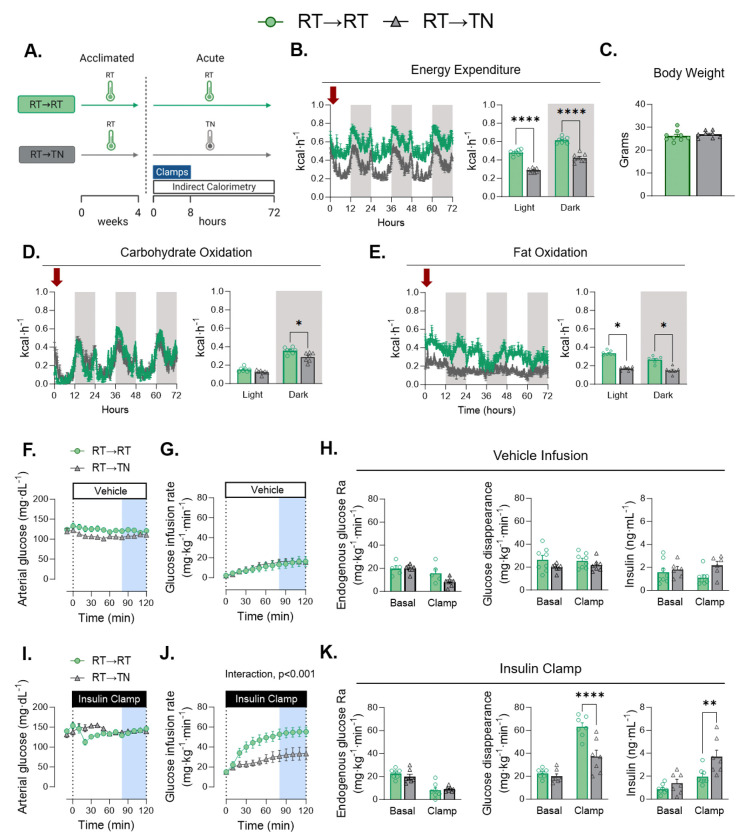
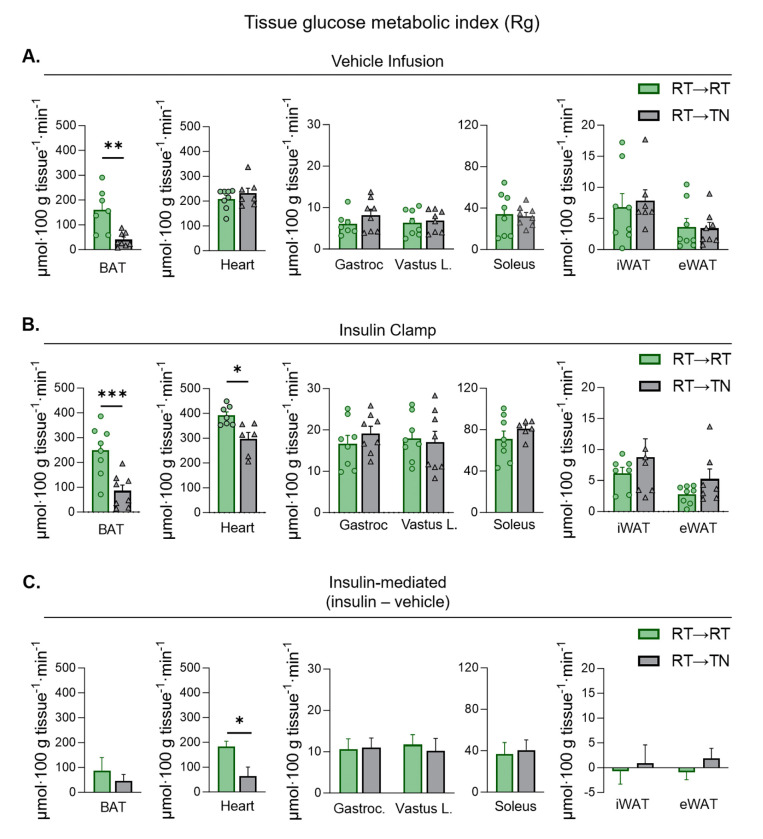
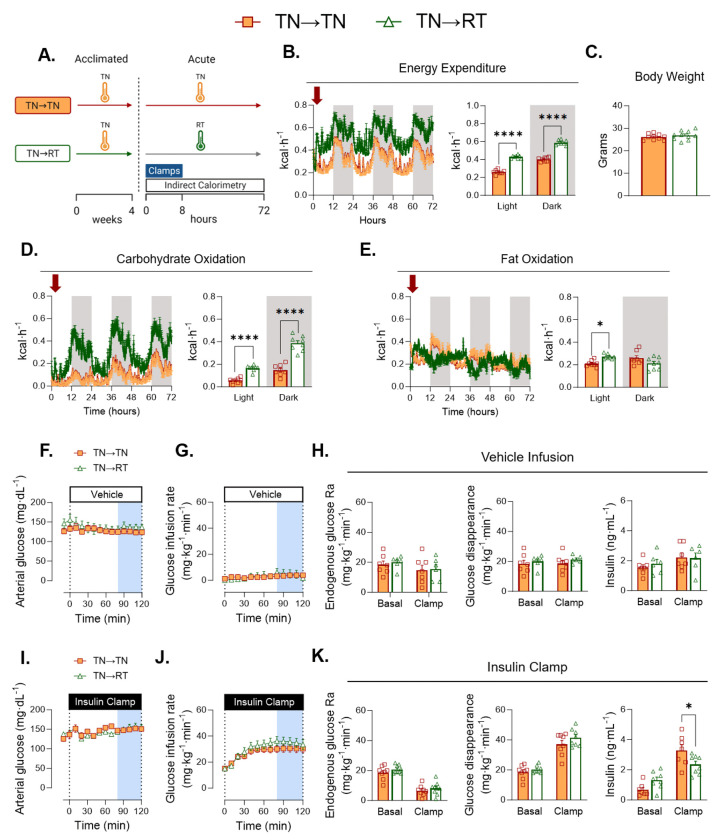
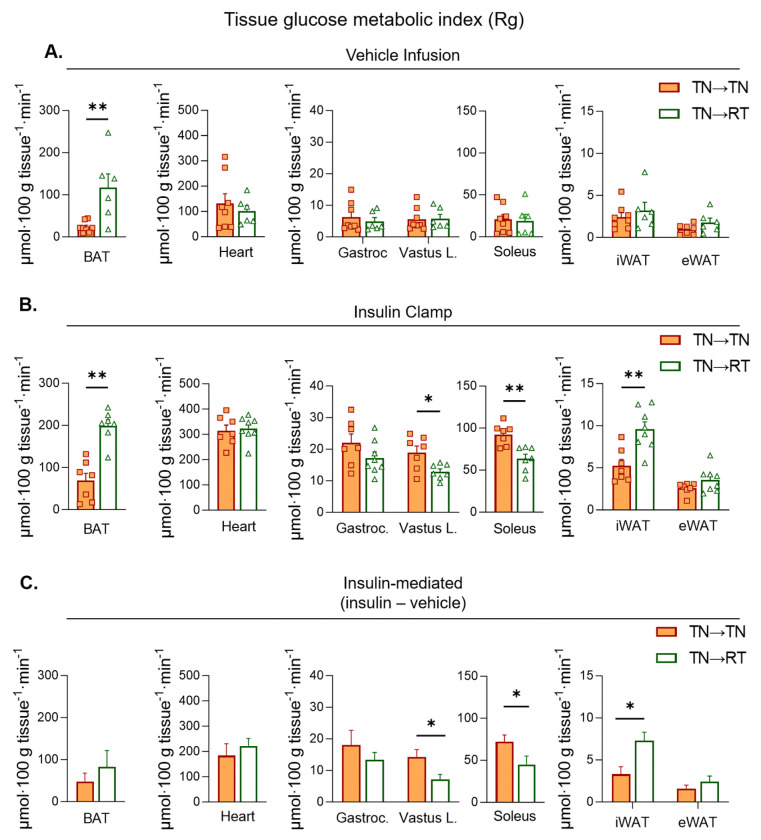
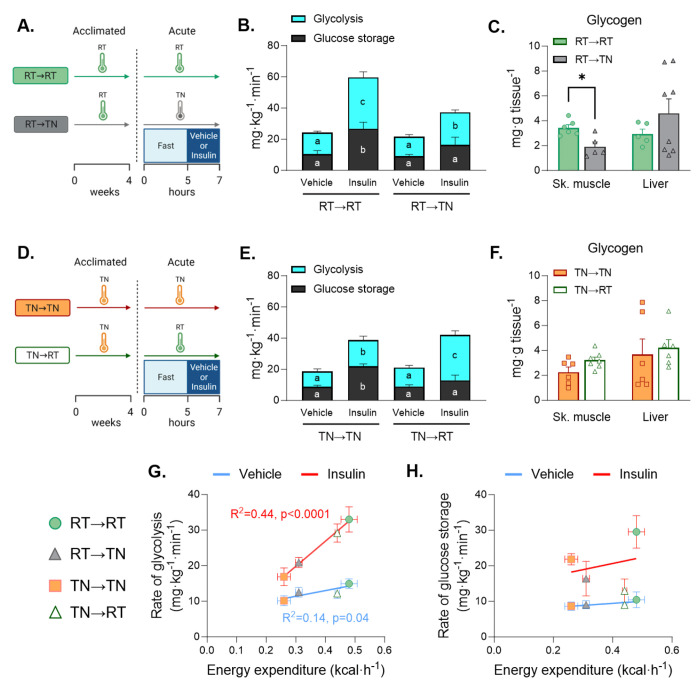
Mammals are protected from changes in environmental temperature by altering energetic processes that modify heat production. Insulin is the dominant stimulus of glucose uptake and metabolism, which are fundamental for thermogenic processes. The purpose of this work was to determine the interaction of ambient temperature induced changes in energy expenditure (EE) on the insulin sensitivity of glucose fluxes. Short-term and adaptive responses to thermoneutral temperature (TN, ~28°C) and room (laboratory) temperature (RT, ~22°C) were studied in mice. This range of temperature does not cause detectable changes in circulating catecholamines or shivering and postabsorptive glucose homeostasis is maintained. We tested the hypothesis that a decrease in EE that occurs with TN causes insulin resistance and that this reduction in insulin action and EE is reversed upon short term (<12h) transition to RT. Insulin-stimulated glucose disposal (Rd) and tissue specific glucose uptake were assessed combining isotopic tracers with hyperinsulinemic-euglycemic clamps. EE and insulin-stimulated Rd are both decreased (~50%) in TN-adapted vs RT-adapted mice. When RT-adapted mice are switched to TN, EE rapidly decreases and Rd is reduced by ~50%. TN-adapted mice switched to RT exhibit a rapid increase in EE, but whole body insulin-stimulated Rd remains at the low rates of TN-adapted mice. In contrast, whole body glycolytic flux rose with EE. This higher EE occurs without increasing glucose uptake from the blood, but rather by diverting glucose from glucose storage to glycolysis. In addition to adaptations in insulin action, 'insulin-independent' glucose uptake in brown fat is exquisitely sensitive to thermoregulation. These results show that insulin action adjusts to non-stressful changes in ambient temperature to contribute to the support of body temperature homeostasis without compromising glucose homeostasis.


Figures

Figure 1 –
Figure 1 –. Metabolic phenotype in TN-adapted and RT-adapted mice.
A) Mice were acclimated to RT or TN for 6 weeks. Glucose tolerance was measured after 5 weeks of acclimation and EE via metabolic cages were performed at week 6. B) Body weight was measured over the course of the experiment. C) Body composition measurements between RT and TN mice. D) Food conversion index was computed as the difference in body weight gain over energy consumed. E) EE, energy intake, RER and locomotor activity were collected in real time using metabolic cages with gas analyzers. F) Oral glucose tolerance were performed after 5 weeks of temperature acclimation. G) Plasma insulin levels were measured for both groups over the course of 60 minutes after glucose administration. H) H&E micrographs of BAT and iWAT. I) Adipocyte size distribution in iWAT. J) UCP1 immunoblotting in BAT. Panels (B), (D), (F), and (G) two-way ANOVA with repeated measures were run with Tukey adjustment. Students T test was run to compare groups for panel (C). For panel (E), two-way ANOVA with group and photoperiod were run, with Tukey correction. Data are mean ± SE. *p<0.05; **p<0.01; ***p<0.001; ****p<0.0001
Figure. 2 –
Figure. 2 –. Metabolome signatures in TN-adapted versus RT-adapted mice.
After 6 weeks of temperature acclimation, mice were euthanized and plasma and tissues extracted and flash frozen after a 5 hour fast. Untargeted metabolomics were performed in the plasma and BAT compartments. A) Volcano plot of differentially abundant plasma metabolites, with PCA plot as the inset. B) KEGG pathway score of differentially abundant metabolites. C) Top 10 differentially abundant plasma metabolites significantly increased in RT and TN, respectively. D) Volcano plot of differentially abundant BAT metabolites, with PCA plot presented as an inset. E) KEGG pathway score of differentially abundant metabolites. F) Top 20 differentially abundant BAT metabolites significantly increased in RT and TN, respectively. G) Volcano plots for heart, skeletal muscle, liver, iWAT, and eWAT. Student t tests were used to determine between group differences for adipocyte size bins Data are mean ± SE; n=6/group. *p<0.05.
Figure. 3 –
Figure. 3 –. Glucose fluxes during short-term transition of RT-adapted mice to TN (RT→TN).
A) The experimental model is shown in which mice were housed at RT for 4 weeks. At the beginning of the fasting period prior to clamping, the mice either remained in their temperature environment or transitioned to the opposing temperature. B) The environmental temperatures were monitored over the course of the experiment. C) EE of mice acclimated to RT or transitioned to novel TN. D) Body mass was not different between groups. [E-G, vehicle infusion]. E) Arterial glucose was administered and monitored during the GIR. F) Glucose infusion rate was monitored for each group. G) The rate of endogenous glucose appearance was measured for each group. Glucose flux was measured between groups over 100 minutes. Insulin levels were measured in all groups during clamping. [H-J, insulin clamps]. H) Glucose was administered and monitored during insulin infusion. I) GIR during clamped insulin infusion. J) The rate of endogenous glucose appearance was measured for each group. Glucose flux was measured between groups over 100 minutes. Insulin levels were measured in all groups during clamping. K) Glucose disappearance L) NEFA levels plotted against insulin concentrations. Student t tests were run to determine group differences for panels C and D. Panels E,F,H,I two-way ANOVA with repeated measures were run with Tukey adjustment. Panels G and J, two-way ANOVA with group and condition as factors were run with Tukey adjustment. Panel K and L, simple linear regression was used to test differences in slopes between groups. Data are mean ± SE. *p<0.05, **p<0.01, ****p<0.0001
Figure 4 –
Figure 4 –. Non-insulin and insulin-mediated tissue glucose metabolic index during short-term transition from RT-adapted to TN (RT→TN).
[14C]2-deoxyglucose was infused as a bolus at t=120 of each respective clamp. Blood was collected frequently for 25 minutes to determine the rate of disappearance using exponential decay. Tissues were rapidly excised and snap frozen for isotopic enrichment. Tissue Rg between RT→RT and RT →TN during A) vehicle and B) insulin clamps. C) Insulin-stimulated tissue Rg was computed as the mean differences in tissue Rg between insulin and vehicle infusions. The variance between vehicle and insulin clamps were calculated using the standard error of the difference. Statistical significance was determined using a t-distribution table with critical t-values and corresponding degrees of freedom. Data are mean ± SE; n=6-9/group. p<0.05 was used to reject the null hypothesis. *p<0.05, **p<0.01, ***p<0.001
Figure 5 –
Figure 5 –. Glucose fluxes during short-term transition of TN-adapted mice to RT (TN→RT).
A) The experimental model is shown in which mice were housed at either TN for 4 weeks. At the beginning of the fasting period prior to clamping, the mice either remained in their temperature environment or transitioned to the opposing temperature. B) The environmental temperatures were monitored over the course of the experiment. C) EE of mice acclimated to RT or transitioned to novel TN. D) Body mass was not different between groups. [E-G, vehicle infusion]. E) Arterial glucose was administered and monitored during the GIR. F) Glucose infusion rate was monitored for each group. G) The rate of endogenous glucose appearance was measured for each group. Glucose flux was measured between groups over 100 minutes. Insulin levels were measured in all groups during clamping. [H-J, insulin clamps]. H) Glucose was administered and monitored during insulin infusion. I) GIR during clamped insulin infusion. J) The rate of endogenous glucose appearance was measured for each group. Glucose flux was measured between groups over 100 minutes. Insulin levels were measured in all groups during clamping. K) Glucose disappearance L) NEFA levels plotted against insulin concentrations. Student t tests were run to determine group differences for panels C and D. Panels E, F, H, and I two-way ANOVA with repeated measures were run with Tukey adjustment. Panels G and J, two-way ANOVA with group and condition as factors were run with Tukey adjustment. Panel K and L, simple linear regression was used to test differences in slopes between groups. Data are mean ± SE; n=7-9/group. *p<0.05, ****p<0.0001
Figure 6 -
Figure 6 -. Non-insulin and insulin-mediated tissue glucose metabolic index during short-term transition from TN-adapted to RT (TN→RT).
[14C]2-deoxyglucose was infused as a bolus at t=120 of each respective clamp. Blood was collected frequently for 25 minutes to determine the rate of disappearance using exponential decay. Tissues were rapidly excised and snap frozen for isotopic enrichment. Tissue Rg between TN→TN and TN →RT during A) vehicle and B) insulin clamps. C) Insulin-stimulated tissue Rg was computed as the mean differences in tissue Rg between insulin and vehicle infusion. The variance between vehicle and insulin clamps were calculated using the standard error of the difference. Statistical significance was determined using a t-distribution table with critical t-values and corresponding degrees of freedom. Data are mean ± SE; n=6-9/group. p<0.05 was used to reject the null hypothesis. *p<0.05, **p<0.01
Figure 7 -
Figure 7 -. Whole-body glucose partitioning during short-term temperature transitions.
Mice acclimated to either RT or TN were short-term exposed to a novel temperature A) TN and B) RT or remained at their acclimated temperature during a euglycemic vehicle or insulin clamp. The rate of glycolysis and glucose storage were quantified and compared between C) RT→TN and RT→RT or D) TN→RT and TN→TN conditions. Glycogen was measured and compared between E) RT→TN and RT→RT or F) TN→RT and TN→TN. G) The relationship between the rate of glycolysis and EE was plotted for all temperature conditions. H) The rate of glucose storage and EE was plotted for all temperature conditions. For regression plots, blue lines represent vehicle conditions and red lines reflect insulin stimulated conditions. For panels C and D, two-way ANOVA with treatment and temperatures as factors. The ANOVAs were run for glycolysis and glucose storage separately. Histograms with distinct letters are statistically significantly different from one another. Black letters correspond to differences within glycolysis comparisons and white letters denote differences within glucose storage. Independent samples T tests were run for panels E and F for skeletal muscle and liver, respectively. Simple linear regression was used to determine differences in slopes for panels G and H. Data are mean ± SE; n=6-9/group.

Similar articles

References

    1. Castellini M. Encyclopedia of marine mammals. Elsevier; 2009:1166–71.
    1. Camastra S, Bonora E, Del Prato S, Rett K, Weck M, and Ferrannini E. Effect of obesity and insulin resistance on resting and glucose-induced thermogenesis in man. EGIR (European Group for the Study of Insulin Resistance). Int J Obes Relat Metab Disord. 1999;23(12):1307–13. - PubMed
    1. Ravussin E, and Bogardus C. Thermogenic response to insulin and glucose infusions in man: a model to evaluate the different components of the thermic effect of carbohydrate. Life Sci. 1982;31(18):2011–8. - PubMed
    1. Golay A, DeFronzo RA, Ferrannini E, Simonson DC, Thorin D, Acheson K, et al. Oxidative and non-oxidative glucose metabolism in non-obese type 2 (non-insulin-dependent) diabetic patients. Diabetologia. 1988;31(8):585–91. - PubMed
    1. Yokoyama H, Mori K, Emoto M, Araki T, Teramura M, Mochizuki K, et al. Non-oxidative glucose disposal is reduced in type 2 diabetes, but can be restored by aerobic exercise. Diabetes Obes Metab. 2008;10(5):400–7. - PubMed

Publication types