

This is a preprint.
It has not yet been peer reviewed by a journal.
The National Library of Medicine is
running a pilot
to include preprints that result from research funded by NIH in PMC and PubMed.
[Preprint]. 2023 Nov 15:2023.11.13.566919.
doi: 10.1101/2023.11.13.566919.
Identifying genetic variants that influence the abundance of cell states in single-cell data
Affiliations
- PMID: 38014313
- PMCID: PMC10680752
- DOI: 10.1101/2023.11.13.566919
Item in Clipboard
Identifying genetic variants that influence the abundance of cell states in single-cell data
bioRxiv.
.
Update in
-
Identifying genetic variants that influence the abundance of cell states in single-cell data.Nat Genet. 2024 Oct;56(10):2068-2077. doi: 10.1038/s41588-024-01909-1. Epub 2024 Sep 26. Nat Genet. 2024. PMID: 39327486 Free PMC article.
No abstract available
Figures
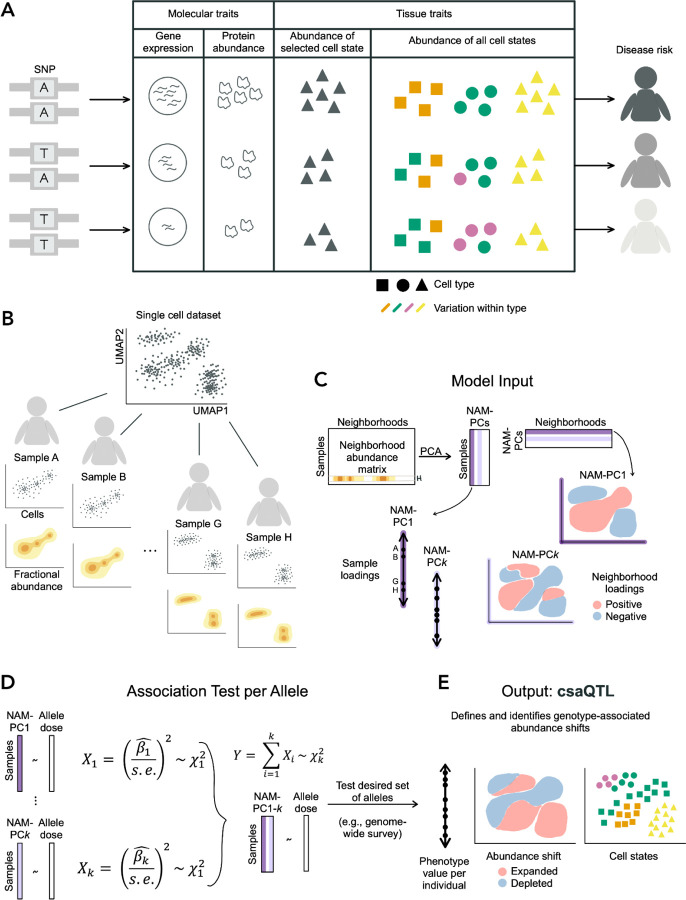
(A) Consider a variant associated with disease risk. Intermediate traits that may also associate with the variant and even mediate the genetic risk include well-studied molecular traits (e.g., transcript or protein abundance) as well as changes in the abundance of cells with varying character and function, illustrated here by variation in shape and color. Previous genetic studies of cell state abundance traits have quantified target cell states (e.g., triangle cell type) using flow cytometry. High-dimensional profiling may reveal genetically associated variation in the abundance of cell states researchers may not anticipate or cannot flow-sort (e.g., green character within the circle cell type). Detection of such associations requires granular information about cell variation and a flexible method for detecting variant-associated cell states. (B) For a given single-cell dataset, we use the landscape of cells observed for each sample to compute a granular distribution of fractional cellular abundance across the total cell state space, conceptually illustrated here in two dimensions. We illustrate a single axis of compositional variation across the four samples shown. (C) The Neighborhood Abundance Matrix stores the fractional abundance of cells from each sample in each neighborhood. Sample H is highlighted as an example. Principal components analysis of this object yields sample and neighborhood loading information on NAM-PCs. We illustrate with NAM-PC1 how these loadings would reflect the compositional axis illustrated in (B). We show another possible component (NAM-PCk) to illustrate that NAM-PCs can capture co-variation across transcriptionally distant regions. (D) GeNA uses a test statistic Y, which follows a chi-squared distribution with k degrees of freedom, to detect an association between allele dose for a given SNP and any systematic change in tissue cellular composition captured by NAM-PC1-k (Methods). (E) We illustrate how the cell state abundance shift shown in (A) might be revealed using GeNA.
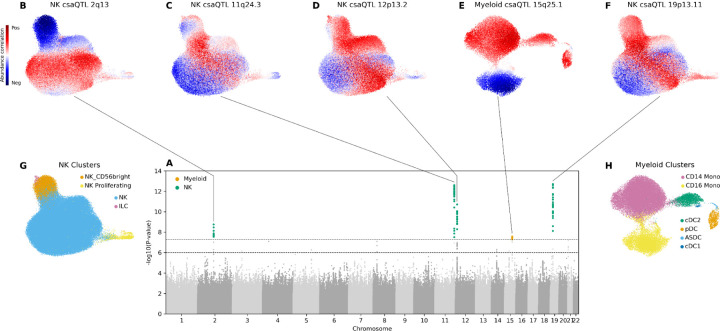
(A) Superimposed Manhattan plots for csaQTL GWASs among NK cell states and among myeloid cell states. A genome-wide significance threshold of p<5×10⁻⁸ is indicated by a dashed line. SNPs with p-values less than this threshold are colored according to their source GWAS: NK cells (green) or myeloid (orange). Another dashed line indicates a p<1×10⁻⁶ threshold for suggestive associations. (B-F) Cell abundance correlation per neighborhood to dose of alternative allele is shown in UMAPs for each of the five genome-wide significant loci: (B) NK csaQTL 2q13, (C) NK csaQTL 11q24.3, (D) NK csaQTL 12p13.2, (E) myeloid csaQTL 15q25.1, and (F) NK csaQTL 19p13.11. (G-H) Cell type cluster labels from Yazar*, Alquicira-Hernandez*, Wing*, et al. for (G) NK and (H) myeloid cells are shown for reference.
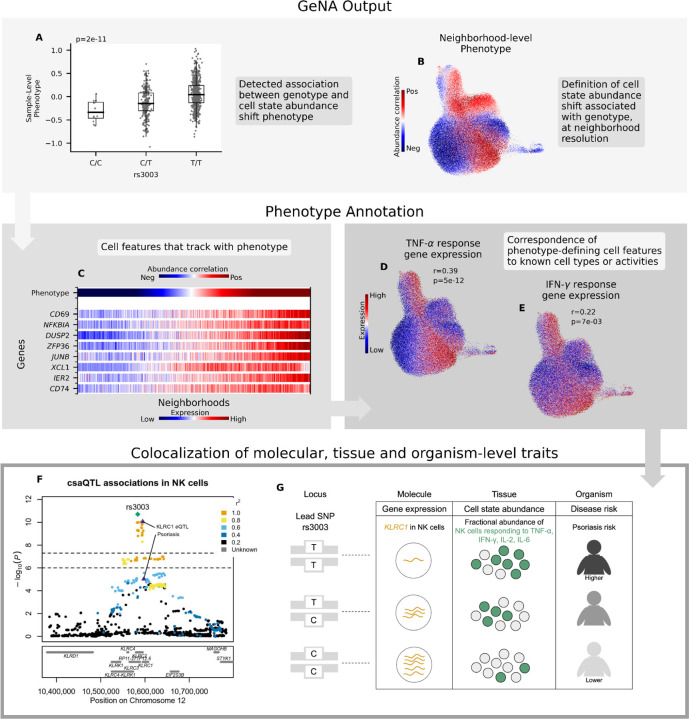
(A-B) GeNA output: (A) Boxplot of sample-level phenotype values for each individual organized by genotype at the lead SNP. We also show the GeNA p-value. (B) UMAP of NK cells colored by neighborhood-level phenotype value (i.e., correlation between cell abundance and dose of alternative allele per neighborhood). (C) Heatmap of expression across neighborhoods for genes with strong correlations in expression to csaQTL neighborhood-level phenotype. Neighborhoods are arrayed along the x-axis by phenotype value. The phenotype-correlated genes include general markers of NK activation (CD69, NFKBIA) as well as TNF-α (DUSP2, ZFP36, JUNB, IER2) and IFN-γ (CD74, XCL1) response genes. (D-E) Gene set enrichment analysis identified significant activation of TNF-α and IFN-γ response pathways in association with the csaQTL phenotype. We show UMAPs of NK cells colored by summed expression of (D) TNF-α response genes and (E) IFN-γ response genes. We report the Pearson’s r across neighborhoods between phenotype values and summed expression within the gene set. We also show the FDR-adjusted gene set enrichment p-value. (F) Locus zoom plot with one marker per tested SNP, genomic position along the x-axis, and GeNA p-value on the y-axis. Each SNP marker is colored by linkage disequilibrium (LD) value relative to the lead SNP. The csaQTL lead SNP is labeled with a green diamond. The psoriasis risk and KLRC1 eQTL lead SNPs are labeled with purple triangles. (G) Diagram of genotypes for the csaQTL lead SNP and colocalizing associations to molecular, tissue and organism-level traits at this locus.
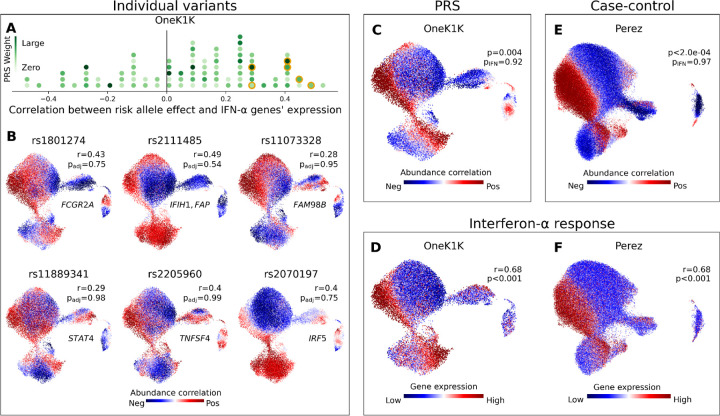
(A) Histogram of SNPs in the SLE PRS. For each SNP, we plot the Pearson’s r correlation across OneK1K myeloid neighborhoods between the SLE risk-associated phenotype and an IFN-α response gene signature. The marker for each risk allele is colored according to its effect weight in the PRS. Six SNPs plotted in (B) are highlighted in orange. (B) We show six SNPs in the SLE PRS for which the myeloid cell state abundance correlations to the SLE risk allele correspond closely to an IFN-α response signature. For each selected SNP, we plot a UMAP of OneK1K myeloid cells colored by the abundance correlation per neighborhood to dose of the risk allele. We also report the gene(s) to which the SNP has been mapped, the Pearson’s r correlation between the neighborhood-level phenotype and IFN-α response signature, and the FDR-adjusted CNA global p-value. (C) Myeloid cell state abundance shift associated with increasing SLE PRS value in the OneK1K cohort. CNA global p values are shown with (pIFN) and without (p) controlling for mean IFN-α response gene expression per individual. (D) IFN-α response gene expression per neighborhood among myeloid cells in the OneK1K cohort. Pearson’s r between IFN-α response per neighborhood and the PRS phenotype from (C) is shown, with associated bootstrapped p-value for r>0. (E) Myeloid cell state abundance shift associated with SLE disease status in the Perez et al. European cohort. CNA global p-values are shown with (pIFN) and without (p) controlling for mean IFN response gene expression per individual. (F) IFN response gene expression per neighborhood among myeloid cells in the Perez et al. European cohort. Pearson’s r between IFN response per neighborhood and SLE phenotype from (E) is shown, with associated bootstrapped p-value for r>0.
References
-
- Yazar S. et al. Single-cell eQTL mapping identifies cell type–specific genetic control of autoimmune disease. Science 376, eabf3041 (2022). - PubMed
Publication types
Grants and funding
LinkOut - more resources
Full Text Sources