[Preprint]. 2023 Nov 17:rs.3.rs-3597070.
doi: 10.21203/rs.3.rs-3597070/v1.

Optimizing the detection of emerging infections using mobility-based spatial sampling

Affiliations

Optimizing the detection of emerging infections using mobility-based spatial sampling

Die Zhang et al. Res Sq. .

Update in

  • Optimizing the detection of emerging infections using mobility-based spatial sampling.
    Zhang D, Ge Y, Wang J, Liu H, Zhang WB, Wu X, B M Heuvelink G, Wu C, Yang J, Ruktanonchai NW, Qader SH, Ruktanonchai CW, Cleary E, Yao Y, Liu J, Nnanatu CC, Wesolowski A, Cummings DAT, Tatem AJ, Lai S. Zhang D, et al. Int J Appl Earth Obs Geoinf. 2024 Jul;131:103949. doi: 10.1016/j.jag.2024.103949. Int J Appl Earth Obs Geoinf. 2024. PMID: 38993519 Free PMC article.

Abstract

Background: Timely and precise detection of emerging infections is crucial for effective outbreak management and disease control. Human mobility significantly influences infection risks and transmission dynamics, and spatial sampling is a valuable tool for pinpointing potential infections in specific areas. This study explored spatial sampling methods, informed by various mobility patterns, to optimize the allocation of testing resources for detecting emerging infections.

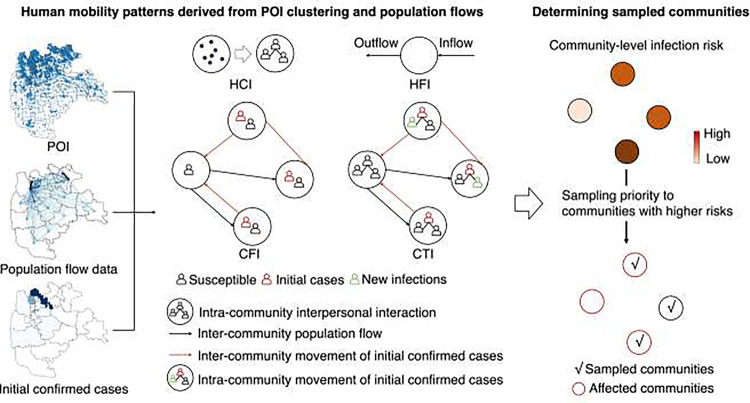
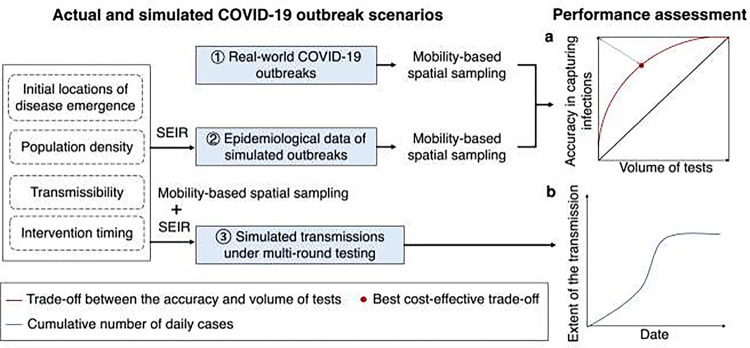
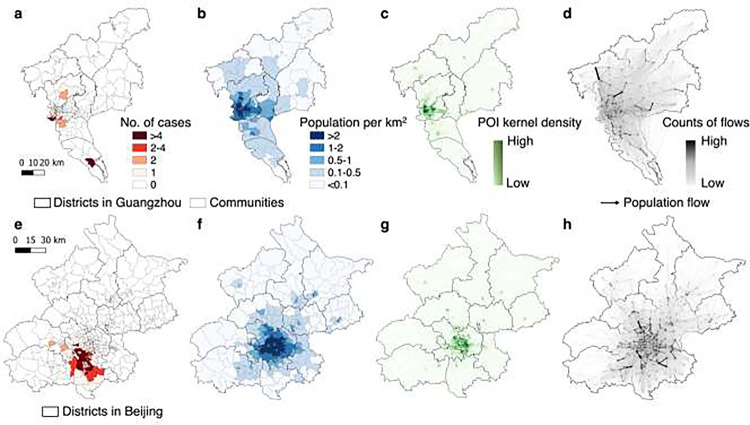
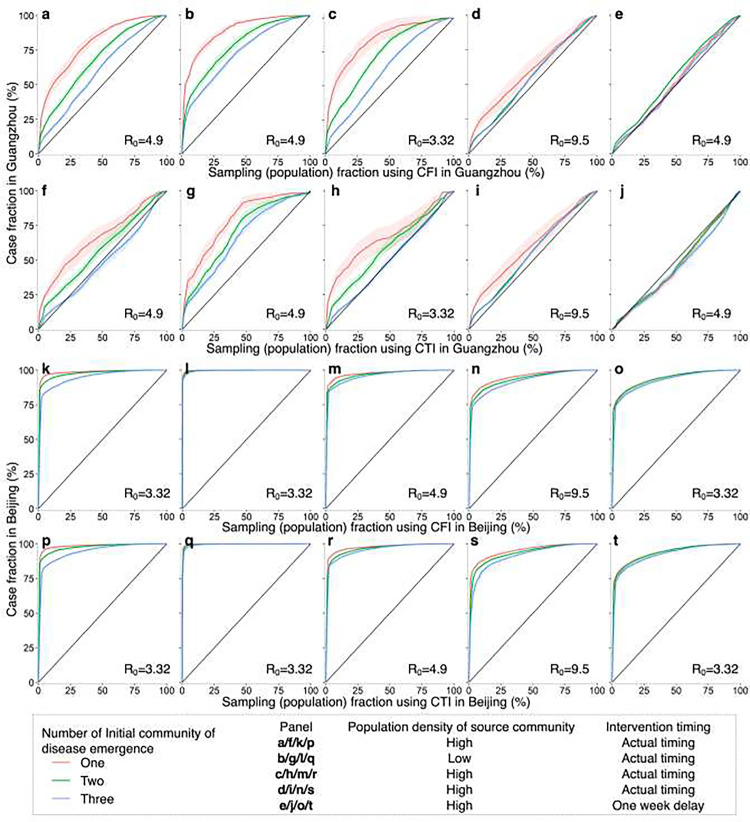
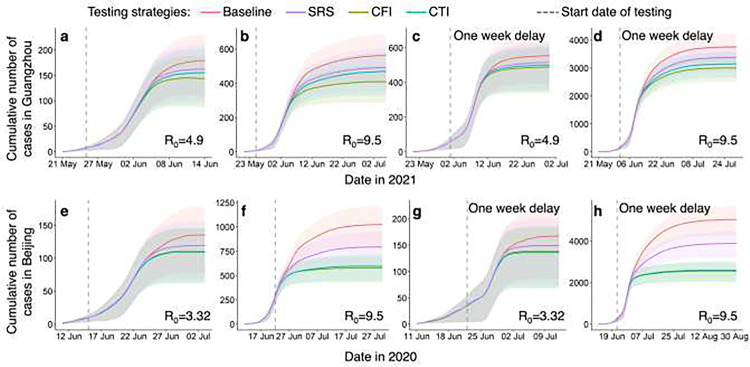
Methods: Mobility patterns, derived from clustering point-of-interest data and travel data, were integrated into four spatial sampling approaches to detect emerging infections at the community level. To evaluate the effectiveness of the proposed mobility-based spatial sampling, we conducted analyses using actual and simulated outbreaks under different scenarios of transmissibility, intervention timing, and population density in cities.

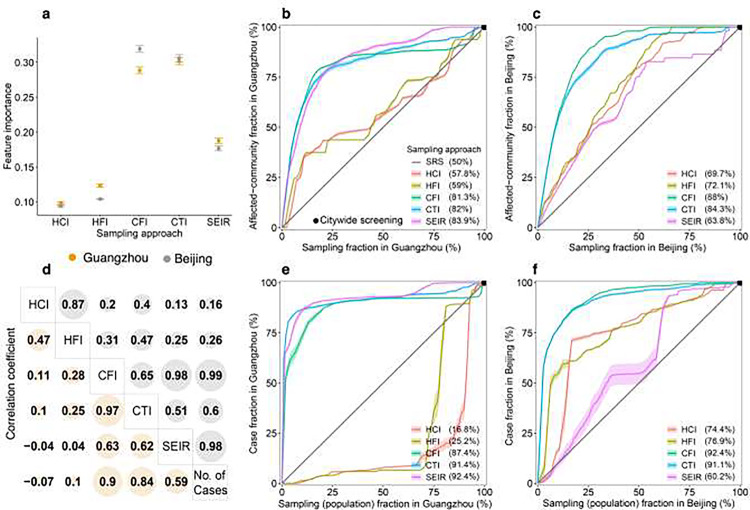
Results: By leveraging inter-community movement data and initial case locations, the proposed case flow intensity (CFI) and case transmission intensity (CTI)-informed sampling approaches could considerably reduce the number of tests required for both actual and simulated outbreaks. Nonetheless, the prompt use of CFI and CTI within communities is imperative for effective detection, particularly for highly contagious infections in densely populated areas.

Conclusions: The mobility-based spatial sampling approach can substantially improve the efficiency of community-level testing for detecting emerging infections. It achieves this by reducing the number of individuals screened while maintaining a high accuracy rate of infection identification. It represents a cost-effective solution to optimize the deployment of testing resources, when necessary, to contain emerging infectious diseases in diverse settings.

Keywords: emerging infectious disease; human mobility; spatial sampling; testing.


Conflict of interest statement

Competing interests The authors declare that they have no competing interests.

Figures

Fig. 1.
Fig. 1.. Framework of mobility-based spatial sampling approaches for detecting emerging infections at the community level.
Utilizing data on Points of Interest (POIs), travel flows derived from mobile phone signaling, and the locations of initial confirmed cases within a city, four spatial sampling approaches were developed: Human Contact Intensity (HCI), Human Flow Intensity (HFI), Case Flow Intensity (CFI), and Case Transmission Intensity (CTI). The spatial sampling prioritizes communities based on infection risk (ρi), where communities with a higher ρi are given higher sampling priorities.
Fig. 2.
Fig. 2.. Framework of assessing the performance of mobility-based spatial sampling approaches to detect emerging infections at the community level.
Based on actual COVID-19 outbreaks and simulated outbreaks using an epidemiological model (SEIR) under the different transmissibility, intervention, and population density scenarios, trade-offs between the volume of tests and the detection of infections throughout an outbreak were employed to estimate the performance of sampling approaches, where the red curve and black diagonal represent the performance of the mobility-based sampling and simple random sampling, respectively. The red dot on the red curve with the least geometric distance to the upper left corner was considered the best cost-effective trade-off. Additionally, spatial sampling was incorporated into SEIR to simulate the disease transmission under multiple rounds of mass testing, where the cumulative number of estimated cases depicted the extent of the transmission within a city. Less cases under an outbreak using a sampling approach indicated a more significant effect on interrupting the spread of the disease.
Fig. 3.
Fig. 3.. Overview of the data context of real-world COVID-19 outbreaks in Guangzhou and Beijing.
a and e, Geospatial distributions of cases at the community level during the importation-related outbreaks. b and f, Geospatial distributions of community-level population density, which were classified into five levels. c and g, Geospatial patterns of point-of-interest (POI) kernel density. d and h, Human mobility patterns across communities within a city before travel restrictions are implemented. The directed lines depict inter-community origin-destination travel networks on 21–22 May 2021 in Guangzhou and 11–12 June 2020 in Beijing, respectively. The width and color of an edge represent the volume of an inter-community flow. In each panel, a darker color indicates a higher level of interest.
Fig. 4.
Fig. 4.. Performance of mobility-based spatial sampling approaches in detecting COVID-19 affected communities and cases at varying sample sizes.
Four mobility-based spatial sampling approaches (HCI - human contact intensity; HFI - human flow intensity; CFI - case flow intensity; CTI - case transmission intensity) and an epidemiological model (SEIR) were evaluated. a. The relative importance of infection risk (ρi) in distinguishing communities with COVID-19 cases from those without, determined by a random forest built-in feature importance measure. Error bars indicate 95% confidence intervals. d. Pearson correlation coefficients between infection risk estimated from each sampling method and the number of confirmed cases during the outbreaks. For panels b-c and e-f, communities with high infection risk were sampled by ranking community-level 𝜌𝑖 from high to low, excluding the simple random sampling (SRS) method. The x-axis in b and c represents the proportion of sampled communities over the total number of communities in Guangzhou and Beijing, respectively. In e and f, the x-axis denotes the fraction of sampled populations among the total populations. The y-axis in b and c represents the proportion of affected communities sampled over the total communities with COVID-19 cases in Guangzhou and Beijing. In e and f, the y-axis displays the proportion of cases detected by different sampling approaches among the total cases. The percentage in the legend indicates the area under each curve, reflecting the average performance of each sampling approach with different sample sizes. The black dot at the upper right corner of each panel represents citywide screening for the entire population, assuming the test can detect all infected people in the city. Shaded regions denote 95% confidence intervals.
Fig. 5.
Fig. 5.. Performance of mobility-based spatial sampling in simulated outbreaks under various scenarios utilizing a travel network-based epidemiological model.
The outbreaks were simulated with initiation in one, two, or three communities selected randomly based on the probability weight of population density or inverse population density. Different basic reproduction numbers (R0) were considered for the original SARS-CoV-2, Delta, and Omicron variants, along with variations in the timing of interventions. The assessment focused on two optimized mobility-based spatial sampling approaches, namely CFI (case flow intensity) and CTI (case transmission intensity). The x-axis represents the fraction of sampled populations among the total populations in Guangzhou and Beijing using CFI and CTI, respectively. The y-axis presents the proportion of cases detected by different sampling approaches in Guangzhou and Beijing, respectively. The diagonal line in each panel symbolizes the performance of simple random sampling, while the shaded regions indicate the 95% confidence intervals.
Fig. 6.
Fig. 6.. Impact of spatial sampling on multi-round testing for detecting infections to contain transmission.
The simulations for Guangzhou and Beijing scenarios are presented in panels a-d and e-h, respectively. Multiple rounds of testing for detecting infections were implemented using spatial sampling and incorporated into the travel network-based epidemiological model (Additional file 1: Text S6). The epidemiological model simulated the epidemic transmission, measured by the daily cumulative cases, under different sampling approaches and outbreak scenarios. The baseline approach of multi-round testing involved the equal allocation of daily testing resources to all communities within a city. However, simple random sampling (SRS), case flow intensity (CFI), and case transmission intensity (CTI) sampled a given number of communities per day and allocated more resources to sampled communities than unsampled areas. Spatial multiple rounds of testing were executed when a community could be sampled several times. The outbreaks were tested under different settings, including various basic reproduction numbers (R0) of the original SARS-CoV-2, Delta, and Omicron variants, and the timing of testing conduction. Detection testing started on the fifth day of an outbreak for panels a-b and e-f, while it began on the twelfth day of the outbreak for panels c-d and g-h. The shaded regions represent the interquartile ranges of the cumulative number of daily cases in the simulated outbreaks.

Similar articles

References

    1. Baker RE, Mahmud AS, Miller IF, Rajeev M, Rasambainarivo F, Rice BL, et al. Infectious disease in an era of global change. Nature Reviews Microbiology. 2022;20(4):193–205. doi: 10.1038/s41579-021-00639-z. - DOI - PMC - PubMed
    1. Haug N, Geyrhofer L, Londei A, Dervic E, Desvars-Larrive A, Loreto V, et al. Ranking the effectiveness of worldwide COVID-19 government interventions. Nature Human Behaviour. 2020;4(12):1303–12. doi: 10.1038/s41562-020-01009-0. - DOI - PubMed
    1. Lopes-Júnior LC, Bomfim E, Silveira DSCd, Pessanha RM, Schuab SIPC, Lima RAG. Effectiveness of mass testing for control of COVID-19: a systematic review protocol. BMJ Open. 2020;10(8):e040413. doi: 10.1136/bmjopen-2020-040413. - DOI - PMC - PubMed
    1. Shen M, Xiao Y, Zhuang G, Li Y, Zhang L. Mass testing—An underexplored strategy for COVID-19 control. The Innovation. 2021;2(2):100114. doi: 10.1016/j.xinn.2021.100114. - DOI - PMC - PubMed
    1. Pavelka M, Van-Zandvoort K, Abbott S, Sherratt K, Majdan M, COVID C, et al. The impact of population-wide rapid antigen testing on SARS-CoV-2 prevalence in Slovakia. Science. 2021;372(6542):635–41. - PMC - PubMed

Publication types

LinkOut - more resources