[Preprint]. 2023 Nov 14:2023.11.10.566510.
doi: 10.1101/2023.11.10.566510.

Microglia Depletion Reduces Human Neuronal APOE4-Driven Pathologies in a Chimeric Alzheimer's Disease Model

Affiliations

Microglia Depletion Reduces Human Neuronal APOE4-Driven Pathologies in a Chimeric Alzheimer's Disease Model

Antara Rao et al. bioRxiv. .

Update in

Abstract

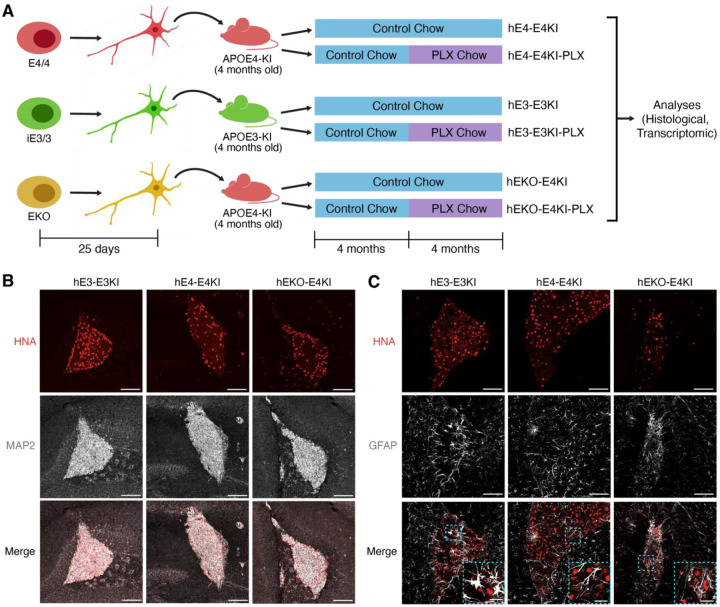
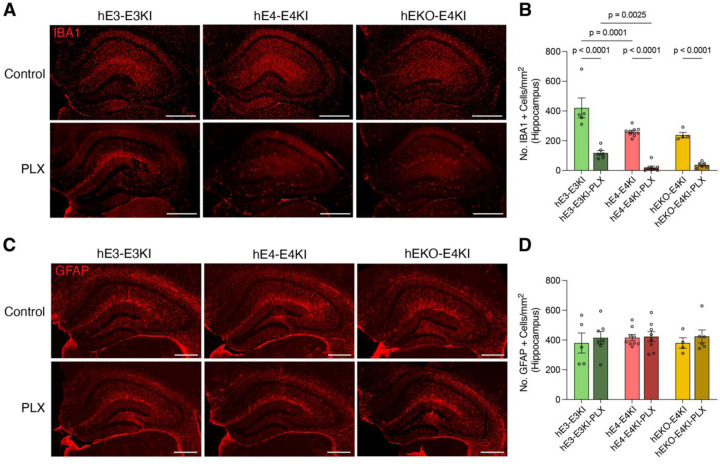
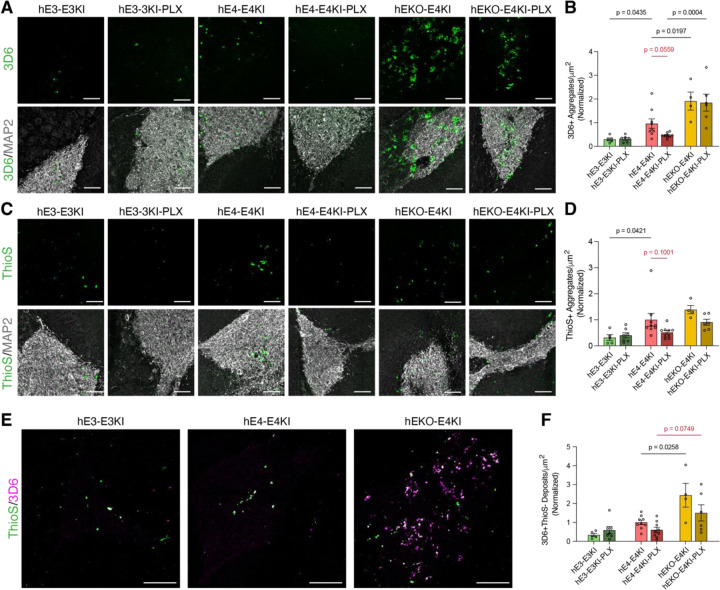
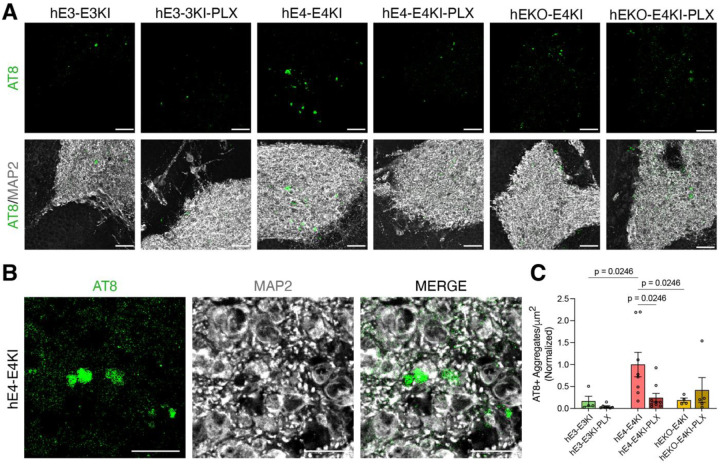
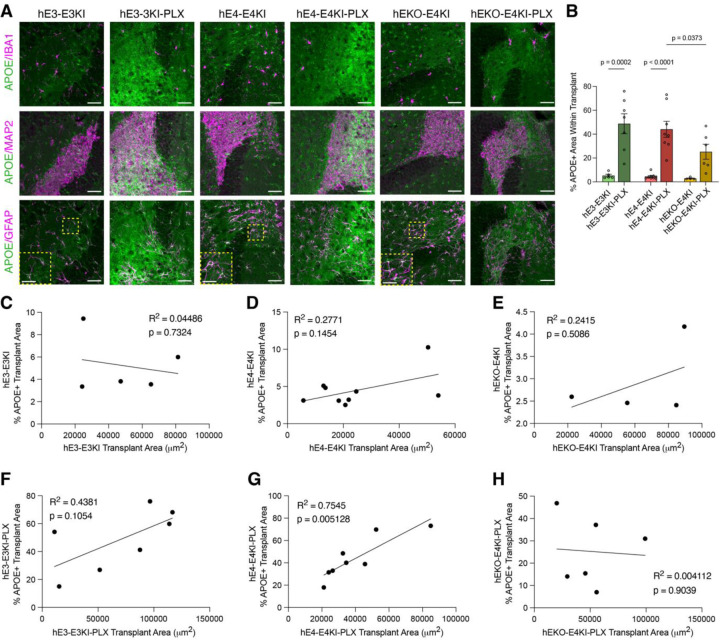
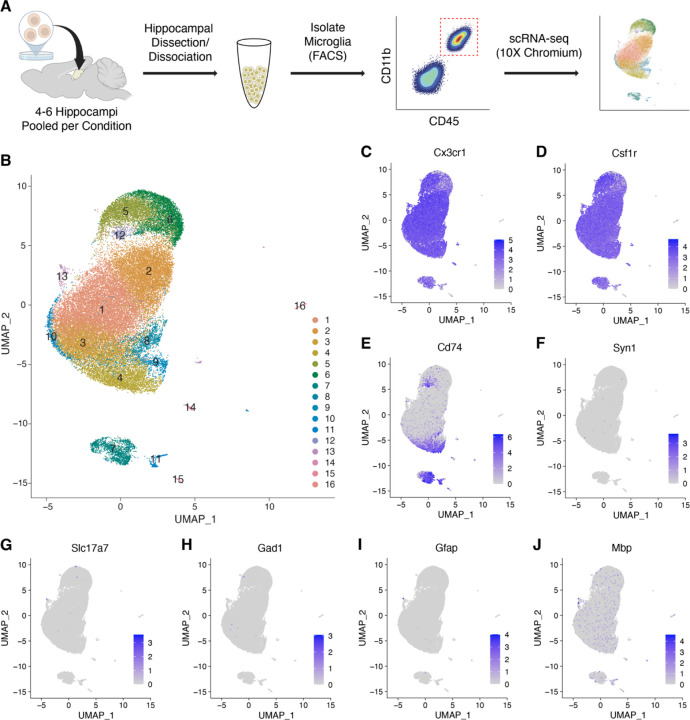
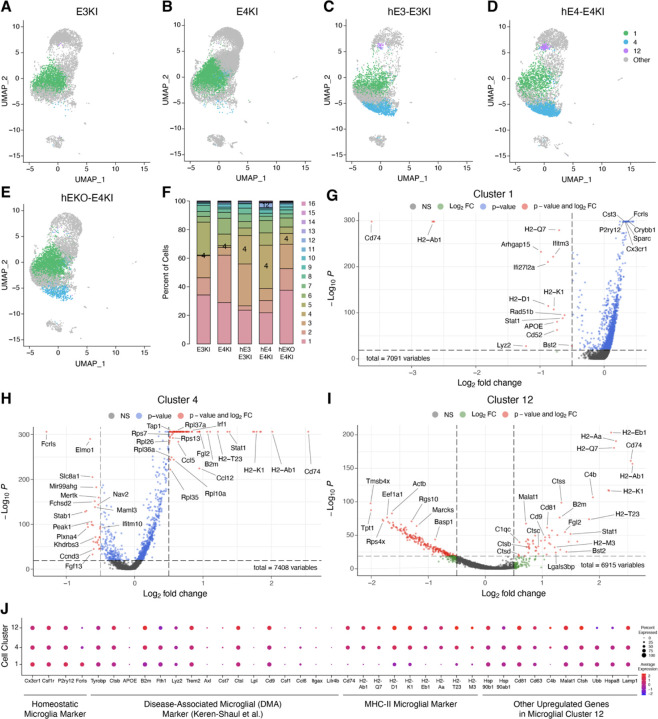
Despite strong evidence supporting the involvement of both apolipoprotein E4 (APOE4) and microglia in Alzheimer's Disease (AD) pathogenesis, the effects of microglia on neuronal APOE4-driven AD pathogenesis remain elusive. Here, we examined such effects utilizing microglial depletion in a chimeric model with human neurons in mouse hippocampus. Specifically, we transplanted homozygous APOE4, isogenic APOE3, and APOE-knockout (APOE-KO) induced pluripotent stem cell (iPSC)-derived human neurons into the hippocampus of human APOE3 or APOE4 knock-in mice, and depleted microglia in half the chimeric mice. We found that both neuronal APOE and microglial presence were important for the formation of Aβ and tau pathologies in an APOE isoform-dependent manner (APOE4 > APOE3). Single-cell RNA-sequencing analysis identified two pro-inflammatory microglial subtypes with high MHC-II gene expression that are enriched in chimeric mice with human APOE4 neuron transplants. These findings highlight the concerted roles of neuronal APOE, especially APOE4, and microglia in AD pathogenesis.


Conflict of interest statement

Declaration of Interests Y.Huang is a cofounder and scientific advisory board member of GABAeron, Inc. Other authors declare no competing financial interests.

Figures

Figure 1.
Figure 1.. Transplanted human neuronal progenitors survive and develop into neurons in chimeric mouse hippocampus.
(A) Experimental design: iPSCs with different APOE genotypes were differentiated into neuronal progenitors and transplanted into human APOE-KI mice. The chimeric mice were aged for 8 months, with half the mice receiving PLX3397 (PLX) for the latter 4 months. Conditions were labeled accordingly, and all mice were used for histological or transcriptomic analysis. (B) Representative immunostaining images of the human cell transplants in the hippocampus of the 12-month-old chimeric mice (8 months post transplantation). Top row: Human Nuclear Antigen (HNA, red) to mark the human cell transplants; second row: human-preferential MAP2 (gray) to mark neurons; third row: composite of HNA and MAP2 images. Scale bar, 100 μm. (C) Representative immunostaining images of the human cell transplants in the hippocampus of the 12-month-old chimeric mice. Stained with HNA (red) for human cell transplants and GFAP (gray) for astrocytes. Top row: Human Nuclear Antigen (HNA, red) to mark the human cell transplants; second row: GFAP (gray) to mark astrocytes; third row: composite of HNA and GFAP images, with magnified image insets showing that HNA+ cells and GFAP+ cells do not overlap. Scale bar, 100 μm. Scale bar for magnified image insets, 25 μm.
Figure 2.
Figure 2.. PLX depletes microglia, but does not affect astrocytes, in chimeric mouse hippocampus.
(A) Representative immunostaining images of microglia (Iba1, red) in the hippocampus of chimeric mice of each condition. Scale bar, 500 μm. (B) Quantification of number/mm2 of Iba1+ microglia in the hippocampus. Each dot represents one mouse per condition (hE3-E3KI, n=5; hE3-E3KI-PLX, n=7; hE4-E4KI, n=9; hE4-E4KI-PLX, n=8; hEKO-E4KI, n=4; hEKO-E4KI-PLX, n=6). (C) Representative immunostaining images of astrocytes (GFAP, red) in the hippocampus of chimeric mice of each condition. Scale bar, 500 μm. (D) Quantification of number/mm2 of GFAP+ astrocytes in the hippocampus. Each dot represents one mouse per condition (hE3-E3KI, n=5; hE3-E3KI-PLX, n=7; hE4-E4KI, n=9; hE4-E4KI-PLX, n=8; hEKO-E4KI, n=4; hEKO-E4KI-PLX, n=6). All data are expressed as mean ± S.E.M. Differences between groups were determined by two-way ANOVA with Benjamini’s post hoc test for multiple comparisons.
Figure 3.
Figure 3.. Human neuronal APOE isoform and microglial depletion affect Aβ pathology in chimeric mouse hippocampus.
(A) Representative immunohistochemical images of Aβ aggregates within and immediately surrounding human neuronal transplants. Top row: 3D6+ Aβ aggregates (green); second row: composite of 3D6+ Aβ aggregates (green) and MAP2+ (gray) human neuron transplants. Scale bar, 50 μm. (B) Quantification of number of 3D6+ Aβ aggregates/μm2 within a 100 μm perimeter per transplant area (hE3-E3KI, n=5; hE3-E3KI-PLX, n=6; hE4-E4KI, n=9; hE4-E4-KI-PLX, n=9; hEKO-E4KI, n=4; hEKO-E4KI-PLX, n=6). (C) Representative immunohistochemical images of Thioflavin-S+ dense-core Aβ aggregates within and immediately surrounding human neuronal transplants. Top row: Thioflavin-S+ dense-core Aβ aggregates (green); second row: composite of Thioflavin-S+ dense-core Aβ aggregates (green) and MAP2+ (gray) human neuron transplants. Scale bar, 50 μm. (D) Quantification of number of Thioflavin-S+ dense-core Aβ aggregates/μm2 within a 100 μm perimeter per transplant area (hE3-E3KI, n=5; hE3-E3KI-PLX, n=7; hE4-E4KI, n=9; hE4-E4KI-PLX, n=9; hEKO-E4KI, n=4; hEKO-E4KI-PLX, n=6). (E) Representative immunohistochemical images of 3D6+ Aβ aggregates (magenta) and Thioflavin-S+ dense-core Aβ aggregates (green) within human neuron transplants. Diffuse Aβ aggregates were defined as 3D6+/Thioflavin-S aggregates. Scale bar, 100 μm. (F) Quantification of number of diffuse (3D6+/Thioflavin-S) Aβ deposits/μm2 within a 100 μm perimeter per transplant area (hE3-E3KI, n=5; hE3-E3KI-PLX, n=7; hE4-E4KI, n=9; hE4-E4KI-PLX, n=9; hEKO-E4KI, n=4; hEKO-E4KI-PLX, n=6). For all quantifications, values are normalized to the hE4-E4KI condition, and each dot represents one mouse per condition. All data are expressed as mean ± S.E.M. Differences between groups were determined by two-way ANOVA with Benjamini’s post hoc test for multiple comparisons. Comparisons of P<0.05 were considered significant and are displayed in black. Comparisons of 0.05<P<0.11 are displayed in red.
Figure 4.
Figure 4.. Human neuronal APOE isoform and microglial depletion affect p-tau pathology in chimeric mouse hippocampus.
(A) Representative immunohistochemical images of p-tau aggregates within and immediately surrounding human neuronal transplants. Top row: AT8+ p-tau aggregates (green); second row: composite of AT8+ p-tau aggregates (green) and MAP2+ (gray) human neuron transplants. Scale bar, 50 μm. (B) Many AT8+ p-tau aggregates are present within transplanted MAP2+ human neurons. Each image represents the same field of view, stained for p-tau (AT8, green, first column), human neuronal transplants (MAP2, gray, second column), and a composite of AT8 and MAP2 (third column). Scale bar, 20 μm. (C) Quantification of number of AT8+ p-tau aggregates/μm2 within a 100 μm perimeter per transplant area. Values are normalized to the hE4-E4KI condition, and each dot represents one mouse per condition (hE3-E3KI, n=4; hE3-E3KI-PLX, n=7; hE4-E4KI, n=8; hE4-E4KI-PLX, n=9; hEKO-E4KI, n=4; hEKO-E4KI-PLX, n=5). All data are expressed as mean ± S.E.M. Differences between groups were determined by two-way ANOVA with Benjamini’s post hoc test for multiple comparisons.
Figure 5.
Figure 5.. Microglial depletion increases APOE levels within human neuronal transplants.
(A) Representative immunohistochemical images of APOE within human neuronal transplants. Each column represents the same field of view, with a composite of APOE (green) with Iba1+ microglia (magenta, top row), MAP2+ human neuron transplants (magenta, second row), and GFAP+ astrocytes (magenta, third row, with magnified image insets showing APOE and GFAP overlap). Scale bar, 50 μm. Scale bar for magnified insets, 25 μm. (B) Quantification of average APOE fluorescence intensity within the human neuron transplants. Values are normalized to the hE4-E4KI condition, and each dot represents one mouse per condition (hE3-E3KI, n=5; hE3-E3KI-PLX, n=7; hE4-E4KI, n=9; hE4-E4KI-PLX, n=8; hEKO-E4KI, n=4; hEKO-E4KI-PLX, n=6). All data are expressed as mean ± S.E.M. Differences between groups were determined by two-way ANOVA with Benjamini’s post hoc test for multiple comparisons. (C) Correlations for each condition between % ApoE+ transplant area and size of transplants. Each dot represents one mouse per condition (hE3-E3KI, n=5; hE3-E3KI-PLX, n=7; hE4-E4KI, n=9; hE4-E4KI-PLX, n=8; hEKO-E4KI, n=4; hEKO-E4KI-PLX, n=6). Pearson’s correlation analyses (two-sided).
Figure 6.
Figure 6.. Transcriptional characterization of hippocampal microglia in chimeric mouse hippocampus.
(A) Workflow summarizing isolation of CD11b+/CD45int microglia from the pooled hippocampi of chimeric mice and untransplanted controls for each genotype group (N = 4–6 hippocampi per condition) for scRNA-seq. (B) Uniform manifold approximation and projection (UMAP) clustering of isolated hippocampal microglia. 16 microglial clusters were identified. (C–D) Feature plots displaying strong expression of microglial markers Cx3cr1 and Csf1r demonstrate that nearly all cells sequenced are of microglial identity. (E) Feature plot displaying expression of Cd74 in select clusters. (F-J) Feature plots displaying very sparse or non-existent expression of non-microglial cell-type markers, including Syn1 (neurons), Slc17a7 (excitatory neurons), Gad1 (inhibitory neurons), Gfap (astrocytes), and Mbp (oligodendrocytes).
Figure 7.
Figure 7.. Pro-inflammatory microglia subpopulations enriched in hE4-E4KI mouse hippocampus.
(A–E) Feature plots highlighting cells in microglial clusters 1 (green), 4 (blue), and 12 (purple). (F) Quantification of fraction of cells per condition for clusters 1, 4, and 12. (G–I) Volcano plot of the DEGs between cluster 1 (G), cluster 4 (H), or cluster 12 (I) and all other clusters. Dashed lines represent log2 fold change threshold of 0.5 and p-value threshold of 10 × 10−20. NS, not significant. (J) Dot plot of normalized average expression of selected marker genes for clusters 1, 4, and 12. The size of the dots is proportional to the percentage of cells expressing a given gene.

Similar articles

References

    1. Corder E. H. et al. Gene dose of apolipoprotein E type 4 allele and the risk of Alzheimer’s disease in late onset families. Science 261, 921–923 (1993). - PubMed
    1. Corder E. H. et al. Protective effect of apolipoprotein E type 2 allele for late onset Alzheimer disease. Nat. Genet. 7, 180–184 (1994). - PubMed
    1. Huang Y. & Mucke L. Alzheimer mechanisms and therapeutic strategies. Cell 148, 1204–1222 (2012). - PMC - PubMed
    1. Koutsodendris N., Nelson M. R., Rao A. & Huang Y. Apolipoprotein E and Alzheimer’s Disease: Findings, Hypotheses, and Potential Mechanisms. Annu. Rev. Pathol. Mech. Dis. 17, 73–99 (2022). - PubMed
    1. Long J. M. & Holtzman D. M. Alzheimer Disease: An Update on Pathobiology and Treatment Strategies. Cell 179, 312–339 (2019). - PMC - PubMed

Publication types