[Preprint]. 2024 Sep 13:2023.11.10.566306.
doi: 10.1101/2023.11.10.566306.

Nucleus accumbens dopamine release reflects Bayesian inference during instrumental learning

Affiliations

Nucleus accumbens dopamine release reflects Bayesian inference during instrumental learning

Albert J Qü et al. bioRxiv. .

Update in

Abstract

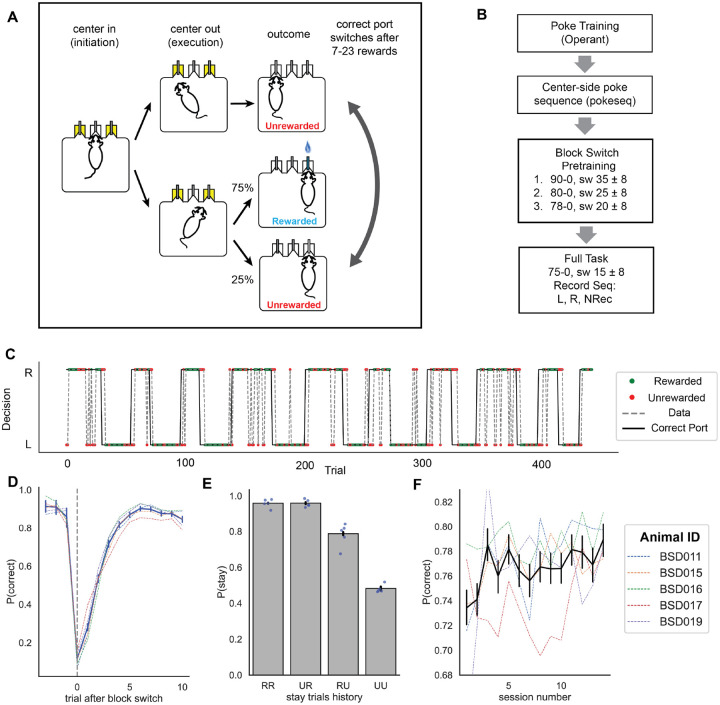
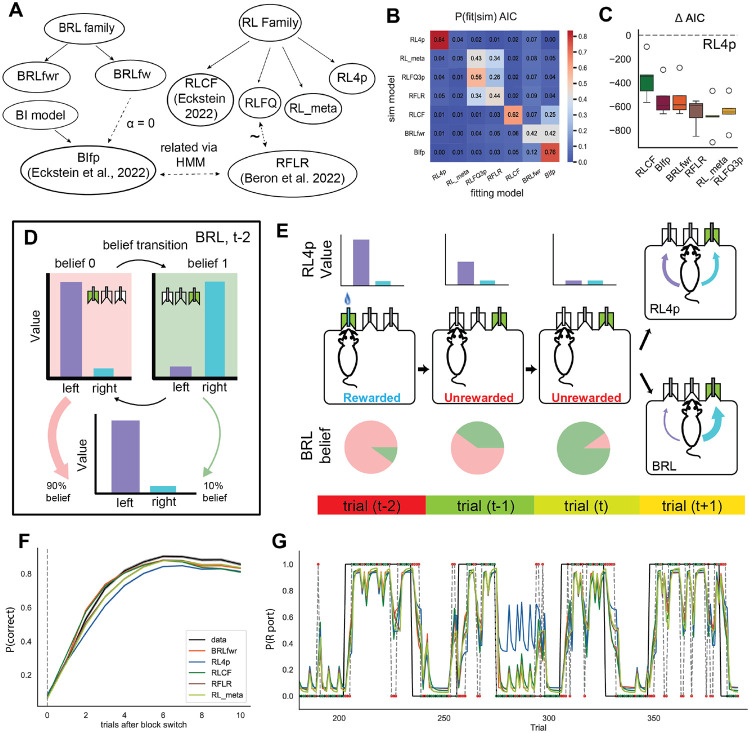
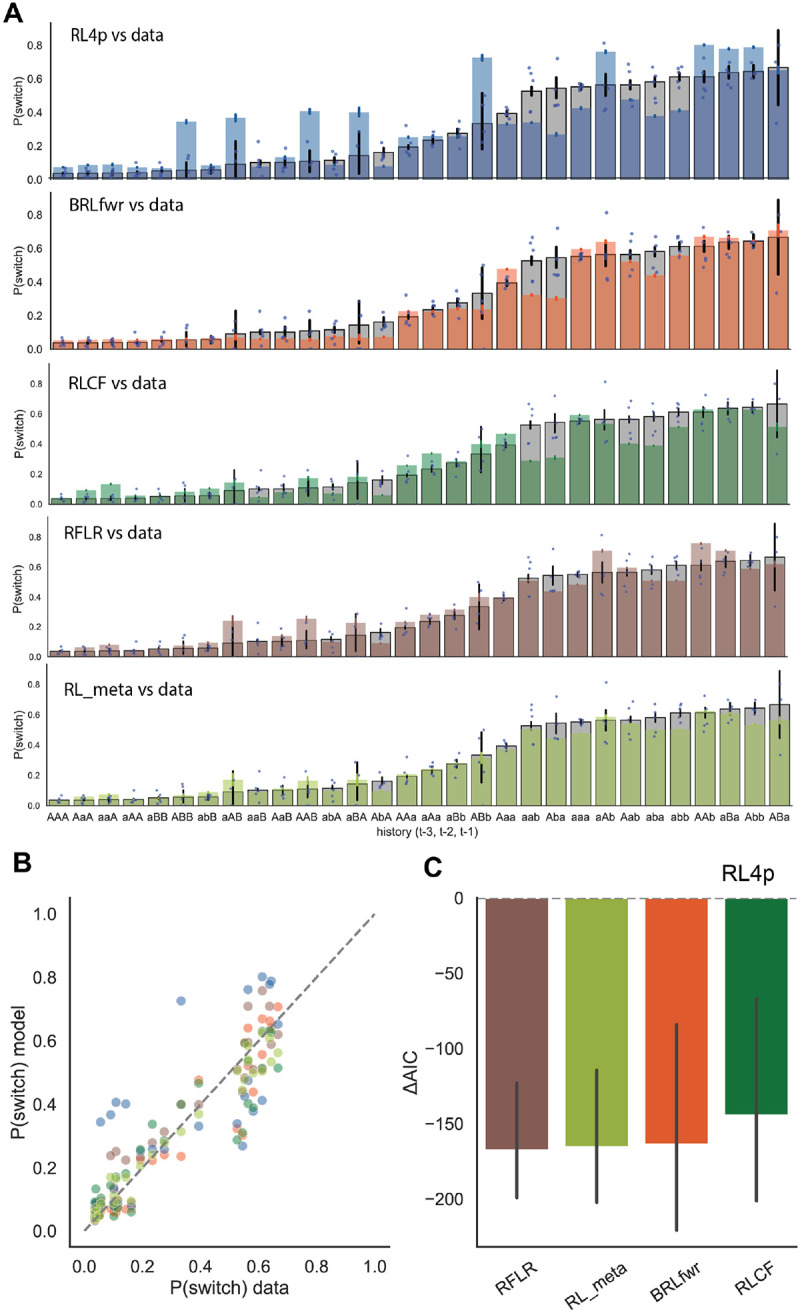
Dopamine release in the nucleus accumbens has been hypothesized to signal reward prediction error, the difference between observed and predicted reward, suggesting a biological implementation for reinforcement learning. Rigorous tests of this hypothesis require assumptions about how the brain maps sensory signals to reward predictions, yet this mapping is still poorly understood. In particular, the mapping is non-trivial when sensory signals provide ambiguous information about the hidden state of the environment. Previous work using classical conditioning tasks has suggested that reward predictions are generated conditional on probabilistic beliefs about the hidden state, such that dopamine implicitly reflects these beliefs. Here we test this hypothesis in the context of an instrumental task (a two-armed bandit), where the hidden state switches repeatedly. We measured choice behavior and recorded dLight signals reflecting dopamine release in the nucleus accumbens core. Model comparison among a wide set of cognitive models based on the behavioral data favored models that used Bayesian updating of probabilistic beliefs. These same models also quantitatively matched the dopamine measurements better than non-Bayesian alternatives. We conclude that probabilistic belief computation contributes to instrumental task performance in mice and is reflected in mesolimbic dopamine signaling.


Figures

Figure 1:
Figure 1:. Mice adapt rapidly to block switches in a probabilistic reversal task.
(A) Illustration of the two-armed bandit task, divided into initiation, execution, and outcome phases. In the illustrated trial, the right port is rewarded with 0.75 probability and the left port is unrewarded. After 7–23 rewarded trials, the correct port switches. (B) Training protocol. The recording phase took place in the “Full Task” phase. In the pretraining phases, the structure of the task was the same as the in the full task phase, except the reward contingencies and block lengths were different. Each contingency is labeled by numbers indicating the proportion of correct and incorrect choices that were rewarded. For example, “90–0” in the first pretraining phase indicates that 90% of correct choices were rewarded. The block length in each phase is indicated by its mean and range. For example, “sw 35 ± 8” in the first pretraining phase indicates that switches occurred after the animal earned between 27 and 43 rewards. During the 14 sessions of mice behavior data collection, we recorded dLight signals using a “left hemisphere (L), right hemisphere (R), no neural recording pure behavior (NRec)” sequence. (C) Raw behavioral trajectory taken from the first half of a sample session. Black line indicates correct reward port locations while dashed gray line indicates actual mouse behavior. Green dots and red dots mark rewarded and unrewarded trials, respectively. (D) Probability of making a correct choice (i.e., choosing the high probability port) as a function of the number of trials around a block switch. The vertical dashed line shows trials at which rewarded block changes. Each colored dashed line plot shows behavioral performance for individual animals. (E) Probability of staying (repeating the last choice) after experiencing different outcome histories in the same port. RR: two consecutive rewards; UR: unrewarded outcome followed by rewarded; RU: rewarded outcome followed by unrewarded; UU: two consecutive unrewarded outcomes. (F) Performance across 14 sessions. Dashed lines show individual animal trajectories. Error bars show 95% bootstrapped confidence intervals.
Figure 2:
Figure 2:. Bayesian and reinforcement learning models.
(A) Relationships between cognitive models (see Methods for more details). (B) Confusion matrix outlines results for model identification analysis. Each entry i, j represents the percentage of time that the column j fitting model best explained data generated by row i simulating model. The row orders are sorted via dendrogram based on model similarity (see Methods). (C) Model comparison using relative AIC compared to RL4p: △AIC = AIC(model) - AIC(RL4p), with lower values indicating better fit. (D) Illustration of value computation for BRL model family, which updates beliefs via Bayes’ rule and then uses these beliefs to compute values. (E) Illustration using a four-trial sequence to show the differences between RL4p and BRL. Top: purple and cyan bars show the choice values conditioned on the belief state; Bottom: pie charts show the belief state for BRL; the animal’s policy is selected as a function of the value within their belief states. (F) Behavior of different models compared to mouse data (black line). Trial 0 is when the program has switched the rewarded side in a block switch. (G) Example behavioral trajectory (probability of choosing the rightward port) predicted by different models. Mouse data are marked by a dashed line and block structure is marked by a solid line. Rewarded trials are marked as green dots and unrewarded trials are marked as red dots. Error bars show 95% bootstrapped confidence intervals.
Figure 3:
Figure 3:. BRL and complex RL models outperform standard RL by better explaining mouse behaviors around block switches.
(A) Switch probability by different trial outcome histories described by action-outcome pairs three trials back. Gray bars showed mouse average probability of switching for each outcome history, deep blue dots represent individual mice. From top to bottom: mouse data overlaid with BRLfwr, RL4p, RLCF, RFLR, RL_meta model predictions of switch rate, respectively. (B) Switch probability predicted by different models scales with probability of mice switching port selections in different outcome contexts described. Colors represent different models, sharing the same legend as C (orange: BRLfwr, wine red: BIfp, dark green: RLCF, brown: RFLR, blue: RL4p) (C) Relative AIC with respect to RL4p (dashed line at ΔAIC = 0) showing model fit to mouse data around block switch. Error bars show 95% bootstrapped confidence intervals.
Figure 4:
Figure 4:. NAc dLight dopamine dynamics consistent with RPE predictions by models with Bayesian inference.
(A) Implant fiber locations indicated on mouse brain atlas with red crosses. (B-C) Trial average of NAc dLight signals (z-scored, as described in Methods) aligned to outcome events. Shaded area indicates the one second where the peak or trough is taken for neural regression. (B) shows switch trials and (C) shows stay trials. Rewarded trials are in blue and unrewarded trials are in red. Trials where mice picked the port contralateral to the recording hemisphere are plotted with solid lines; trials in which mice picked the ipsilateral port are plotted with dashed lines. (D-E) Example session single trial dLight responses plotted in heatmaps, trials sorted by the time mice spent in the reward port (see Methods for further details). (D) shows a heatmap for unrewarded trials, and (E) shows rewarded trials. Increase in dLight signal is indicated by brighter shades of red and decreases from baseline are indicated by darker shades of black. Dots are used to mark “center out” (yellow), “outcome” (green), “first side out” (purple), “center in” (gray) events, respectively. (F) Result of neural regression using model RPE values to explain dopamine variability. Fit is measured as cross validated log-likelihood (llk_CV) relative to the RL4p model, with higher values indicating a better fit. Gray dashed line indicates the baseline of RL4p RPE fitted to dopamine measurements. (G) Dopamine response on rewarded trials binned by past history, sorted in increasing order of number and recency of rewards (note in all cases mice stayed with the same port ‘a/A’ for all three trials). (H) RPE predictions from different models plotted against dopamine peak values (in black). (I) Left: Relative change in dopamine as R_chosen (past rewards observed at the selected port) and R_unchosen (past rewards observed at the opposing port) change, calculated via LMER regression weights for dopamine observed in trials where the animals switched their port choices (animal switch trials). Right: Relative change in model RPE as R_chosen and R_unchosen change, calculated via regressions using model RPE predictions. (J) Similar to I, but for trials where the animal maintained their previous port selections (animal stay trials). Error bars show 95% bootstrapped confidence intervals.

Similar articles

References

    1. Sutton Richard S. and Barto Andrew G.. Reinforcement learning: an introduction. Second edition. Adaptive computation and machine learning series. Cambridge, Massachusetts: The MIT Press, 2018. ISBN: 978-0-262-03924-6.
    1. Gläscher Jan, Hampton Alan N., and O’Doherty John P.. “Determining a Role for Ventromedial Prefrontal Cortex in Encoding Action-Based Value Signals During Reward-Related Decision Making”. en. In: Cerebral Cortex 19.2 (Feb. 2009), pp. 483–495. ISSN: 1460–2199, 1047–3211. DOI: 10.1093/cercor/bhn098. URL: https://academic.oup.com/cercor/article-lookup/doi/10.1093/cercor/bhn098 (visited on 09/27/2023). - DOI - DOI - PMC - PubMed
    1. Hauser Tobias U. et al. “Cognitive flexibility in adolescence: Neural and behavioral mechanisms of reward prediction error processing in adaptive decision making during development”. en. In: NeuroImage 104 (Jan. 2015), pp. 347–354. ISSN: 10538119. DOI: 10.1016/j.neuroimage.2014.09.018. URL: https://linkinghub.elsevier.com/retrieve/pii/S1053811914007605 (visited on 09/27/2023). - DOI - PMC - PubMed
    1. Santacruz Samantha R. et al. “Caudate Microstimulation Increases Value of Specific Choices”. en. In: Current Biology 27.21 (Nov. 2017), 3375–3383.e3. ISSN: 09609822. DOI: 10.1016/j.cub.2017.09.051. URL: https://linkinghub.elsevier.com/retrieve/pii/S0960982217312496 (visited on 09/27/2023). - DOI - PMC - PubMed
    1. Montague Pr, Dayan P, and Sejnowski Tj. “A framework for mesencephalic dopamine systems based on predictive Hebbian learning”. en. In: J. Neurosci. 16.5 (Mar. 1996), pp. 1936–1947. ISSN: 0270–6474, 1529–2401. DOI: 10.1523/JNEUROSCI.16-05-01936.1996. URL: https://www.jneurosci.org/lookup/doi/10.1523/JNEUROSCI.16-05-01936.1996 (visited on 07/30/2023). - DOI - DOI - PMC - PubMed

Publication types