. 2023 Jun;1(1):100002.
doi: 10.1016/j.chstcc.2023.100002. Epub 2023 Mar 22.

Early Serial Echocardiographic and Ultrasonographic Findings in Critically Ill Patients With COVID-19

Collaborators, Affiliations

Early Serial Echocardiographic and Ultrasonographic Findings in Critically Ill Patients With COVID-19

Michael J Lanspa et al. CHEST Crit Care. 2023 Jun.

Abstract

Background: Cardiac function of critically ill patients with COVID-19 generally has been reported from clinically obtained data. Echocardiographic deformation imaging can identify ventricular dysfunction missed by traditional echocardiographic assessment.

Research question: What is the prevalence of ventricular dysfunction and what are its implications for the natural history of critical COVID-19?

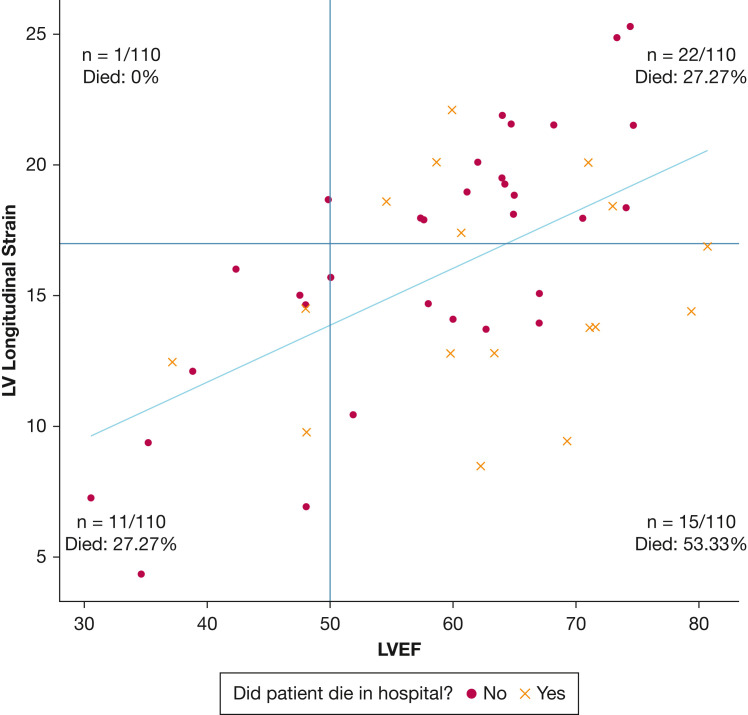
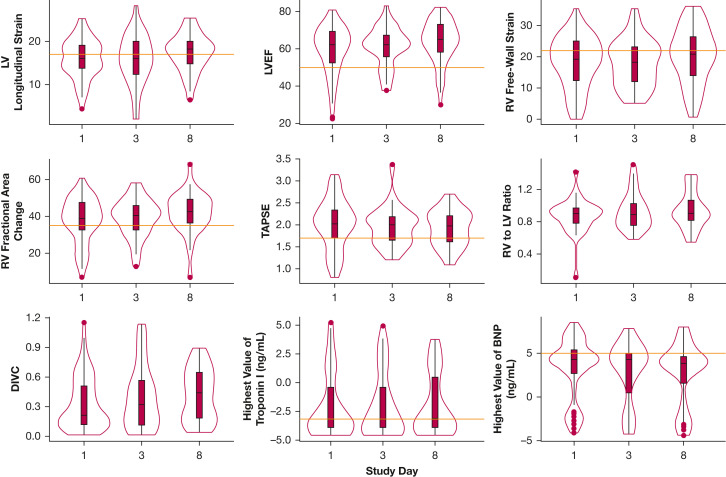
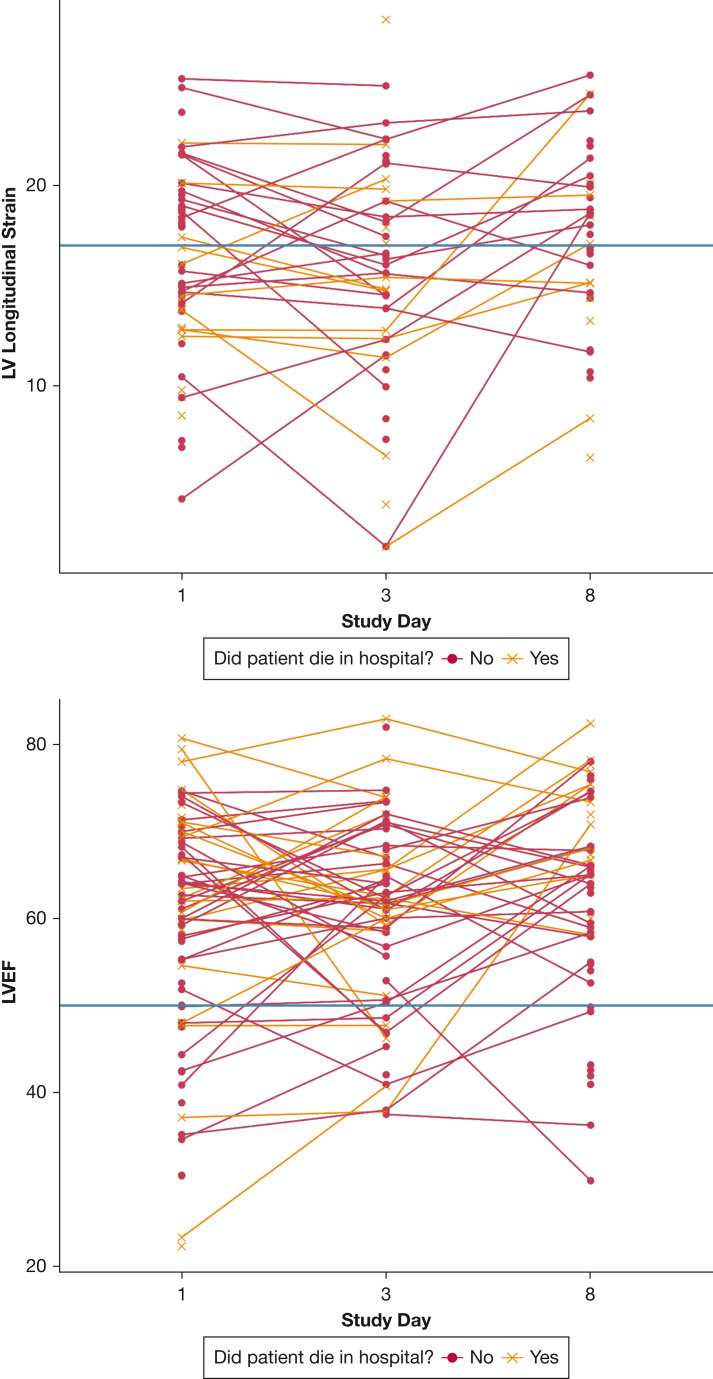
Study design and methods: This is a multicenter prospective cohort of critically ill patients with COVID-19. We performed serial echocardiography and lower extremity vascular ultrasound on hospitalization days 1, 3, and 8. We defined left ventricular (LV) dysfunction as the absolute value of longitudinal strain of < 17% or left ventricle ejection fraction (LVEF) of < 50%. Primary clinical outcome was inpatient survival.

Results: We enrolled 110 patients. Thirty-nine (35.5%) died before hospital discharge. LV dysfunction was present at admission in 38 patients (34.5%) and in 21 patients (36.2%) on day 8 (P = .59). Median baseline LVEF was 62% (interquartile range [IQR], 52%-69%), whereas median absolute value of baseline LV strain was 16% (IQR, 14%-19%). Survivors and nonsurvivors did not differ statistically significantly with respect to day 1 LV strain (17.9% vs 14.4%; P = .12) or day 1 LVEF (60.5% vs 65%; P = .06). Nonsurvivors showed worse day 1 right ventricle (RV) strain than survivors (16.3% vs 21.2%; P = .04).

Interpretation: Among patients with critical COVID-19, LV and RV dysfunction is common, frequently identified only through deformation imaging, and early (day 1) RV dysfunction may be associated with clinical outcome.

Keywords: COVID-19; echocardiography; point-of-care ultrasound; strain; ultrasound.


Figures

Figure 1
Figure 1
Scatterplot showing LV global strain (y-axis) vs LVEF (x-axis) at day 1 in 49 patients in whom both were measured. Strain measurements were converted to absolute values. The plot area was divided into four quadrants by the red lines, which indicate the lower threshold for normal strain and ejection fraction: normal strain and low LVEF (one patient), normal strain and normal LVEF (22 patients), abnormal strain and normal LVEF (15 patients), and abnormal strain and low LVEF (11 patients). Patients who died are represented by an ‘×,’ whereas patients who survived are represented by a dot. The percentage of patients who died was highest among those with abnormal strain and normal LVEF (53.33% mortality). The blue line is the best fit linear regression line representing the relationship between strain and LVEF. Patients with values beneath the linear regression line (indicating lower strain than predicted based on LVEF) showed higher mortality than those with values higher than the line (indicating higher strain than predicted based on LVEF). LV = left ventricle; LVEF = left ventricle ejection fraction.
Figure 2
Figure 2
Violin plots showing cardiac characteristics of 110 critically ill patients with COVID-19 over time. The violin plot is a hybrid of a boxplot and a kernel density plot, which depicts summary statistics and the density of each variable. Left ventricular longitudinal strain was converted to an absolute value. BNP and troponin I were log-transformed. Red horizontal lines indicate lower thresholds for normal. BNP = B-type natriuretic peptide; DIVC = distensibility index of the inferior vena cava; LV = left ventricle; LVEF = left ventricular ejection fraction; RV = right ventricle; TAPSE = tricuspid annular plane systolic excursion.
Figure 3
Figure 3
A-B, Graphs showing changes in LV strain (A) and LVEF (B) over time among 110 critically ill patients with COVID-19. LV strain was converted to absolute values. Horizontal lines indicate lower thresholds for normal LV strain and LVEF. LV = left ventricle; LVEF = left ventricular ejection fraction.

References

    1. WHO coronavirus (COVID-19) dashboard. World Health Organization. Accessed November 23, 2021. https://www.who.int/emergencies/diseases/novel-coronavirus-2019
    1. Arentz M., Yim E., Klaff L., et al. Characteristics and outcomes of 21 critically ill patients with COVID-19 in Washington state. JAMA. 2020;323(16):1612–1614. - PMC - PubMed
    1. Zheng Y.Y., Ma Y.T., Zhang J.Y., Xie X. COVID-19 and the cardiovascular system. Nat Rev Cardiol. 2020;17(5):259–260. - PMC - PubMed
    1. Danzi G.B., Loffi M., Galeazzi G., Gherbesi E. Acute pulmonary embolism and COVID-19 pneumonia: a random association? Eur Heart J. 2020;41(19):1858. - PMC - PubMed
    1. Choi J.O., Shin D.H., Cho S.W., et al. Effect of preload on left ventricular longitudinal strain by 2D speckle tracking. Echocardiography. 2008;25(8):873–879. - PubMed