

Effect of temperature on the CO2 splitting rate in a DBD microreactor
- PMID: 38014416
- PMCID: PMC10443439
- DOI: 10.1039/d3re00113j
Effect of temperature on the CO2 splitting rate in a DBD microreactor
Abstract
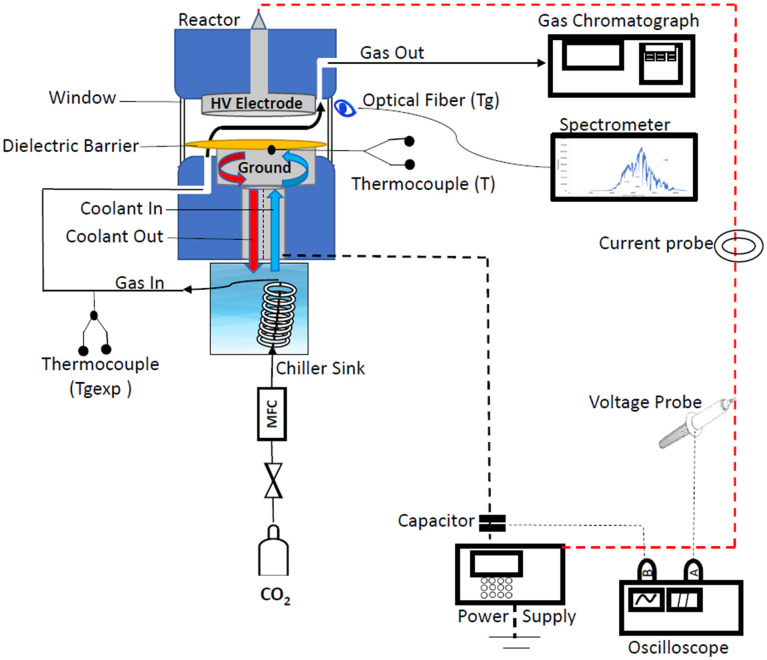
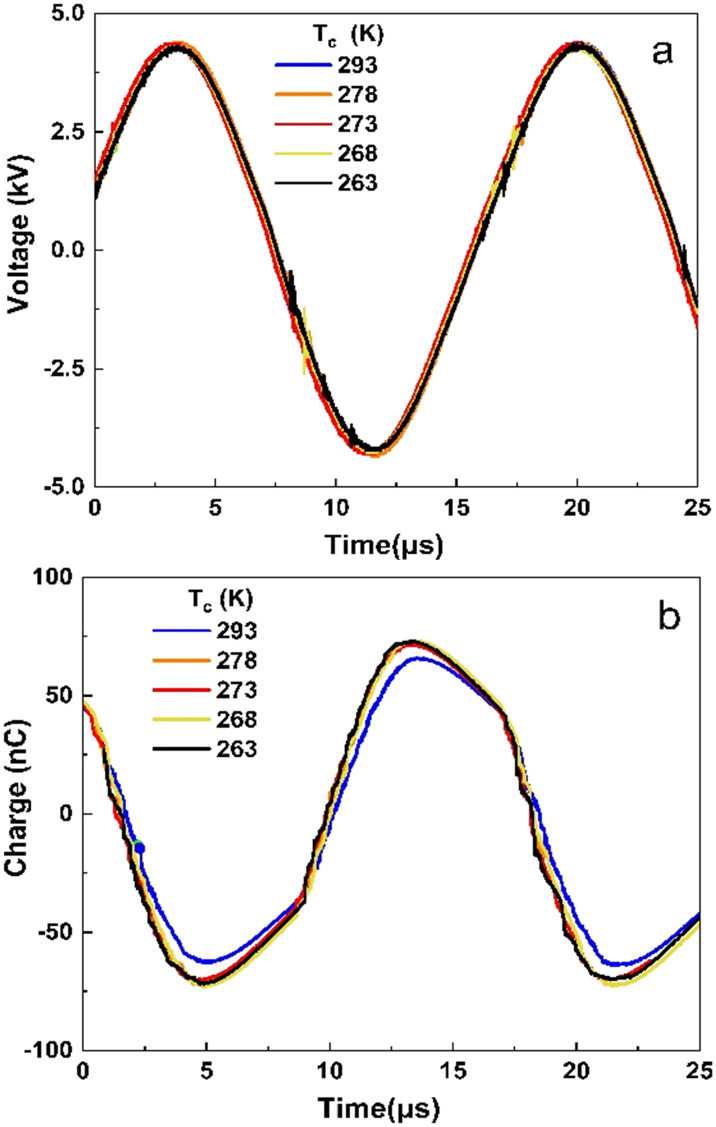
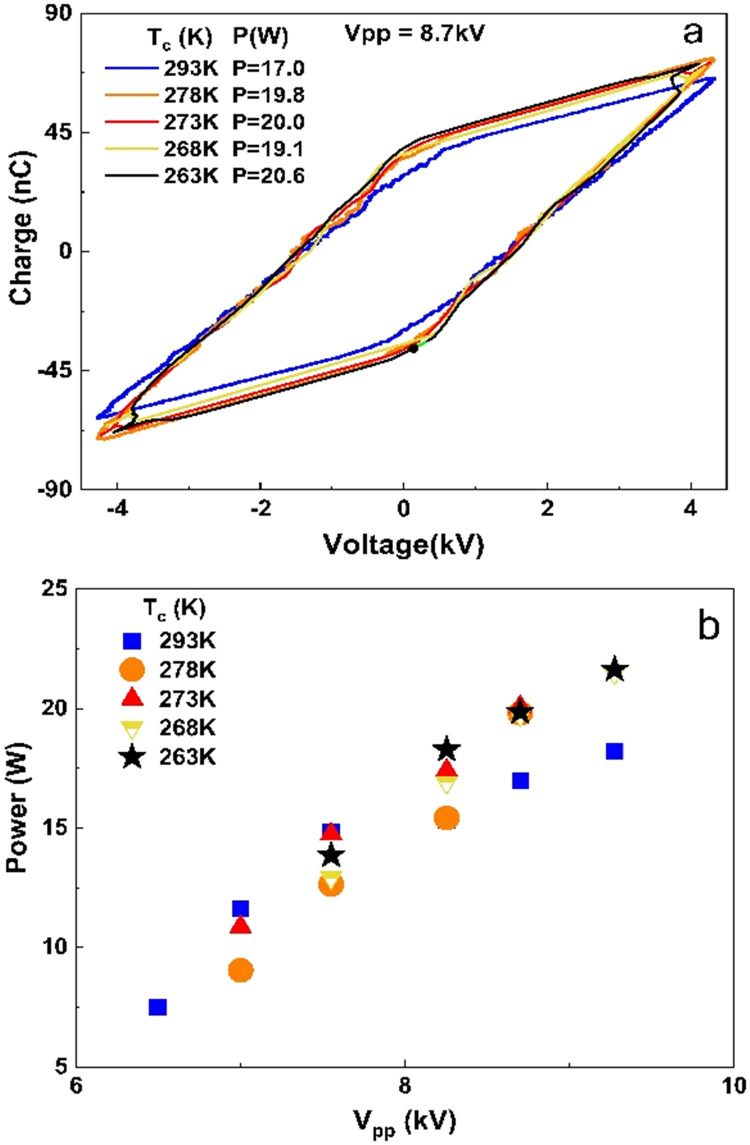
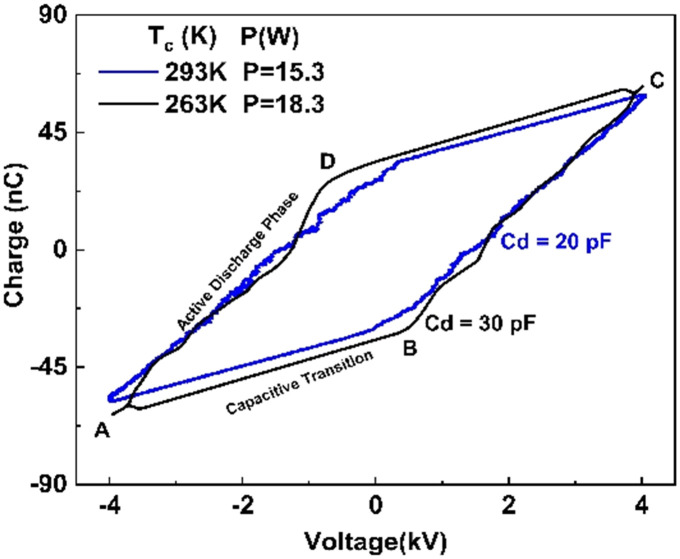
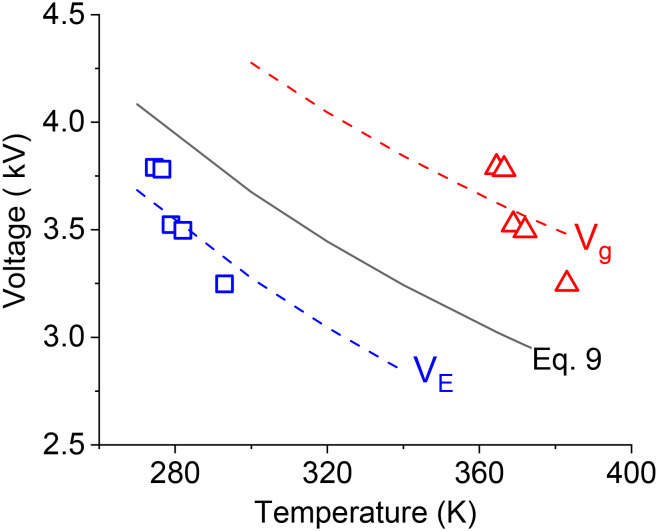
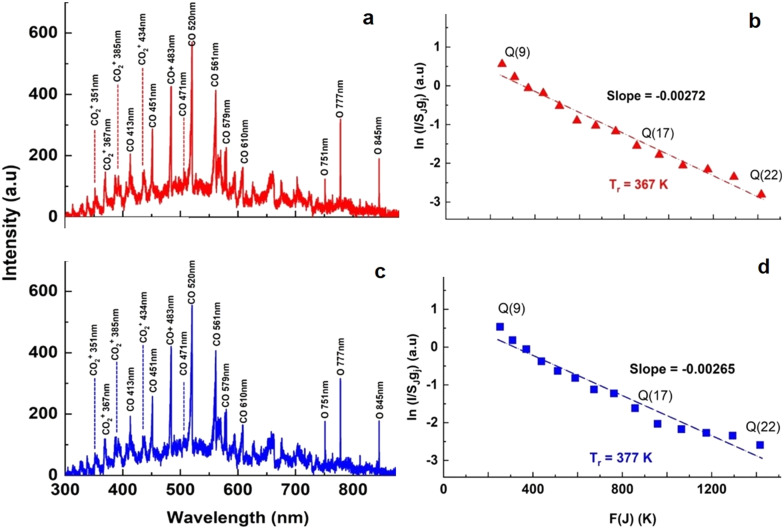
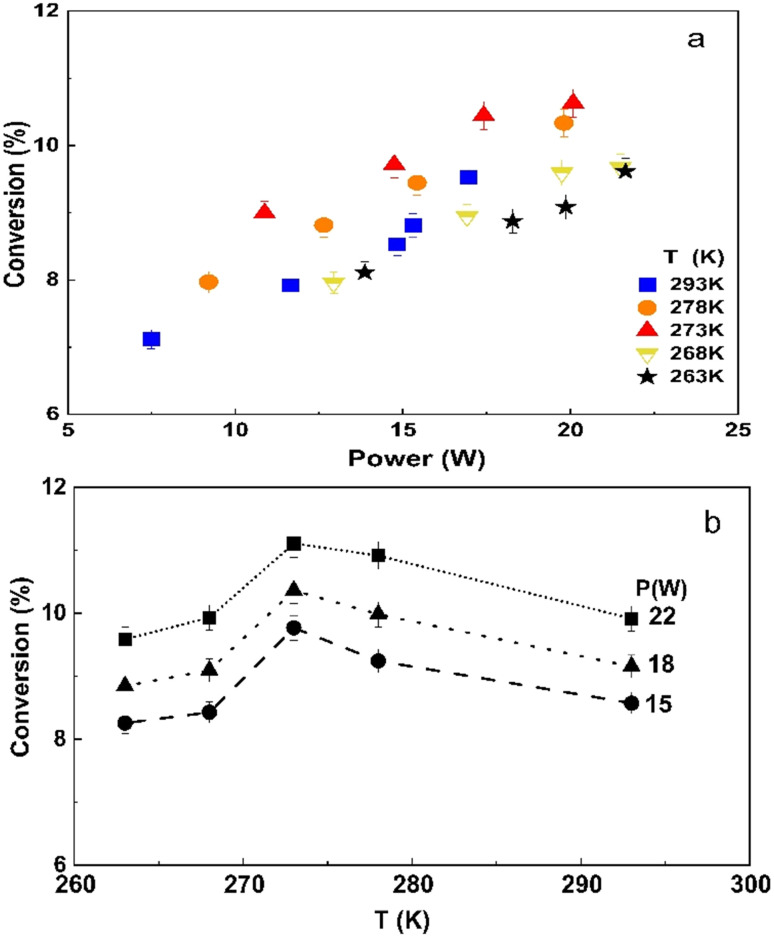
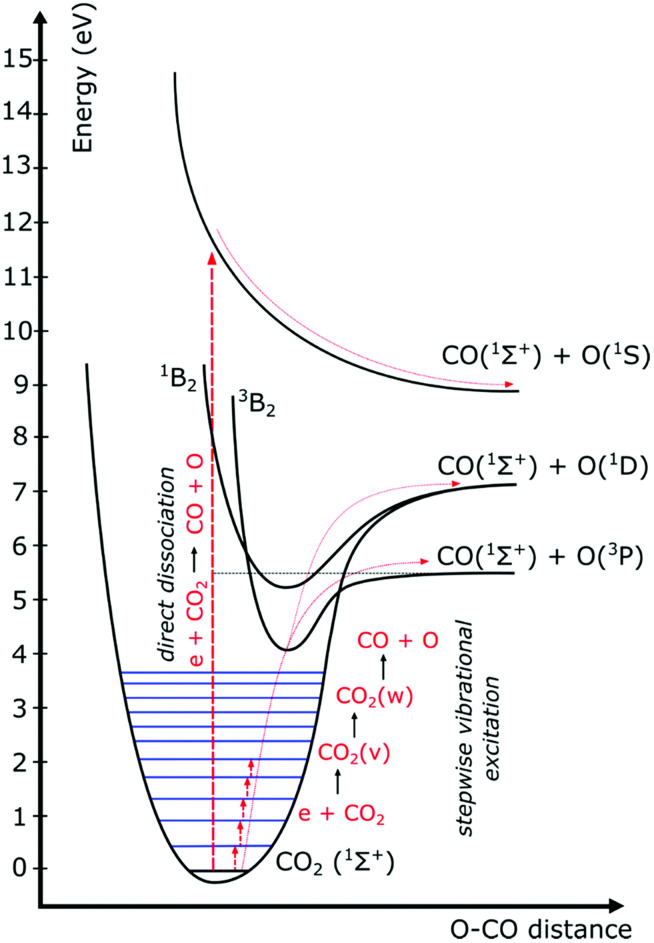
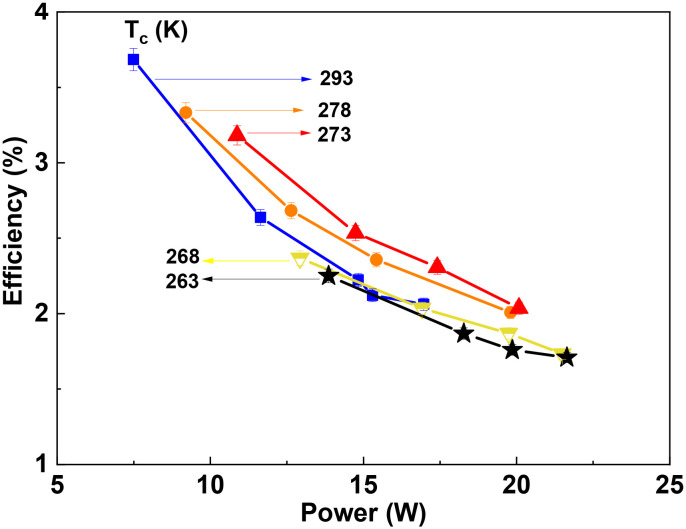
A novel plate-to-plate dielectric barrier discharge microreactor (micro DBD) has been demonstrated in CO2 splitting. In this design, the ground electrode has a cooling microchannel to maintain the electrode temperature in the 263-298 K range during plasma operation. A small gap size between the electrodes of 0.50 mm allowed efficient heat transfer from the surrounding plasma to the ground electrode surface to compensate for heat released in the reaction zone and maintain a constant temperature. The effect of temperature on CO2 conversion and energy efficiency was studied at a voltage of 6-9 kV, a frequency of 60 kHz and a constant CO2 flow rate of 20 ml min-1. The CO2 decomposition rate first increased and then decreased as the electrode temperature decreased from 298 to 263 K with a maximum rate observed at 273 K. Operation at lower temperatures enhanced the vibrational dissociation of the CO2 molecule as opposed to electronic excitation which is the main mechanism at room temperature in conventional DBD reactors, however it also reduced the rate of elementary reaction steps. The counterplay between these two effects leads to a maximum in the reaction rate. The power consumption monotonously increased as the temperature decreased. The effective capacitance of the reactor increased by 1.5 times at 263 K as compared to that at 298 K changing the electric field distribution inside the plasma zone.
This journal is © The Royal Society of Chemistry.
Conflict of interest statement
The authors declare that they have no known competing financial interests or personal relationships that could have appeared to influence the work reported in this paper. All sources of information have been appropriately acknowledged.
Figures
References
-
- Dębek R. Azzolina-Jury F. Travert A. Maugé F. A Review on Plasma-Catalytic Methanation of Carbon Dioxide – Looking for an Efficient Catalyst. Renewable Sustainable Energy Rev. 2019;116:109427. doi: 10.1016/j.rser.2019.109427. doi: 10.1016/j.rser.2019.109427. - DOI
-
- Xu S. Khalaf P. I. Martin P. A. Whitehead J. C. CO 2 Dissociation in a Packed-Bed Plasma Reactor: Effects of Operating Conditions. Plasma Sources Sci. Technol. 2018;27(7):075009. doi: 10.1088/1361-6595/aacd6a. doi: 10.1088/1361-6595/aacd6a. - DOI
-
- Sahara G. Kumagai H. Maeda K. Kaeffer N. Artero V. Higashi M. Abe R. Ishitani O. Photoelectrochemical Reduction of CO 2 Coupled to Water Oxidation Using a Photocathode with a Ru(II)–Re(I) Complex Photocatalyst and a CoO x /TaON Photoanode. J. Am. Chem. Soc. 2016;138(42):14152–14158. doi: 10.1021/jacs.6b09212. doi: 10.1021/jacs.6b09212. - DOI - PubMed
LinkOut - more resources
Full Text Sources
Miscellaneous