. 2023 Dec 21;89(12):e0095923.
doi: 10.1128/aem.00959-23. Epub 2023 Nov 28.

Introducing an environmental microbiome to axenic Aedes aegypti mosquitoes documents bacterial responses to a blood meal

Affiliations

Introducing an environmental microbiome to axenic Aedes aegypti mosquitoes documents bacterial responses to a blood meal

Jacquelyn C LaReau et al. Appl Environ Microbiol. .

Abstract

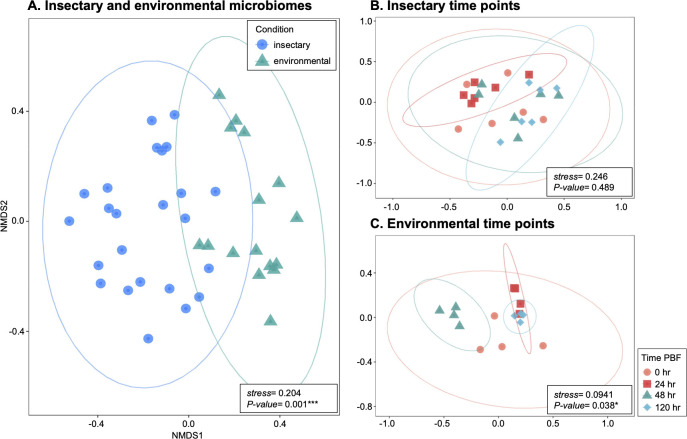
The blood meal of the female mosquito serves as a nutrition source to support egg development, so is an important aspect of its biology. Yet, the roles the microbiome may play in blood digestion are poorly characterized. We employed axenic mosquitoes to investigate how the microbiome differs between mosquitoes reared in the insectary versus mosquitoes that acquire their microbiome from the environment. Environmental microbiomes were more diverse and showed larger temporal shifts over the course of blood digestion. Importantly, only bacteria from the environmental microbiome performed hemolysis in culture, pointing to functional differences between bacterial populations. These data highlight that taxonomic differences between the microbiomes of insectary-reared and wild mosquitoes are potentially also related to their functional ecology. Thus, axenic mosquitoes colonized with environmental bacteria offer a way to investigate the role of bacteria from the wild in mosquito processes such as blood digestion, under controlled laboratory conditions.

Keywords: Aedes aegypti; blood meal; microbiome; mosquito.


Conflict of interest statement

The authors declare no conflict of interest.

Figures

Fig 1
Fig 1
Schematic diagram of mosquito rearing. The experimental setup consisted of rearing one group of mosquitoes under standard conditions, referred to as the insectary group. The second group consisted of colony mosquito eggs surface sterilized to produce axenic larvae. The axenic larvae were reared in an environmental water source for bacterial colonization. Mosquitoes were blood fed and female mosquitoes that took a blood meal were segregated. From each mosquito, midguts were extracted and subjected to culture-dependent and culture-independent microbial characterization. In this regard, all data presented are from individual mosquitoes assayed at different points over the course of blood meal digestion.
Fig 2
Fig 2
NMDS ordination. For each ordination, inter-sample distances were calculated with the Bray-Curtis metric. Ellipses denote the 95% confidence level for the distribution of each group. The stress value for each ordination is indicated along with the P-value from a multivariate analysis of variance test in the bottom inset panels. (A) All samples compared were grouped by microbiome status (insectary or environmental). (B) Time points within insectary midguts. (C) Time points within environmental midguts.
Fig 3
Fig 3
Taxonomic composition of 16S rRNA gene sequences. Families representing greater than 5% of total sequences are shown. Each bar represents an individual midgut. Phylum-level assignments of the predominant families are also indicated below the legend: Pseudomonadota shown in blue hues, Bacillota shown in red hues, and Bacteroidota shown in yellow. Families representing less than 5% of sequences are labeled as “other” in gray. Results of statistical comparisons of inter-group relative abundances are displayed in Fig. S1 to S3.
Fig 4
Fig 4
Functional profiling of predicted metagenomes. (A) Metacyc pathways, inferred from PICRUSt2 metagenomic prediction, displaying a significant difference in abundance. Only the 25 most significant pathways (lowest P-value) are displayed. The pathways are clustered based on the four super-classes to which they belong (colored bars on the right of the graph). The size of the bubbles is scaled by the number of KEGG ortholog gene copies per predicted genome, scaled by estimated genome copies based on 16S rRNA abundance data. (B) Estimated abundance of various hemolysins in the predicted metagenomes. Bars represent the average value among individually sampled mosquitoes along with the standard deviation of the mean (n = 6 for insectary and n = 4 for environmental). Note the different y-axis scales between panels.
Fig 5
Fig 5
Viable cell counts from blood-fed mosquitoes. For each mosquito, CFUs were determined by culturing on tryptic soy agar media. (A) Insectary mosquitoes. (B) Environment-colonized mosquitoes. Each point represents an individual mosquito. The mean is indicated by the black bar, with the mean value indicated by text. The asterisks indicate mosquitoes from which no viable bacteria were recovered, presumably due to over dilution during plating, particularly for the early (0 h) and late (120 h) sampling. No viable bacteria were recovered from the environmental-colonized mosquitoes at 48 h. Plating was performed with 103 to 105 dilutions, based on our results from the insectary mosquitoes. Thus, the upper limit for viable bacteria is ~1 × 10³ for these mosquitoes. Note the different y-axis scales between panels.
Fig 6
Fig 6
Rank abundance of genus-level bins in 16S rRNA sequence data sets represented by cultured isolates. Rank abundance curves displaying the abundance of genus-level bins in the 16S rRNA gene sequence data sets. For these data, the time point samples were compiled into a single data set for determining the abundance of the genera. Only the 25 most abundant genera are shown. Genera for which a cultured isolate was obtained from the respective microbiomes are indicated by orange highlights, and the OTU label from Table 2 is indicated. For several genera, multiple cultured OTUs were classified to the same genus.

References

    1. Kraemer MUG, Sinka ME, Duda KA, Mylne AQN, Shearer FM, Barker CM, Moore CG, Carvalho RG, Coelho GE, Van Bortel W, Hendrickx G, Schaffner F, Elyazar IRF, Teng H-J, Brady OJ, Messina JP, Pigott DM, Scott TW, Smith DL, Wint GRW, Golding N, Hay SI. 2015. The global distribution of the arbovirus vectors Aedes aegypti and Ae. albopictus. Elife 4:e08347. doi:10.7554/eLife.08347 - DOI - PMC - PubMed
    1. Wu P, Yu X, Wang P, Cheng G. 2019. Arbovirus lifecycle in mosquito: acquisition, propagation and transmission. Expert Rev Mol Med 21:e1. doi:10.1017/erm.2018.6 - DOI - PubMed
    1. Cansado-Utrilla C, Zhao SY, McCall PJ, Coon KL, Hughes GL. 2021. The microbiome and mosquito vectorial capacity: rich potential for discovery and translation. Microbiome 9:111. doi:10.1186/s40168-021-01073-2 - DOI - PMC - PubMed
    1. Shane JL, Grogan CL, Cwalina C, Lampe DJ. 2018. Blood meal-induced inhibition of vector-borne disease by transgenic microbiota. Nat Commun 9:4127. doi:10.1038/s41467-018-06580-9 - DOI - PMC - PubMed
    1. Gao H, Cui C, Wang L, Jacobs-Lorena M, Wang S. 2020. Mosquito microbiota and implications for disease control. Trends Parasitol 36:98–111. doi:10.1016/j.pt.2019.12.001 - DOI - PMC - PubMed

Publication types

LinkOut - more resources