. 2024 Jan 16;92(1):e0017923.
doi: 10.1128/iai.00179-23. Epub 2023 Nov 28.

Neisseria gonorrhoeae drives Chlamydia trachomatis into a persistence-like state during in vitro co-infection

Affiliations

Neisseria gonorrhoeae drives Chlamydia trachomatis into a persistence-like state during in vitro co-infection

Louise M Ball et al. Infect Immun. .

Abstract

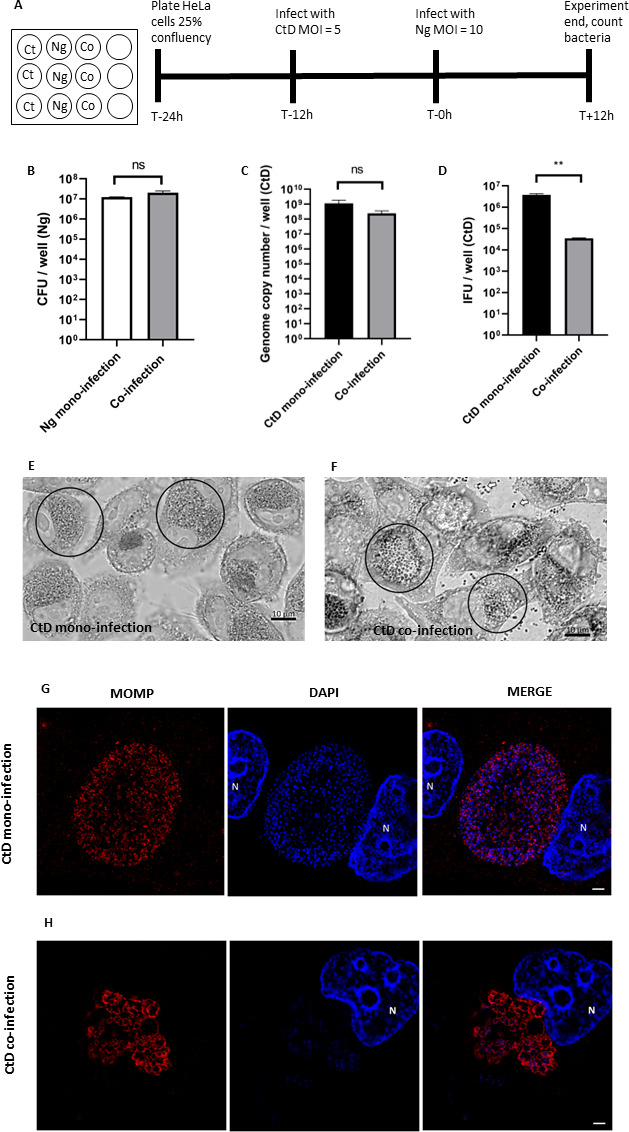
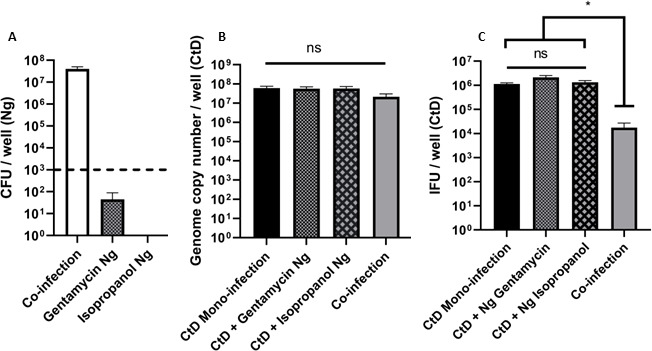
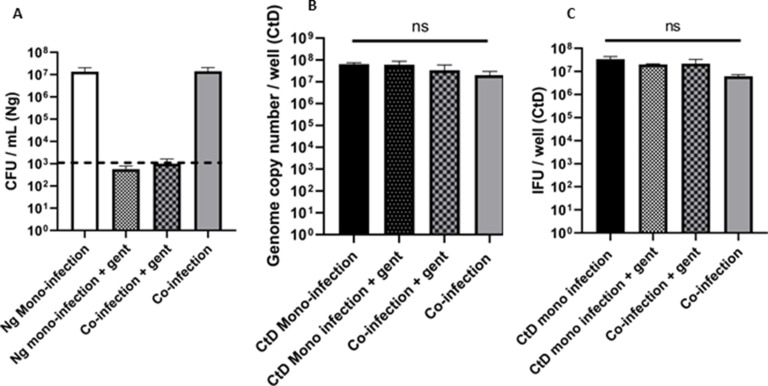
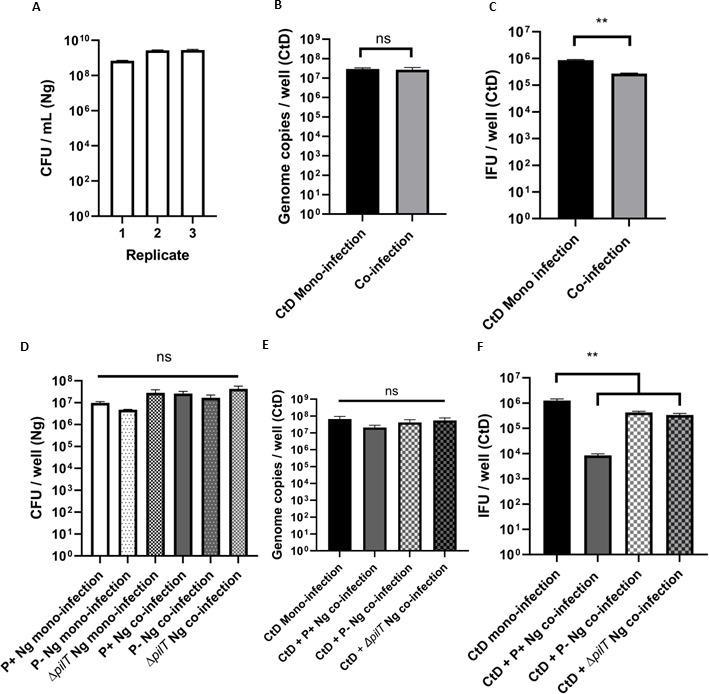
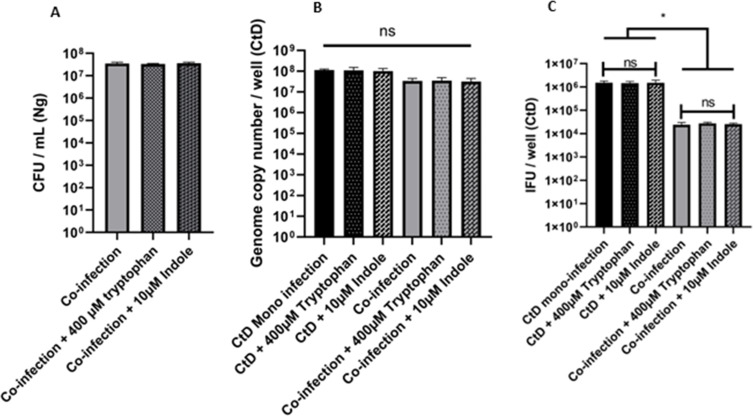
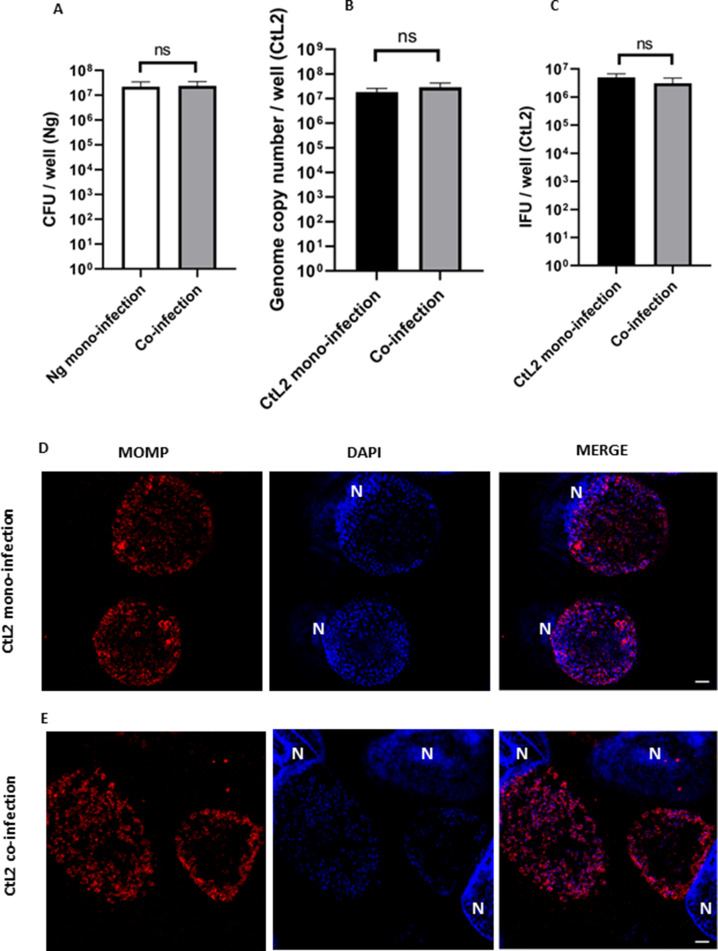
Chlamydia trachomatis and Neisseria gonorrhoeae are the most prevalent bacterial sexually transmitted infections (STIs) globally. Despite frequent co-infections in patients, few studies have investigated how mono-infections may differ from co-infections. We hypothesized that a symbiotic relationship between the pathogens could account for the high rates of clinical co-infection. During in vitro co-infection, we observed an unexpected phenotype where the C. trachomatis developmental cycle was impaired by N. gonorrhoeae. C. trachomatis is an obligate intracellular pathogen with a unique biphasic developmental cycle progressing from infectious elementary bodies (EB) to replicative reticulate bodies (RB), and back. After 12 hours of co-infection, we observed fewer EBs than in a mono-infection. Chlamydial genome copy number remained equivalent between mono- and co-infections. This is a hallmark of Chlamydial persistence. Chlamydial persistence alters inclusion morphology but varies depending on the stimulus/stress. We observed larger, but fewer, Chlamydia during co-infection. Tryptophan depletion can induce Chlamydial persistence, but tryptophan supplementation did not reverse the co-infection phenotype. Only viable and actively growing N. gonorrhoeae produced the inhibition phenotype in C. trachomatis. Piliated N. gonorrhoeae had the strongest effect on C. trachomatis, but hyperpiliated or non-piliated N. gonorrhoeae still produced the phenotype. EB development was modestly impaired when N. gonorrhoeae were grown in transwells above the infected monolayer. C. trachomatis serovar L2 was not impaired during co-infection. Chlamydial impairment could be due to cytoskeletal or osmotic stress caused by an as-yet-undefined mechanism. We conclude that N. gonorrhoeae induces a persistence-like state in C. trachomatis that is serovar dependent.

Keywords: Chlamydia trachomatis; Neisseria gonorrhoeae; in vitro co-infection; persistence; serovar specificity.


Conflict of interest statement

The authors declare no conflict of interest.

Figures

Fig 1
Fig 1
C. trachomatis EB titer is reduced after co-infection with N. gonorrhoeae. (A) Infections were carried out as described in Materials and Methods. (B) N. gonorrhoeae (Ng) CFU/mL after 12 hours of co-infection with or without C. trachomatis D. (C) Quantitative PCR measurement of genome copy number for all forms of C. trachomatis (CtD) (EBs, RBs, and ABs) after 24 hours of growth in HeLa cells including 12 hours of co-infection with or without N. gonorrhoeae. (D) Quantitative immunofluorescence analysis of C. trachomatis D (CtD) EB titer after 24 hours of growth in HeLa cells including 12 hours of co-infection with or without N. gonorrhoeae. Statistical analyses by Student’s t-test. Error bars are SEM. All experiments were performed in triplicate and repeated a total of three times. Differential interference contrast microscopy (DCIM) microscopy images of Giemsa stained (E) C. trachomatis mono-infection and (F) C. trachomatis–N. gonorrhoeae co-infection. Cells were fixed with 4% paraformaldehyde and stained with Giemsa stain then imaged at 1,000×. C. trachomatis inclusions are circled. In (F), N. gonorrhoeae cocci and diplococci can also be seen exterior to the cells (open arrows). Structured illumination microscopy (SIM) images of (G) C. trachomatis mono-infection and (H) C. trachomatis–N. gonorrhoeae co-infection. Chlamydial cells are larger after 12 hours of co-infection and aberrant bodies (ABs) are visible. Cells were fixed and permeabilized with methanol and 0.5% Triton X-100. Chlamydia appears red and DNA appears blue. Host cell nuclei are noted with “N.” White scale bars are 2 µm.
Fig 2
Fig 2
Dead or inactivated N. gonorrhoeae do not inhibit C. trachomatis EB titer during co-infection. (A) N. gonorrhoeae (Ng) CFU/mL after 12 hours of co-infection. The dotted line denotes the limit of detection for this experiment. (B) Quantitative PCR analysis of genome copy number for C. trachomatis (EBs, RBs, and ABs) after 24 hours of growth in HeLa cells including 12 hours of co-infection with treated or untreated N. gonorrhoeae. (C) Quantitative immunofluorescence analysis of C. trachomatis D (CtD) EB titer after 24 hours of growth in HeLa cells including 12 hours of co-infection with treated or untreated N. gonorrhoeae. (C). Statistical analysis for data (C) is by one-way ANOVA P = 0.0014, with Tukey’s repeated measures for the post hoc test, *P < .05. Error bars are SEM and each experiment was performed in triplicate, three or four times.
Fig 3
Fig 3
Removal of N. gonorrhoeae conditioned medium allows recovery of C. trachomatis EB titer. (A) N. gonorrhoeae (Ng) CFU/mL after 12 hours of co-infection and then 12 hours of ±gentamycin. The dotted line denotes the limit of detection for this experiment. (B) Quantitative PCR analysis of genome copy number for C. trachomatis D (EBs, RBs, and ABs) after 36 hours of growth in HeLa cells including 12 hours of co-infection ± N. gonorrhoeae and then 12 hours of ±gentamycin. (C) Quantitative immunofluorescence analysis of C. trachomatis D (CtD) EB titer after 36 hours of growth in HeLa cells including 12 hours of co-infection with or without N. gonorrhoeae and then 12 hours of ±gentamycin. Samples are not significantly different by one-way ANOVA or by Tukey’s modified post hoc test. Error bars are SEM. Experiments were performed three times in triplicate.
Fig 4
Fig 4
Aberrant Chlamydial phenotype is exacerbated by type 4 pili (T4P) but still observed during non-contact co-culture. HeLa cells were pre-infected with C. trachomatis D (CtD) and then challenged with N. gonorrhoeae (Ng) grown in the upper reservoir of 0.4 µm transwells for 12 hours. (A) N. gonorrhoeae grew to a stationary phase (108 CFU/mL) in all three biological replicates. (B) Genome copy number for C. trachomatis D remained equivalent between mono- and co-infected conditions. (C) Fewer IFU/well were produced during C. trachomatis–N. gonorrhoeae co-culture compared with a C. trachomatis mono-infection. Each experiment was performed in technical triplicate and three biological replicates were performed on separate days. IFU/well titers are significantly different by Student’s t-test, **P < .01. HeLa cells were pre-infected with C. trachomatis D (CtD) then challenged with piliated (P+), non-piliated (P-), or hyperpiliated (ΔpilT) N. gonorrhoeae (Ng) for 12 hours. (D) Co-infection did not significantly increase gonococcal attachment to monolayers for any of the piliated variants. (E) Chlamydial genome copy did not significantly change between mono-infection and any of the co-infection conditions. (F) Co-infections using non-piliated or hyperpiliated N. gonorrhoeae produced a decrease in Chlamydial EB titer. Error bars are the standard error of the mean (SEM) and ** represents P < 0.01 (Tukey’s multiple comparisons test). Results are significantly different by one-way ANOVA (P < 0.01).
Fig 5
Fig 5
Supplementation of co-infection with 10 μM indole or 400 μM tryptophan does not restore the elementary body (EB) titer to mono-infection levels. HeLa cells were pre-infected with C. trachomatis CtD and then challenged with N. gonorrhoeae (Ng) with or without tryptophan or indole for 12 hours of growth. (A) N. gonorrhoeae (Ng) CFU/mL after 12 hours of co-infection with C. trachomatis D ± tryptophan or indole. (B) Quantitative PCR measurement of genome copy number for all forms of C. trachomatis (CtD) (EBs, RBs, and ABs) after 24 hours of growth in HeLa cells including 12 hours of co-infection with or without N. gonorrhoeae ± tryptophan or indole. (C) Quantitative immunofluorescence analysis of C. trachomatis D (CtD) EB titer after 24 hours of growth in HeLa cells including 12 hours of co-infection with or without N. gonorrhoeae ± tryptophan or indole. Each experiment was performed with three technical replicates and each experiment was performed three times. Error bars are the standard error of the mean (SEM) and * represents P < 0.05 (Tukey’s multiple comparisons test). Results are significantly different by one-way ANOVA (P < 0.01).
Fig 6
Fig 6
C. trachomatis serovar L2 is resistant to the EB titer reduction during co-infection with N. gonorrhoeae. C. trachomatis (CtL2) pre-infected HeLa cells were challenged with live N. gonorrhoeae (Ng) for 12 hours of growth. (A) N. gonorrhoeae (Ng) CFU/mL after 12 hours of co-infection with or without C. trachomatis L2. (B) Quantitative PCR measurement of genome copy number for all forms of C. trachomatis (CtL2) (EBs, RBs, and ABs) after 24 hours of growth in HeLa cells including 12 hours of co-infection with or without N. gonorrhoeae. (C) Quantitative immunofluorescence analysis of C. trachomatis L2 (CtL2) EB titer after 24 hours of growth in HeLa cells including 12 hours of co-infection with or without N. gonorrhoeae. Statistical analyses by Student’s t-test. Error bars are SEM. All experiments were performed in triplicate and repeated a total of three times. There is no significant difference between the mono- and co-infections when measured by Student’s t-test. Super illumination microscopy (SIM) fluorescence microscopy representative images of (D) CtL2 mono-infection and (E) CtL2 - N. gonorrhoeae co-infection. Chlamydial cells are the same size as mono-infected cells after 12 hours of co-infection. Cells were fixed and permeabilized with methanol and 0.5% Triton X-100. Chlamydia appears red and DNA appears blue. Host cell nuclei are noted with “N.” White scale bars are 2 µm.

References

    1. HHS CDC, NCSSHTP . 2019. CDC FACT SHEET: reported STDs in the United States. Available from: www.cdc.gov/nchhstp/newsroom
    1. WHO . https://www.who.int/health-topics/sexually-transmitted-infection. (2016).
    1. Wiesenfeld HC, Sweet RL, Ness RB, Krohn MA, Amortegui AJ, Hillier SL. 2005. Comparison of acute and subclinical pelvic inflammatory disease. Sex Transm Dis 32:400–405. doi:10.1097/01.olq.0000154508.26532.6a - DOI - PubMed
    1. Holmes KK, Counts GW, Beaty HN. 1971. Disseminated gonococcal infection. Ann Intern Med 74:979–993. doi:10.7326/0003-4819-74-6-979 - DOI - PubMed
    1. Richardson D, Goldmeier D. 2007. Lymphogranuloma venereum: an emerging cause of proctitis in men who have sex with men. Int J STD AIDS 18:11–14; doi:10.1258/095646207779949916 - DOI - PubMed

Publication types