. 2023 Nov 22;7(12):e0306.
doi: 10.1097/HC9.0000000000000306. eCollection 2023 Dec 1.

Altered profiles of circulating cytokines in chronic liver diseases (NAFLD/HCC): Impact of the PNPLA3I148M risk allele

Affiliations

Altered profiles of circulating cytokines in chronic liver diseases (NAFLD/HCC): Impact of the PNPLA3I148M risk allele

Mélanie Kirchmeyer et al. Hepatol Commun. .

Abstract

Background: Individuals carrying the risk variant p.I148M of patatin-like phospholipase domain-containing protein 3 (PNPLA3) have a higher susceptibility to fatty liver diseases and associated complications, including HCC, a cancer closely linked to chronic inflammation. Here, we assessed circulating cytokine profiles for patients with chronic liver diseases genotyped for PNPLA3.

Methods: Serum concentrations of 22 cytokines were measured by multiplex sandwich-ELISA. The cohort comprised 123 individuals: 67 patients with NAFLD without cirrhosis (57 steatosis, 10 NASH), 24 patients with NAFLD with cirrhosis, 21 patients with HCC (15 cirrhosis), and 11 healthy controls. Receiver operator characteristic analyses were performed to assess the suitability of the cytokine profiles for the prediction of steatosis, cirrhosis, and HCC.

Results: HGF, IL-6, and IL-8 levels were increased in patients, with ∼2-fold higher levels in patients with cirrhosis versus healthy, while platelet derived growth factor-BB (PDGF-BB) and regulated on activation, normal T cell expressed and secreted (RANTES) showed lower concentrations compared to controls. Migration inhibitory factor and monocyte chemoattractant protein-1 (MCP-1) were found at higher levels in NAFLD samples (maximum: NAFLD-cirrhosis) versus healthy controls and HCC samples. In receiver operator characteristic analyses, migration inhibitory factor, IL-8, IL-6, and monocyte chemoattractant protein-1 yielded high sensitivity scores for predicting noncirrhotic NAFLD (vs. healthy). The top combination to predict cirrhosis was HGF plus PDGF-BB. Migration inhibitory factor performed best to discriminate HCC from NAFLD; the addition of monokine induced gamma (MIG), RANTES, IL-4, macrophage colony-stimulating factor (M-CSF), or IL-17A as second parameters further increased the AUC values (> 0.9). No significant impact of the PNPLA3I148M allele on cytokine levels was observed in this cohort.

Conclusions: Cytokines have biomarker potential in patients with fatty liver, possibly suited for early HCC detection in patients with fatty liver. Patients carrying the PNPLA3 risk allele did not present significantly different levels of circulating cytokines.


Conflict of interest statement

The authors have no conflicts to report.

Figures

None
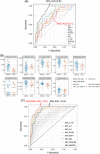
Graphical abstract
FIGURE 1
FIGURE 1
Profiles of selected serum cytokines in patients with chronic liver diseases. Values used for the graphical representation were log-transformed. The horizontal line within the box plot represents the median, and vertical lines from the boxes (whiskers) indicate the variability outside the upper and lower quartiles. Empty circles represent values “out of range” (see supplements for further information). Statistical analysis was done on non-logged data; Kruskal-Wallis H and post hoc Dunn’s multiple comparison tests were performed. p values of pairwise comparisons were adjusted for each cytokine using the Holm method. ****p < 0.0001, ***p < 0.001, **p < 0.01, *p < 0.05. Abbreviations: MCP-1, monocyte chemoattractant protein-1; MIF, macrophage migration inhibitory factor.
FIGURE 2
FIGURE 2
ROC curve analysis for prediction of noncirrhotic NAFLD versus healthy cases. (A): ROC curves for the 4 cytokines with p. adj. < 0.05: MIF, IL-8, IL-6, MCP-1. (B): Concentration plots for MIF, IL-8, IL-6, and MCP-1 for the healthy group (11 samples) and the noncirrhotic NAFLD group (57 NAFLD-NC-Stea + 10 NAFLD-NC-NASH samples). Abbreviations: MCP-1, monocyte chemoattractant protein-1; MIF, macrophage migration inhibitory factor.
FIGURE 3
FIGURE 3
ROC curve analysis for prediction of cirrhosis or “complication” within the NAFLD group. (A): ROC curves for the 10 cytokine pairs discriminating best between cirrhosis and noncirrhosis are highlighted in colors. (B): Concentration plots for the top 6 cytokines (see Supplemental Figure S4A, http://links.lww.com/HC9/A632), the noncirrhotic group comprising 67 samples (NAFLD-NC-Stea as well as NAFLD-NC-NASH), the cirrhotic group comprising 2 samples. (C): ROC curves for the 10 cytokine pairs discriminating best between “complicated” (NAFLD-NC-NASH, NAFLD-Cirr, and NAFLD-related HCC, 35 samples) and “uncomplicated” (NAFLD-NC-Stea, 57 samples) are highlighted in colors. (D): Concentration plots for the top 5 cytokines (see Supplemental Figure S4C, http://links.lww.com/HC9/A632).
FIGURE 4
FIGURE 4
ROC curve analysis for prediction of HCC versus non-HCC among patients with chronic liver diseases. (A): ROC curves for 11 cytokines, allowing best to distinguish HCC versus non-HCC. (B): Concentration plots for cytokines with an adjusted p-value > 0.05 are shown for the non-HCC group (91 NAFLD samples) and the HCC group (21 samples) (C): Cytokine pairs are depicted by colored lines if their AUC is higher than the AUC of MIF alone. Abbreviations: MCP-1, monocyte chemoattractant protein-1; MIF, migration inhibitory factor.
FIGURE 5
FIGURE 5
The PNPLA3 c.444C > G, rs738409 risk allele overrepresented in patients with HCC does not strongly affect levels of circulating cytokine but slightly improves HCC prediction models based on single cytokines. (A): Graphical representation of the patient cohort, indicating numbers of patients in the different disease groups and of healthy controls as well as their PNPLA3 allele states [(CC), (CG), (GG), the G allele encoding the PNPLA3.I148M variant]. (B): No statistical difference regarding the concentrations of circulating cytokines was detected for the different allele states, as shown here for IL-6, IL-8, and HGF. (C): For the 11 cytokines yielding adj. p values < 0.05 for HCC prediction versus non-HCC (see Figure 4A), ROC curves with the PNPLA3 allele status as the second parameter are shown. The AUC values are indicated when they increased by ≥ 0.06 upon inclusion of the PNPLA3 genotype. Abbreviations: PNPLA3, patatin-like phospholipase domain-containing protein 3.

References

    1. Llovet JM, Kelley RK, Villanueva A, Singal AG, Pikarsky E, Roayaie S, et al. Hepatocellular carcinoma. Nat Rev Dis Primers. 2021;7:6. - PubMed
    1. Riazi K, Azhari H, Charette JH, Underwood FE, King JA, Afshar EE, et al. The prevalence and incidence of NAFLD worldwide: A systematic review and meta-analysis. Lancet Gastroenterol Hepatol. 2022;7:851–861. - PubMed
    1. Govaere O, Hasoon M, Alexander L, Cockell S, Tiniakos D, Ekstedt M, et al. A proteo-transcriptomic map of non-alcoholic fatty liver disease signatures. Nat Metab. 2023;5:572–578. - PMC - PubMed
    1. Krawczyk M, Liebe R, Lammert F. Toward Genetic Prediction of Nonalcoholic Fatty Liver Disease Trajectories: PNPLA3 and Beyond. Gastroenterology. 2020;158:1865–1880.e1861. - PubMed
    1. Cherubini A, Casirati E, Tomasi M, Valenti L. PNPLA3 as a therapeutic target for fatty liver disease: The evidence to date. Expert Opin Ther Targets. 2021;25:1033–1043. - PubMed

Publication types