. 2024 Feb 1;134(3):e172573.
doi: 10.1172/JCI172573.

Disease-associated AIOLOS variants lead to immune deficiency/dysregulation by haploinsufficiency and redefine AIOLOS functional domains

Affiliations

Disease-associated AIOLOS variants lead to immune deficiency/dysregulation by haploinsufficiency and redefine AIOLOS functional domains

Hye Sun Kuehn et al. J Clin Invest. .

Abstract

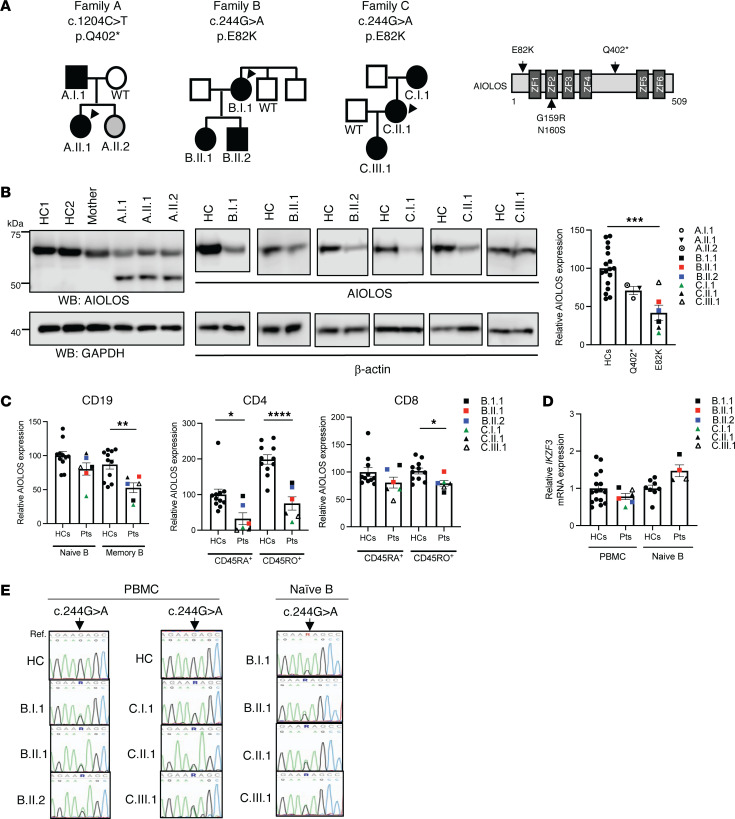
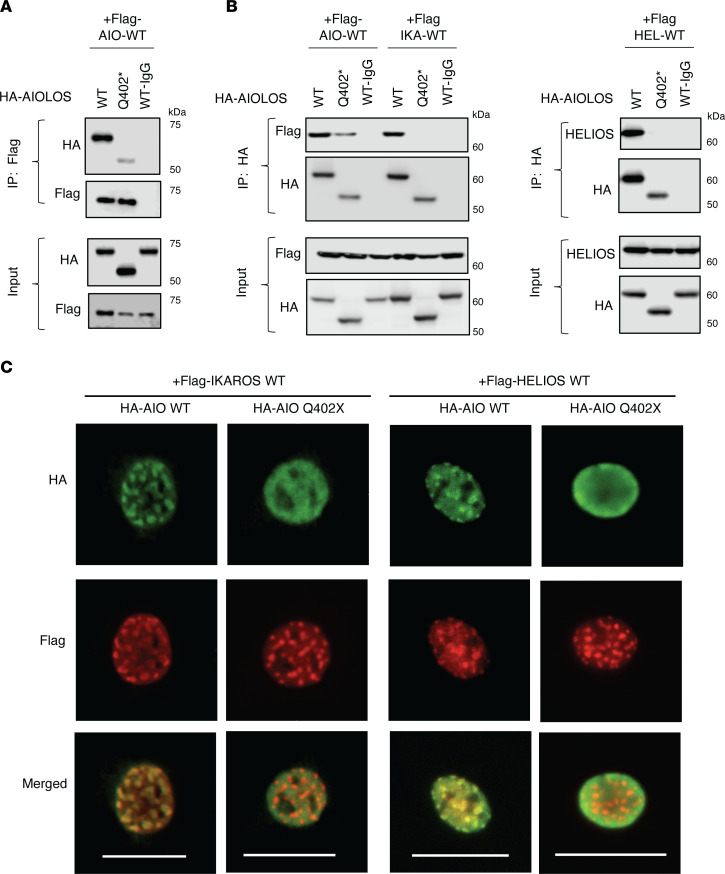
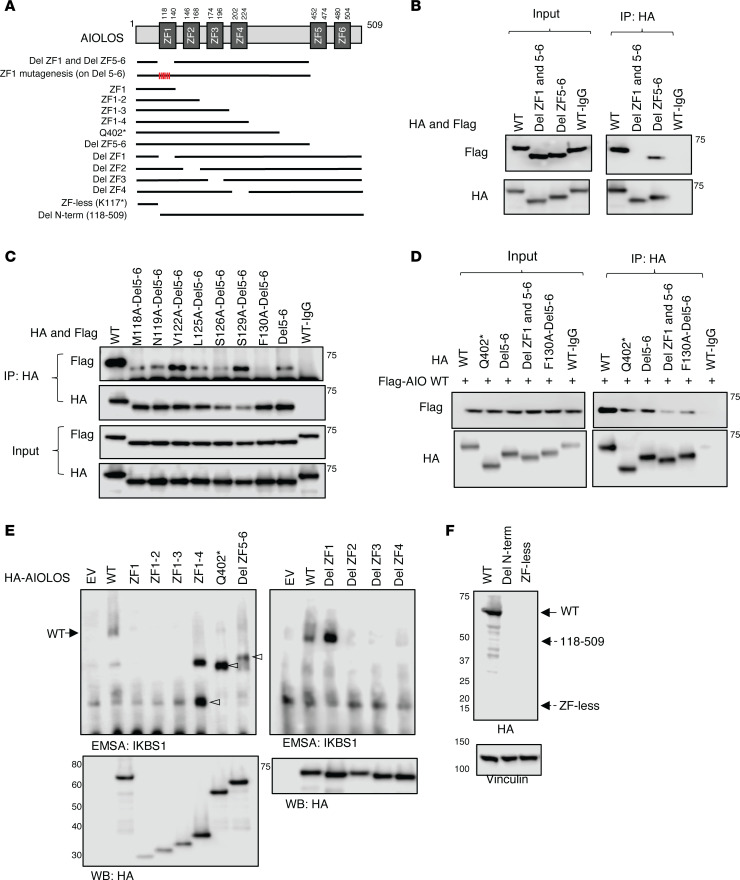
AIOLOS, also known as IKZF3, is a transcription factor that is highly expressed in the lymphoid lineage and is critical for lymphocyte differentiation and development. Here, we report on 9 individuals from 3 unrelated families carrying AIOLOS variants Q402* or E82K, which led to AIOLOS haploinsufficiency through different mechanisms of action. Nonsense mutant Q402* displayed abnormal DNA binding, pericentromeric targeting, posttranscriptional modification, and transcriptome regulation. Structurally, the mutant lacked the AIOLOS zinc finger (ZF) 5-6 dimerization domain, but was still able to homodimerize with WT AIOLOS and negatively regulate DNA binding through ZF1, a previously unrecognized function for this domain. Missense mutant E82K showed overall normal AIOLOS functions; however, by affecting a redefined AIOLOS protein stability domain, it also led to haploinsufficiency. Patients with AIOLOS haploinsufficiency showed hypogammaglobulinemia, recurrent infections, autoimmunity, and allergy, but with incomplete clinical penetrance. Altogether, these data redefine the AIOLOS structure-function relationship and expand the spectrum of AIOLOS-associated diseases.

Keywords: Adaptive immunity; Immunology; Molecular genetics; Monogenic diseases.


Conflict of interest statement

Conflict of interest: The authors have declared that no conflict of interest exists.

Figures

Figure 1
Figure 1. AIOLOS protein and gene expression levels in the patients with heterozygous IKZF3 variants.
(A) The pedigrees of the patients with heterozygous IKZF3 variants (NM_012481). Black and gray colors indicate symptomatic and asymptomatic mutation carriers, respectively. Schematic representation of AIOLOS mutations and ZF domains. Previously reported AIOLOS variants are indicated below the protein. (B) AIOLOS protein expression in total PBMCs from the mutation carriers and healthy controls (HC, the age of people in the HC group used in the assay ranges from 29–77). For C.III.1, age matched controls were used. GAPDH or β-actin was used as a loading control. Representative images from 2 experiments are shown. Densitometry analysis of AIOLOS proteins (approximately 60 kDa) normalized by the loading controls. The average value for HCs was set at 100. (C) AIOLOS expression was analyzed by flow cytometry in naive and memory subsets from T cells (CD45RA+RO versus CD45RARO+, respectively) or B cells (IgD+CD27 versus IgDCD27+, respectively). (D) The IKZF3 mRNA levels in PBMCs or naive B cells from healthy controls and indicated patients with the E82K mutation. Relative gene expression levels from PBMCs and naive B cells are shown. Dots represent the average values of technical replicates per sample. (E) The chromatograms show the sequence of the heterozygous mutation in cDNA prepared from PBMCs or naive B cells. Data present means ± SEM. Significance was determined by 2-tailed Student’s t test, * P < 0.05; ** P < 0.01, *** P < 0.001; **** P < 0.0001.
Figure 2
Figure 2. Functional tests for the mutant AIOLOS protein.
(A) NIH3T3 cells were transfected with HA-tagged WT or the mutant expression vector alone or together with Flag-tagged WT AIOLOS. Cells were labeled with indicated antibodies, followed by Alexa Fluor 488–conjugated and/or Alexa Fluor 568–conjugated secondary antibodies. Cells were visualized using an EVOS (40× objective) fluorescent microscope. Scale bars: 25 μm. (B) HEK293T cells were transfected with HA-tagged AIOLOS WT and/or the indicated mutant. Nuclear extracts were prepared and used for the immunoblotting and EMSA assay. Data shown are representative of 3 independent experiments.
Figure 3
Figure 3. The effect of AIOLOS Q402* on homo- and heterodimerization with IKAROS family members.
(A) HEK293T cells were transfected with HA-tagged AIOLOS WT or the mutant (Q402*) together with Flag-tagged AIOLOS WT. Immunoprecipitations were performed as indicated in the figure using an anti-rabbit Flag antibody or anti-rabbit IgG control antibody. Western blot data of the IP samples with anti-HA and anti-Flag antibodies are shown. Input controls indicate 5% of the total volumes of the whole cellular lysates used for the IP reaction. (B) HEK293T cells were transfected with HA-tagged AIOLOS WT or the mutant together with Flag-tagged AIOLOS WT, IKAROS WT (left panel), or HELIOS WT (right panel). Cell lysates were subjected to immunoprecipitations using anti-rabbit HA antibody or anti-rabbit IgG control. Western blot data of the IP samples with indicated antibodies are shown. (C) NIH3T3 cells were transfected with HA-tagged AIOLOS WT or the mutant together with Flag-tagged IKAROS WT (left panel) or HELIOS WT (right panel). Cells were labeled with anti-mouse HA and anti-rabbit Flag antibodies, followed by Alexa Fluor 488-conjugated and/or Alexa Fluor 568-conjugated secondary antibodies, respectively. Cells were visualized using an EVOS (40× objective) fluorescent microscope. Scale bars: 25 μm. Data (AC) shown are representative of 3 independent experiments.
Figure 4
Figure 4. The effect of AIOLOS mutants on homo- or heterodimerization.
(A) A schematic diagram of AIOLOS mutants is depicted. (BE) HEK293T cells were transfected with HA-tagged AIOLOS WT or the indicated mutants together with indicated Flag-tagged IKAROS family members or the AIOLOS mutants. Immunoprecipitations were performed using an anti-rabbit HA antibody or anti-rabbit IgG control antibody. Western blot data of the IP samples with anti-HA and anti-Flag antibodies are shown (please see Supplemental Figure 2, A–D for input controls). Data shown are representative of 3 independent experiments.
Figure 5
Figure 5. The effect of AIOLOS mutants on the pericentromeric targeting and DNA binding.
(A) A schematic diagram of AIOLOS mutants is depicted. (BD) HEK293T cells were transfected with indicated HA-tagged AIOLOS WT or the indicated mutants together with Flag-tagged AIOLOS WT or the mutants. Immunoprecipitations were performed using an anti-rabbit HA antibody or anti-rabbit IgG control antibody. Western blot data of the IP samples with anti-HA and anti-Flag antibodies are shown. (E) HEK293T cells were transfected with HA-tagged AIOLOS WT or the mutants. Nuclear extracts were prepared, and an equal volume of nuclear extracts from each sample was used for the EMSA assay and the protein expression test. (F) HEK293T cells were transfected with HA-tagged AIOLOS WT or mutants, and protein expression was tested after 20 to 24 hours transfection. Dotted arrows indicate the expected mutants’ protein size. Vinculin was used as a loading control. Molecular weight markers are shown on the left (kDa). Representative images from 3 independent experiments are shown (BF).
Figure 6
Figure 6. The impact of AIOLOS mutants on protein stability and posttranslational modification.
(A) HEK293T cells were transfected with indicated vectors. The following day, cells were treated with cycloheximide (CHX, 10 μg/mL) in the presence and absence of epoxomicin (100 nM) or bortezomib (50 nM) for 8 hours. Representative images from 3 to 4 independent experiments are shown. The AIOLOS expression was normalized by the loading control, and the relative AIOLOS protein stability was calculated by dividing the CHX-treated sample by the untreated sample (× 100) for each group. Data indicate mean ± SEM. (B) HEK293T cells were cotransfected with HA-AIOLOS and Flag-Ubiquitin. After 48 hours of incubation, cells were treated with Epoxomicin (100 nM) for 3 hours. The protein lysates were prepared and immunoprecipitated under nondenaturing conditions with an anti-rabbit HA antibody. Immunoblot was performed using an anti-ubiquitin antibody or an anti-HA antibody. (C and D) HEK293T cells were transfected with HA or Flag-tagged AIOLOS WT or the indicated mutant together with GFP-SUMO1/2 or with HA-HDAC1. 24–48 hours after transfection, protein lysates were prepared and subjected to immunoprecipitations. Western blot data of the IP samples with indicated antibodies are shown. Representative images from 3 independent experiments are shown. The arrow indicates the heavy chain of the anti-HA antibody (BD).
Figure 7
Figure 7. RNA-Seq and ATAC-Seq analyses.
(A) RNA-Seq was performed on T cell blasts (Q402*) or EBV-transformed B cell lines (E82K). Kendall correlation analyses of the count matrices are shown. The scale bar represents the range of the correlation coefficients (r). (B) Heatmap of variance stabilized counts for genes that were determined to be differentially expressed by both the DeSeq2 and CogentDS pipelines. Blue indicates genes with lower expression values and red represents highly expressed genes. (C) GO dotplots for selected biological process (BP) that are immune related and shared between T cell blasts (Q402*) and EBV-transformed B-cells (E82K) based on DEGs. DEGs have an adjusted P value under 0.01 and absolute log2 fold change of greater than 2. The color of the dots indicates the P values for each of the terms and the size of the dots depicts the gene ratio. The gene ratio equals the number of differentially expressed genes against the number of genes associated with a GO term in the genome. The P value scales indicated in the figure correspond to transformed P values across the selected categories. (D) IPA Diseases & Functions analysis from the patients with the indicated AIOLOS mutations. (E and F) Analysis of chromatin accessibility by ATAC-Seq in T cell blasts from healthy controls and the patients with AIOLOS mutations. Principal Component Analysis plot was generated using DeSeq2 (E). Correlation heatmap of all chromatin peaks detected by ATAC-Seq was generated by DiffBind (F).

References

    1. Fan Y, Lu D. The Ikaros family of zinc-finger proteins. Acta Pharm Sin B. 2016;6(6):513–521. doi: 10.1016/j.apsb.2016.06.002. - DOI - PMC - PubMed
    1. Heizmann B, et al. The Ikaros family in lymphocyte development. Curr Opin Immunol. 2018;51:14–23. doi: 10.1016/j.coi.2017.11.005. - DOI - PubMed
    1. Holmfeldt L, et al. The genomic landscape of hypodiploid acute lymphoblastic leukemia. Nat Genet. 2013;45(3):242–252. doi: 10.1038/ng.2532. - DOI - PMC - PubMed
    1. Tabayashi T, et al. Characterization of the short isoform of Helios overexpressed in patients with T-cell malignancies. Cancer Sci. 2007;98(2):182–188. doi: 10.1111/j.1349-7006.2006.00372.x. - DOI - PMC - PubMed
    1. Asanuma S, et al. Adult T-cell leukemia cells are characterized by abnormalities of Helios expression that promote T cell growth. Cancer Sci. 2013;104(8):1097–1106. doi: 10.1111/cas.12181. - DOI - PMC - PubMed