. 2023 Nov 28;134(3):e164199.
doi: 10.1172/JCI164199.

TIMP2 ameliorates blood-brain barrier disruption in traumatic brain injury by inhibiting Src-dependent VE-cadherin internalization

TIMP2 ameliorates blood-brain barrier disruption in traumatic brain injury by inhibiting Src-dependent VE-cadherin internalization

Jingshu Tang et al. J Clin Invest. .

Abstract

Blood-brain barrier (BBB) disruption is a serious pathological consequence of traumatic brain injury (TBI), for which there are limited therapeutic strategies. Tissue inhibitor of metalloproteinase-2 (TIMP2), a molecule with dual functions of inhibiting MMP activity and displaying cytokine-like activity through receptor binding, has been reported to inhibit VEGF-induced vascular hyperpermeability. Here, we investigate the ability of TIMP2 to ameliorate BBB disruption in TBI and the underlying molecular mechanisms. Both TIMP2 and AlaTIMP2, a TIMP2 mutant without MMP-inhibiting activity, attenuated neurological deficits and BBB leakage in TBI mice; they also inhibited junctional protein degradation and translocation to reduce paracellular permeability in human brain microvascular endothelial cells (ECs) exposed to hypoxic plus inflammatory insult. Mechanistic studies revealed that TIMP2 interacted with α3β1 integrin on ECs, inhibiting Src activation-dependent VE-cadherin phosphorylation, VE-cadherin/catenin complex destabilization, and subsequent VE-cadherin internalization. Notably, localization of VE-cadherin on the membrane was critical for TIMP2-mediated EC barrier integrity. Furthermore, TIMP2-mediated increased membrane localization of VE-cadherin enhanced the level of active Rac1, thereby inhibiting stress fiber formation. All together, our studies have identified an MMP-independent mechanism by which TIMP2 regulates EC barrier integrity after TBI. TIMP2 may be a therapeutic agent for TBI and other neurological disorders involving BBB breakdown.

Keywords: Molecular biology; Neurodegeneration; Neuroscience; Vascular Biology.


Conflict of interest statement

Conflict of interest: The authors have declared that no conflict of interest exists.

Figures

Figure 1
Figure 1. TIMP2 ameliorates neurological dysfunction and alleviates Evans blue extravasation in TBI.
(A) Experimental scheme for TBI establishment, rmTIMP2 administration, neurological behavior assessment, and BBB integrity analysis in mice. WDI, weight drop injury. (BD) TBI mice were intravenously given rmTIMP2 (10, 30, and 100 μg/kg) or PBS for 3 consecutive days, and neurological function was assessed at 24, 48, and 72 hours after TBI (n = 7 per group). (B) Fall latency of accelerated rotarod of mice from the indicated treatment groups. (C) Beam balance scores for mice from the indicated treatment groups. (D) mNSS of mice from the indicated treatment groups. (E) Representative images of brain tissues from the indicated treatment groups at 72 hours after TBI. The blue area indicates extravasation of Evans blue dye. (F) Quantification of leaked Evans blue dye in the ipsilateral cerebral hemisphere of mice from the indicated groups (n = 7 per group). ##P < 0.01 vs. sham group, *P < 0.05 and **P < 0.01 vs. model group, by 1-way ANOVA.
Figure 2
Figure 2. TIMP2 attenuates EC barrier leakage and JP disruption induced by hypoxia plus IL-1β insult.
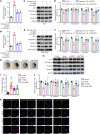
(AD) Cells were treated with rhTIMP2, rmTIMP2, or PBS, and then subjected to hypoxia plus IL-1β insult for 24 hours. Paracellular permeability was determined by measurement of the concentration of 70 kDa FITC-dextran leaking from the luminal to abluminal. (A) Illustration of the in vitro BBB model composed of an HBMEC monolayer seeded on top of a cell culture insert. (B) Illustration of the in vitro 3D BBB model composed of primary cells, including BMECs seeded on the apical side, pericytes seeded on the underside of the insert, and astrocytes seeded on the plate bottom. (C) The effects of the rhTIMP2 dose range on the paracellular permeability of HBMECs. (D) The effects of the rmTIMP2 dose range on the paracellular permeability of primary BMECs. (EH) HBMECs treated with rhTIMP2 or PBS were subjected to hypoxia plus IL-1β insult for 24 hours. Western blot analysis (E) and quantification (F) of the indicated proteins in whole-cell extracts. Western blot analysis (G) and quantification (H) of the indicated proteins in the membrane fraction. Data represent 3 independent experiments. ##P < 0.01 vs. control group, *P < 0.05 and **P < 0.01 vs. hypoxia plus IL-1β group, by 1-way ANOVA.
Figure 3
Figure 3. TIMP2 regulates the EC barrier and JP expression in TBI in an MMP-independent manner.
(AF) Cultured cells treated with rhTIMP2, rhAlaTIMP2, rmTIMP2, rmAlaTIMP2, or PBS were subjected to hypoxia plus IL-1β injury for 24 hours. Transwell permeability assays were performed to assess EC barrier integrity in an in vitro BBB model consisting of an HBMEC monolayer (A) and an in vitro 3D BBB model consisting of primary BMECs, pericytes, and astrocytes (B). (C and D) Western blot analysis (C) and quantification (D) of the indicated proteins in whole-cell extracts. (E and F) Western blot analysis (E) and quantification (F) of the indicated proteins in membrane fractions. Data represent 3 independent experiments. ##P < 0.01 vs. control group, *P < 0.05 and **P < 0.01 vs. hypoxia plus IL-1β group, by 1-way ANOVA. (GK) TBI mice were intravenously given 100 μg/kg rmTIMP2, 100 μg/kg rmAlaTIMP2, or PBS for 3 consecutive days. Representative images (G) and quantification (H) of Evans blue dye leaking into the ipsilateral cerebral hemisphere at 72 hours after TBI (n = 10 per group). Microvessels were isolated and subjected to Western blot analysis (I) and quantification (J) of the indicated proteins (n = 5 per group). (K) Immunofluorescence staining analysis of the indicated proteins in the ipsilateral hemispheric brain (n = 5 per group). Scale bars: 50 μm. ##P < 0.01 vs. sham group, *P < 0.05 and **P < 0.01 vs. model group, by 1-way ANOVA.
Figure 4
Figure 4. TIMP2 interacts with α3β1 integrin to regulate the EC barrier in vitro.
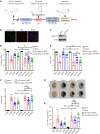
(A) The Gene Ontology terms of the cell component category enrichment of proteins interacting with TIMP2 in HBMECs. (B) Total cell lysates from HBMECs were extracted and subjected to TIMP2 IP, followed by Western blot analysis for the indicated proteins. (C) Total cell lysates from HBMECs were extracted and subjected to β1 integrin or α3 integrin IP assays, followed by Western blot analysis for the indicated proteins. (D) HBMECs were treated with siRNA against β1 integrin or α3 integrin, followed by Western blot analysis for the indicated proteins. (E) HBMECs treated with siRNA against α3 integrin were used for TIMP2 IP assays, followed by Western blot analysis for the indicated proteins. (FJ) HBMECs transfected with siRNA against α3 integrin were treated with rhTIMP2, rhAlaTIMP2, or PBS, and then subjected to hypoxia plus IL-1β injury for 24 hours. Transwell permeability assays were performed to assess EC barrier integrity in an in vitro BBB model (F). Western blot analysis (G) and quantification (H) of the indicated proteins in whole-cell extracts. Western blot analysis (I) and quantification (J) of the indicated proteins in membrane fractions. Data represent 3 independent experiments. ##P < 0.01 vs. control group, **P < 0.01 vs. hypoxia plus IL-1β group, $$P < 0.01, by 1-way ANOVA.
Figure 5
Figure 5. TIMP2 interacts with α3β1 integrin to alleviate TBI-induced BBB disruption.
(A) Experimental scheme for AAV-BR1 targeting cerebrovascular knockdown of α3 integrin, establishment of TBI, and analysis of BBB integrity in mice. (BH) Mice were intravenously injected with AAV-BR1-FLAG-shITGA3 or AAV-BR1-FLAG-shNC. Three weeks after AAV injection, experimental TBI was established in mice, which were treated with 100 μg/kg rmTIMP2, 100 μg/kg rmAlaTIMP2, or PBS, and neurological function was assessed at 72 hours after TBI. (B) FLAG-shITGA3–transduced cells were analyzed by immunofluorescence staining using FLAG (green) and the endothelial marker CD31 (red) in brain cortex 21 days after AAV injection. Scale bars: 75 μm. (C) Microvasculature isolated from brain 21 days after AAV injection and subjected to Western blot analysis for the indicated proteins. Neurological function, including fall latency of accelerated rotarod (D), beam balance (E), and mNSS (F), was assessed at 72 hours after TBI (n = 9–11 per group). (G and H) Representative images (G) and quantification (H) of Evans blue dye leakage into the ipsilateral cerebral hemisphere at 72 hours after TBI (n = 9–10 per group). ##P < 0.01 vs. sham group, **P < 0.01 vs. model group, $P < 0.05, $$P < 0.01, by 1-way ANOVA.
Figure 6
Figure 6. TIMP2 inhibits TBI-induced Src activation.
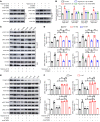
(A) HBMECs treated with rhTIMP2, rhAlaTIMP2, or PBS were subjected to hypoxia plus IL-1β injury for 24 hours. Total cell lysates were subjected to Western blot analysis for p-Src (Tyr416) and Src. Data represent 3 independent experiments. ##P < 0.01 vs. control group, **P < 0.01 vs. hypoxia plus IL-1β group, by 1-way ANOVA. (B) TBI mice were treated with rmTIMP2, rmAlaTIMP2, or PBS for 3 days. Western blot analysis and quantification of p-Src (Tyr416) and Src in the ipsilateral cerebral hemisphere (n = 5 per group). ##P < 0.01 vs. sham group, **P < 0.01 vs. model group, by 1-way ANOVA. (C) HBMECs transfected with WT, Y419D, or Y419A Src were treated with rhTIMP2, rhAlaTIMP2, or PBS, and then subjected to hypoxia plus IL-1β injury for 24 hours. Transwell permeability assays were performed to assess EC barrier integrity. (D and E) HBMECs transfected with siRNA against α3 integrin were treated with rhTIMP2, rhAlaTIMP2, or PBS, and then subjected to hypoxia plus IL-1β injury for 24 hours. Western blot analysis (D) and quantification (E) of p-Src (Tyr416) and Src. Data represent 3 independent experiments. ##P < 0.01 vs. control group, *P < 0.05 and **P < 0.01 vs. hypoxia plus IL-1β group, $P < 0.05, $$P < 0.01, by 1-way ANOVA.
Figure 7
Figure 7. TIMP2 decreases hypoxic plus IL-1β injury–induced VE-cadherin phosphorylation through Src inhibition.
(A and B) HBMECs were treated with rhTIMP2, rhAlaTIMP2, or PBS, and then subjected to hypoxia plus IL-1β injury for 24 hours. Western blot analysis (A) and quantification (B) of p–VE-cadherin at the indicated sites and total VE-cadherin. (C and D) HBMECs transfected with WT, Y419D, or Y419A Src were treated with rhTIMP2 or PBS, and then subjected to hypoxia plus IL-1β injury for 24 hours. Western blot analysis (C) and quantification (D) of p–VE-cadherin at the indicated sites and total VE-cadherin. (E and F) HBMECs transfected with siRNA against α3 integrin were treated with rhTIMP2, rhAlaTIMP2, or PBS, and then subjected to hypoxia plus IL-1β injury for 24 hours. Western blot analysis (E) and quantification (F) of p–VE-cadherin at the indicated sites and total VE-cadherin. Data represent 3 independent experiments. ##P < 0.01 vs. control group, **P < 0.01 vs. hypoxia plus IL-1β group, $$P < 0.01, by 1-way ANOVA.
Figure 8
Figure 8. TIMP2 reduces hypoxic plus IL-1β injury–induced VE-cadherin/catenin complex destabilization through Src inhibition.
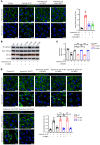
(A) Schematic representation outlining the procedure for the identification of VE-cadherin–interacting molecules regulated by TIMP2. (B) Quantitative LC-MS analysis of VE-cadherin–binding proteins after HBMEC treatment with or without rhTIMP2 in HBMECs subjected to hypoxia plus IL-1β injury for 24 hours. LFQ,label-free quantitation. (CF) HBMECs treated with rhTIMP2 or PBS were subjected to hypoxia plus IL-1β injury for 24 hours. Total cell lysates from the indicated groups were extracted and subjected to IP assay using VE-cadherin antibody. Western blot analysis (C) and quantification (D and E) were performed for the interaction between VE-cadherin and α-catenin, or VE-cadherin and β-catenin. Data represent 3 independent experiments. (F) Immunofluorescence staining and quantitative analysis of colocalization of VE-cadherin (red) and β-catenin (green) in the indicated groups. Cells were counterstained with Hoechst 33342 (blue) for nuclear labeling. Scale bars: 20 μm. Data represent 5 independent experiments. (G and H) HBMECs transfected with WT, Y419D, or Y419A Src were treated with rhTIMP2 or PBS, and then subjected to hypoxia plus IL-1β injury for 24 hours. Western blot analysis (G) and quantification (H) were performed for the interaction between VE-cadherin and α-catenin, or VE-cadherin and β-catenin. Data represent 3 independent experiments. ##P < 0.01 vs. control group, *P < 0.05 and **P < 0.01 vs. hypoxia plus IL-1β group, $$P < 0.01, by 1-way ANOVA.
Figure 9
Figure 9. TIMP2 decreases hypoxic plus IL-1β injury–induced VE-cadherin internalization through Src inhibition.
(A) HBMECs treated with rhTIMP2, rhAlaTIMP2, or PBS were subjected to hypoxia plus IL-1β insult for 24 hours. VE-cadherin internalization from the indicated groups was detected by antibody feeding assays combined with immunofluorescence staining analyses. Representative images and quantification of the mean fluorescence intensity (MFI) of VE-cadherin from the indicated groups (n > 500 cells per group). Scale bars: 20 μm. Data represent 5 independent experiments. (BD) HBMECs transfected with WT, Y419D, or Y419A Src were treated with rhTIMP2 or PBS, and then subjected to hypoxia plus IL-1β injury for 24 hours. Western blot analysis (B) and quantification (C) of VE-cadherin in the membrane fraction. (D) Representative images and quantification of the MFI of VE-cadherin from the indicated groups (n > 500 cells per group). Scale bars: 20 μm. Data represent 3 (B and C) or 5 (D) independent experiments. ##P < 0.01 vs. control group, **P < 0.01 vs. hypoxia plus IL-1β group, $$P < 0.01, by 1-way ANOVA.
Figure 10
Figure 10. TIMP2 enhances Rac1 activity to attenuate stress fiber formation.
(A) HBMECs treated with rhTIMP2, rhAlaTIMP2, or PBS were subjected to hypoxia plus IL-1β insult for 24 hours. Cells were double-labeled for F-actin+ (red) and the nuclear marker Hoechst 33342 (blue). (B) HBMECs transfected with WT or Y658&685&731E VE-cadherin were treated with rhTIMP2, rhAlaTIMP2, or PBS, and then subjected to hypoxia plus IL-1β insult for 24 hours. Cells were double-labeled for F-actin+ (red) and the nuclear marker Hoechst 33342 (blue). Scale bars: 25 μm. (CE) HBMECs treated with rhTIMP2, rhAlaTIMP2, or PBS were subjected to hypoxia plus IL-1β insult for 24 hours. Western blot analysis (C) and quantification of Rac1-GTP levels (D) and RhoA-GTP levels (E) in cell lysates. (F and G) HBMECs transfected with WT or Y658&685&731E VE-cadherin were treated with rhTIMP2, rhAlaTIMP2, or PBS, and then subjected to hypoxia plus IL-1β injury for 24 hours. Western blot analysis (F) and quantification (G) of Rac1-GTP levels. (H) HBMECs transfected with WT or 17N Rac1 were treated with rhTIMP2, rhAlaTIMP2, or PBS, and then subjected to hypoxia plus IL-1β injury for 24 hours. Transwell permeability assays were performed to assess EC barrier integrity. Data represent 3 independent experiments. ##P < 0.01 vs. control group, **P < 0.01 vs. hypoxia plus IL-1β group, $$P < 0.01, by 1-way ANOVA.
Figure 11
Figure 11. A working model depicting the role of TIMP2 in regulating BBB integrity in TBI.

References

    1. Sweeney MD, et al. Blood-brain barrier: from physiology to disease and back. Physiol Rev. 2019;99(1):21–78. doi: 10.1152/physrev.00050.2017. - DOI - PMC - PubMed
    1. Capizzi A, et al. Traumatic brain injury: an overview of epidemiology, pathophysiology, and medical management. Med Clin North Am. 2020;104(2):213–238. doi: 10.1016/j.mcna.2019.11.001. - DOI - PubMed
    1. Hay JR, et al. Blood-brain barrier disruption is an early event that may persist for many years after traumatic brain injury in humans. J Neuropathol Exp Neurol. 2015;74(12):1147–1157. doi: 10.1097/NEN.0000000000000261. - DOI - PMC - PubMed
    1. Brett BL, et al. Traumatic brain injury and risk of neurodegenerative disorder. Biol Psychiatry. 2022;91(5):498–507. doi: 10.1016/j.biopsych.2021.05.025. - DOI - PMC - PubMed
    1. Abrahamson EE, Ikonomovic MD. Brain injury-induced dysfunction of the blood brain barrier as a risk for dementia. Exp Neurol. 2020;328:113257. doi: 10.1016/j.expneurol.2020.113257. - DOI - PubMed

Publication types

MeSH terms