. 2024 Feb 1;134(3):e169441.
doi: 10.1172/JCI169441.

RAB7 deficiency impairs pulmonary artery endothelial function and promotes pulmonary hypertension

Affiliations

RAB7 deficiency impairs pulmonary artery endothelial function and promotes pulmonary hypertension

Bryce Piper et al. J Clin Invest. .

Abstract

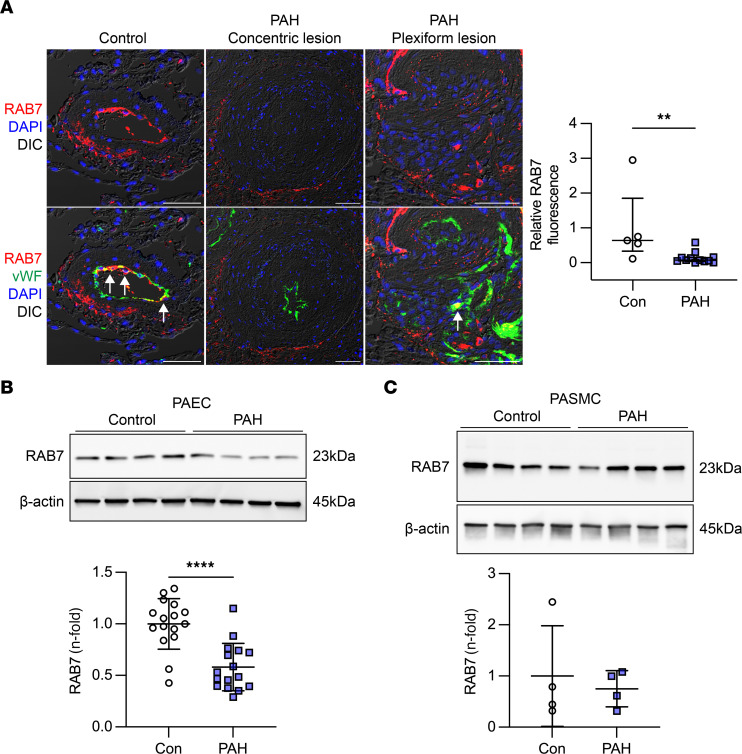
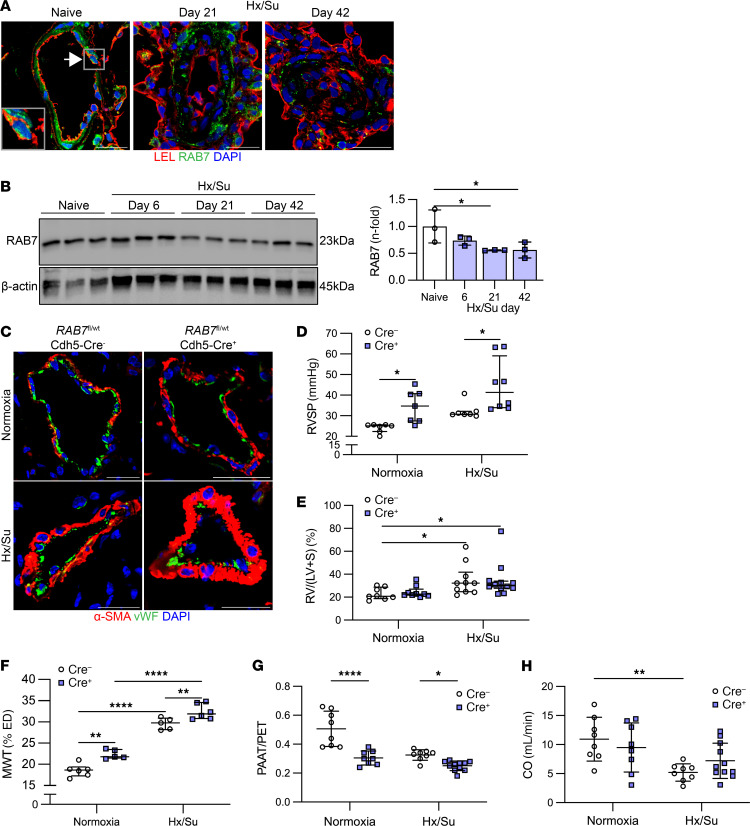
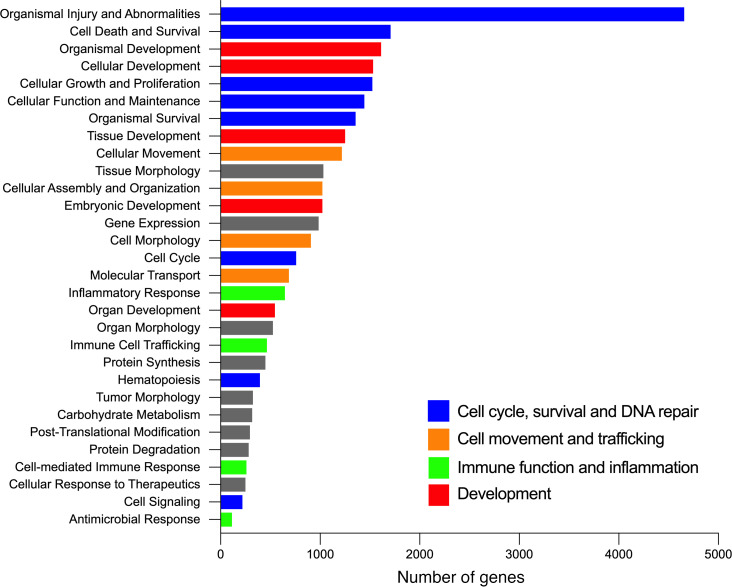
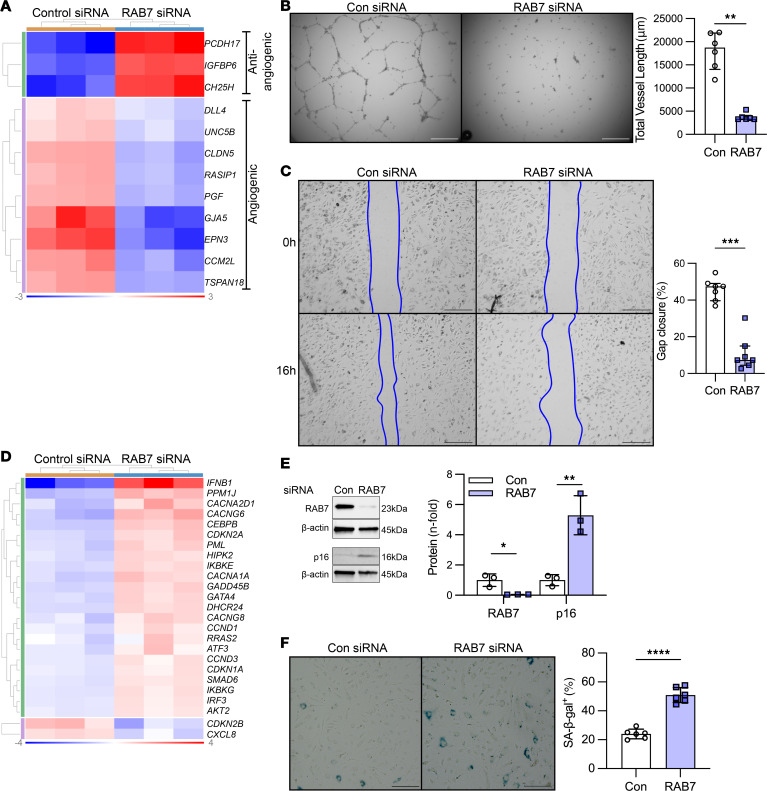
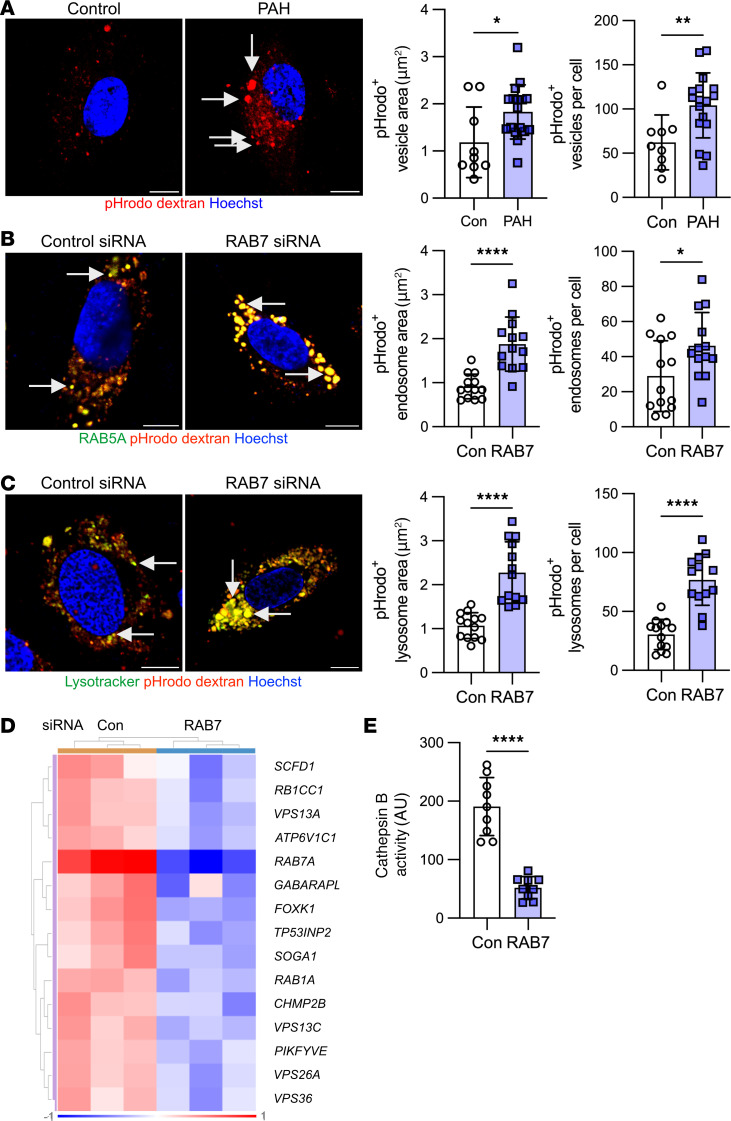
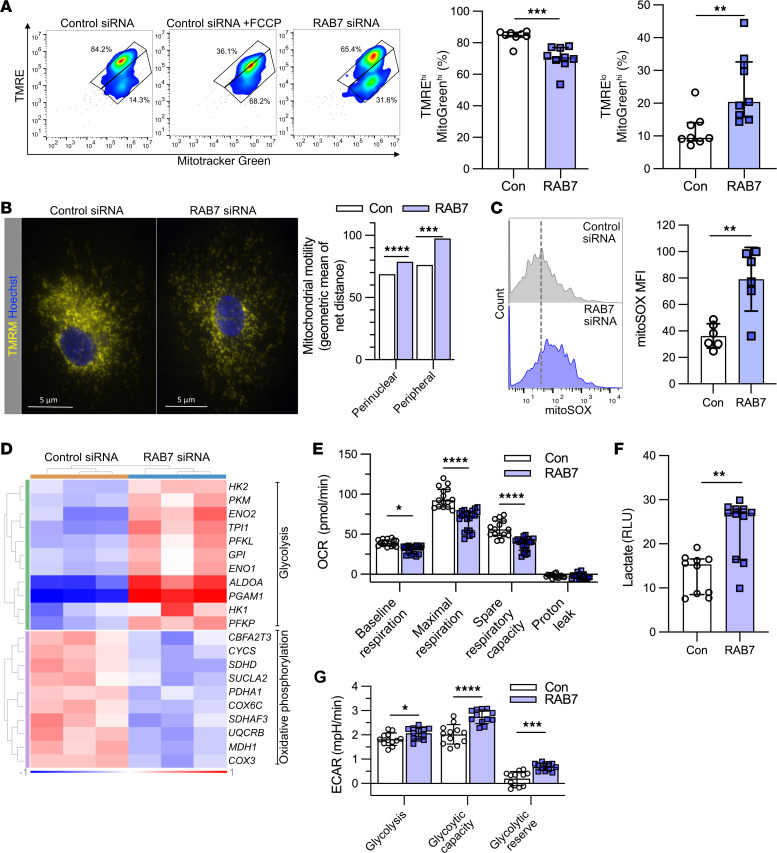
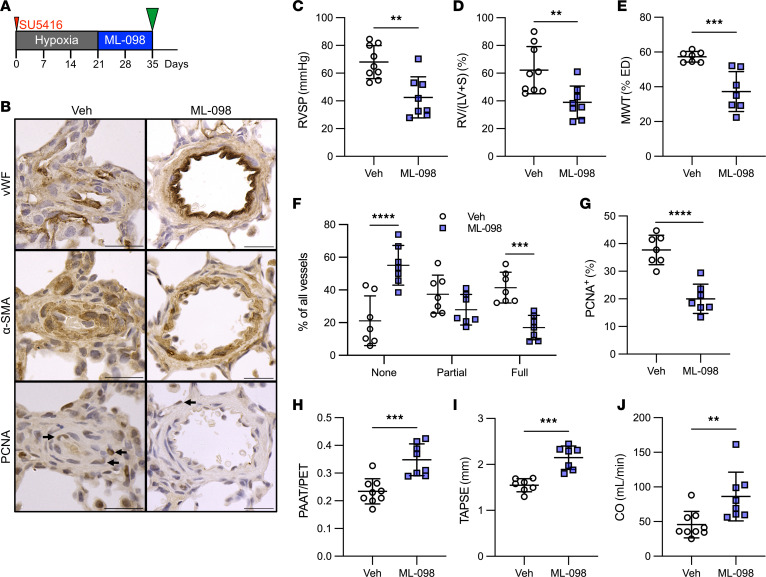
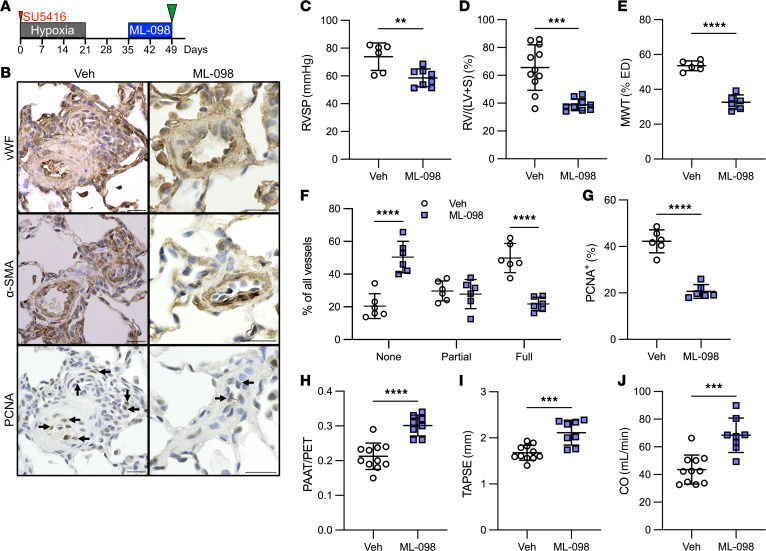
Pulmonary arterial hypertension (PAH) is a devastating and progressive disease with limited treatment options. Endothelial dysfunction plays a central role in the development and progression of PAH, yet the underlying mechanisms are incompletely understood. The endosome-lysosome system is important to maintain cellular health, and the small GTPase RAB7 regulates many functions of this system. Here, we explored the role of RAB7 in endothelial cell (EC) function and lung vascular homeostasis. We found reduced expression of RAB7 in ECs from patients with PAH. Endothelial haploinsufficiency of RAB7 caused spontaneous pulmonary hypertension (PH) in mice. Silencing of RAB7 in ECs induced broad changes in gene expression revealed via RNA-Seq, and RAB7-silenced ECs showed impaired angiogenesis and expansion of a senescent cell fraction, combined with impaired endolysosomal trafficking and degradation, suggesting inhibition of autophagy at the predegradation level. Furthermore, mitochondrial membrane potential and oxidative phosphorylation were decreased, and glycolysis was enhanced. Treatment with the RAB7 activator ML-098 reduced established PH in rats with chronic hypoxia/SU5416. In conclusion, we demonstrate for the first time to our knowledge the fundamental impairment of EC function by loss of RAB7, causing PH, and show RAB7 activation to be a potential therapeutic strategy in a preclinical model of PH.

Keywords: Autophagy; Cellular senescence; Endothelial cells; Pulmonology.


Figures

Figure 1
Figure 1. Reduced RAB7 expression in endothelial cells from PAH patients.
(A) Representative optical sections (confocal microscopy, representative of 5 PAs from 3 control [Con] patients and 12 PAs from 3 patients with PAH) show reduced RAB7 expression in ECs in concentric and plexiform lesions from patients with PAH compared with controls. Arrows indicate vWF+ ECs with strong RAB7 expression. Scale bars: 50μm. Nuclei were stained with DAPI. The graph shows quantification of relative RAB7 immunofluorescence in ECs from control and PAH PAs. (B and C) Representative Immunoblot (n = 4 individual control and PAH PAEC lines) and quantification of RAB7 in PAECs (B) in 4 immunoblots from 12 individual controls (failed donors) and 15 individual patients with PAH (n = 16 data points total per group from 4 repeat experiments). (C) Representative immunoblot and quantification of RAB7 in PASMCs from 4 individual controls (failed donors) and 4 individual patients with PAH. β-Actin was used as the loading control. All graphs show single values and the median ± IQR (A) or the mean ± SD (B and C). **P < 0.01 and ****P < 0.0001, by 2-tailed Mann-Whitney U test (A) or 2-tailed Student’s t test (B and C).
Figure 2
Figure 2. Loss of RAB7 expression causes PH in vivo.
(A) Representative confocal microscopic immunofluorescence images (representative of 3 animals per group) show strong RAB7 staining (green pseudocolor) in PAs from naive rats, including in PAECs (a representative cell is indicated by the arrow and is shown in more detail in the inset). PAECs are indicated by Lycopersicon esculentum, tomato lectin (LEL) staining (red pseudocolor). In Hx/Su-treated rats, RAB7 expression decreased in ECs in the remodeled PAs at days 21 and 42. Scale bars: 25 μm. Original magnification, ×600 (insets). (B) Representative immunoblot and densitometric analysis of RAB7 expression in naive and Hx/Su rats. (C) Representative double immunofluorescence for vWF and α-SMA (optical section, confocal microscopy). Scale bars: 25 μm. (DH) RVSP (D), Fulton RV hypertrophy index: RV/(left ventricle + septum) [RV/(LV+S)] (E), PA MWT (F), PAAT/PET (G), echocardiographically estimated cardiac output (CO) (H) of RAB7fl/WT Cdh5-Cre- and RAB7fl/WT Cdh5-Cre+ mice exposed to normoxia and Hx/Su. n = 3 per group (B); n = 7, except n = 8 for Hx/Su Cre+ (D); n = 8, except n = 9 (normoxia Cre+), n = 10 (Hx/Su Cre- and n = 12 (Hx/Su Cre+) (E); n = 5 (normoxia Cre+ and Hx/Su Cre), n = 6 (normoxia Cre- and Hx/Su Cre+) (F); n = 8, except n = 12 (Hx/Su Cre+) (G and H). *P < 0.05, **P < 0.01, and ****P < 0.0001, by 1-way ANOVA followed by Holm-Šidák multiple-comparison test (B), 2-way ANOVA with Holm-Šidák multiple-comparison test, and evaluation of normality of residual distribution (D’Agostino-Pearson) (D and F), and Kruskal-Wallis analysis with Dunn’s multiple-comparison test (E). All graphs show single values and the mean ± SD (B, F, G, and H) or the median ± IQR (D and E).
Figure 3
Figure 3. RNA-Seq of RAB7-silenced PAECs.
Ingenuity Pathway Analysis of bulk RNA-Seq data in PAECs transfected with RAB7 siRNA versus control siRNA (fold change >|1.25|, adjusted P value <0.05) (representing n = 3 per group). The diagram lists the 30 most regulated function terms and shows the number of DEGs in the RNA-Seq data set within each category. DEG terms were labeled according to their relevance for cell-cycle and DNA repair (blue), cellular movement and trafficking (orange), immune function and inflammation (green), and development (red).
Figure 4
Figure 4. Loss of RAB7 induces endothelial dysfunction and senescence in PAECs.
(A) The clustered heatmap shows increased expression of antiangiogenic genes and reduced expression of angiogenic and EC barrier function genes in RNA-Seq of PAECs after RAB7 siRNA treatment versus treatment with control siRNA. n = 3 per group. (B) Representative phase-contrast images after 24 hours and quantification of total network length in RAB7 siRNA–treated PAECs. n = 6 per group. (C) Representative phase-contrast images after 16 hours of a gap closure assay and quantification of the percentage of gap closure in RAB7 siRNA–transfected PAECs versus treatment with control siRNA. n = 7 per group. (D) Clustered heatmap of DEGs of senescence-associated gene expression pattern (Ingenuity Pathway Analysis) in RNA-Seq of PAECs treated with RAB7 siRNA. n = 3 per group. (E) Representative immunoblots and densitometric quantification for RAB7 and p16 in PAECs treated with RAB7 siRNA. n = 3 per group. (F) Representative images and quantification of the fraction of SA–β-gal+ PAECs after RAB7 siRNA treatment versus treatment with control siRNA. n = 6 per group. Data are shown as single values and the median ± IQR (B and C) or the mean ± SD (E and F). *P < 0.05, **P < 0.01, ***P < 0.001, ****P < 0.0001, by 2-tailed Mann-Whitney U test (B and C) or 2-tailed Student’s t test (E and F). Heatmap data are normalized log2 fold expression. Data in B, C, E, and F are representative of 2 or more experiments. Scale bars: 250 μm (B and C) and 200 μm (F).
Figure 5
Figure 5. Impaired endosome-lysosome function in PAH PAECs and RAB7-deficient PAECs.
(A) Representative optical sections (confocal microscopy) and quantification of pHrodo dextran+ vesicle area and number of vesicles per cell indicate the accumulation of pHrodo dextran after 20 minutes in enlarged vesicles in PAH PAECs (arrows), but not in control PAECs. pHrodo dextran is taken up by endosomes and emits red fluorescence signal when the pH drops during endosomal acidification. n = 9 (control) and n = 17 (PAH). (B) Representative optical sections (confocal microscopy) show an accumulation of pHrodo dextran after 20 minutes in enlarged early endosomes with RAB7 silencing. Early endosomes were identified by transfection of PAECs with baculovirus expressing GFP-labeled RAB5. Quantification of RAB5+ pHrodo dextran+ endosome area and number per cell confirmed that dextran accumulated in enlarged early endosomes following RAB7 silencing. n = 13 per group. (C) Representative optical sections (confocal microscopy) show an accumulation of pHrodo dextran after 20 minutes in enlarged lysosomes in RAB7 siRNA–treated PAECs. Lysosomes were labeled with LysoTracker. Quantification of LysoTracker+ pHrodo dextran+ lysosome area and number per cell confirmed that dextran accumulated in enlarged lysosomes following RAB7 silencing. n = 13 per group. (D) Clustered heatmap shows autophagy-related DEGs that were found to be downregulated in RNA-Seq from PAECs treated with RAB7 siRNA. Expression is normalized log2-fold. (E) Reduced cathepsin B activity also indicates impaired lysosomal autophagy. n = 9 per group. Scale bars: 10 μm (AC). All graphs show single values and the mean ± SD. Data in AC are representative of 2 or more experiments. *P < 0.05, **P < 0.01, ****P < 0.0001, by 2-tailed Student’s t test.
Figure 6
Figure 6. RAB7 silencing impairs mitochondrial membrane potential and mitochondrial function.
(A) RAB7 siRNA impaired ΔΨm as assessed by TMRE and MitoTracker Green (MitoGreen) flow cytometry. Carbonyl cyanide FCCP was used as a positive control (depolarizes mitochondrial membrane). TMREhi MitoGreenhi cells indicate cells with functional mitochondria, whereas TMRElo MitoGreenhi cells are cells with dysfunctional mitochondria. n = 8 (control) and n = 9 (RAB7). (B) Representative TMRM-stained images show overall reduction and perinuclear accumulation of functional mitochondria in RAB7 siRNA–treated PAECs. Results are representative of 3 experiments. Scale bars: 5 μm. RAB7 knockdown increased mitochondrial motility in peripheral and perinuclear regions. (C) RAB7 knockdown promoted mitochondrial ROS production as indicated by flow cytometry for mitoSOX. n = 6 per group for the representative histogram plots and quantification of MFI. (D) Clustered heatmap shows upregulated glycolysis-related DEGs and downregulated oxidative phosphorylation–related DEGs in bulk RNA-Seq from PAECs plus RAB7 siRNA. Expression is normalized log2-fold. (E) Seahorse high-resolution respirometrics show a reduced OCR with RAB7 siRNA at basal respiration, maximal respiration, and spare respiratory capacity. n = 15 (control) and n = 21 (RAB7). (F) Luminescence assay for lactate: increased lactate production in RAB7 siRNA–treated PAECs. n = 10 (control) and n = 11 (RAB7). (G) ECAR data reveal more rapid acidification (i.e., greater reliance on glycolysis) in the RAB7 siRNA–treated PAECs as shown for glycolysis and the basal and maximum glycolytic rates. n = 12 per group. All graphs show single values and the median ± interquartile range (A, E, and F) or the mean ± SD (C and G) (except B, as bar graphs in B indicate the geometric mean of a log-normal distribution). Data in AC, E, F, and G are from 2 or more experiments. *P < 0.05, **P < 0.01, ***P < 0.001, and ****P < 0.0001, by 2-tailed Mann-Whitney U test (A and F), 2-tailed Student’s t test (C), and 2-way ANOVA (E and G) with Holm-Šidák post hoc test and normality testing of residuals (D’Agostino-Pearson).
Figure 7
Figure 7. RAB7 activator ML-098 reduces PH in rats exposed to chronic hypoxia/SU5416.
(A) Interventional treatment diagram. (B) Representative vWF, α-SMA, and PCNA immunohistochemistry showing serial sections of the same PA. (C) RVSP, (D) Fulton index, (E) MWT of small PAs, (F) occlusion of small PAs, (G) percentage of PCNA+ PA mural cells, (H) ratio of PAAT versus PET, (I) TAPSE, and (J) echocardiographic estimation of RV CO. Scale bars: 25 μm. n = 9 (vehicle) and n = 8 (ML-098) (C, D, H, and J), n = 7 (EG and I). All graphs show single values and the mean ± SD. **P < 0.01, ***P < 0.001, and ****P < 0.0001, by 2-sided Student’s t test. Veh, vehicle.
Figure 8
Figure 8. RAB7 activator ML-098 reverses established PH in rats exposed to Hx/Su.
(A) Reversal treatment diagram. (B) Representative vWF, α-SMA, and PCNA immunohistochemistry showing serial sections of the same PA. (C) RVSP, (D) the Fulton index, (E) MWT of small PAs, (F) occlusion of small PAs, (G) percentage of PCNA+ PA mural cells, and echocardiographic data for (H) the ratio of PAAT to PET, (I) TAPSE, and (J) RV CO. Scale bars: 25 μm. n = 6 (vehicle) and n = 8 (ML-098) (C), n = 11 (vehicle) and n = 9 (ML-098) (D), n = 6 (EG), n = 11 (vehicle) and n = 8 (ML-098) (HJ). All graphs show single values and the mean ± SD. Data were analyzed using 2-sided Student’s t test. **P < 0.01, ***P < 0.001, and ****P < 0.0001.

Update of

References

    1. Humbert M, et al. Pathology and pathobiology of pulmonary hypertension: state of the art and research perspectives. Eur Respir J. 2019;53(1):1801887. doi: 10.1183/13993003.01887-2018. - DOI - PMC - PubMed
    1. Stacher E, et al. Modern age pathology of pulmonary arterial hypertension. Am J Respir Crit Care Med. 2012;186(3):261–272. doi: 10.1164/rccm.201201-0164OC. - DOI - PMC - PubMed
    1. Lee SD, et al. Monoclonal endothelial cell proliferation is present in primary but not secondary pulmonary hypertension. J Clin Invest. 1998;101(5):927–934. doi: 10.1172/JCI1910. - DOI - PMC - PubMed
    1. Bhagwani A, et al. Clonally selected primitive endothelial cells promote occlusive pulmonary arteriopathy and severe pulmonary hypertension in rats exposed to chronic hypoxia. Sci Rep. 2020;10(1):1136. doi: 10.1038/s41598-020-58083-7. - DOI - PMC - PubMed
    1. Culley MK, et al. Frataxin deficiency promotes endothelial senescence in pulmonary hypertension. J Clin Invest. 2021;131(11):e136459. doi: 10.1172/JCI136459. - DOI - PMC - PubMed

Substances