. 2023 Dec 5;120(49):e2308671120.
doi: 10.1073/pnas.2308671120. Epub 2023 Nov 28.

mRNA translation in astrocytes controls hippocampal long-term synaptic plasticity and memory

Affiliations

mRNA translation in astrocytes controls hippocampal long-term synaptic plasticity and memory

Vijendra Sharma et al. Proc Natl Acad Sci U S A. .

Abstract

Activation of neuronal protein synthesis upon learning is critical for the formation of long-term memory. Here, we report that learning in the contextual fear conditioning paradigm engenders a decrease in eIF2α (eukaryotic translation initiation factor 2) phosphorylation in astrocytes in the hippocampal CA1 region, which promotes protein synthesis. Genetic reduction of eIF2α phosphorylation in hippocampal astrocytes enhanced contextual and spatial memory and lowered the threshold for the induction of long-lasting plasticity by modulating synaptic transmission. Thus, learning-induced dephosphorylation of eIF2α in astrocytes bolsters hippocampal synaptic plasticity and consolidation of long-term memories.

Keywords: astrocytes; integrated stress response; learning and memory; protein synthesis; synaptic plasticity.


Conflict of interest statement

Competing interests statement:The authors declare no competing interest.

Figures

Fig. 1.
Fig. 1.
Learning-induced reduction of p-eIF2α in astrocytes in the CA1 region of the hippocampus. (A) Schematics of FC and a timeline with a representative site for measuring p-eIF2α in astrocytes in the hippocampus. (B) Representative images of p-eIF2α in the hippocampus astrocytes in naive mice and 15 min post-FC. Arrows indicate astrocytes. (C) After FC, astrocytes in the CA1 region of the hippocampus showed reduced p-eIF2α levels at 15 min postconditioning, as indicated by quantitative analysis of immunofluorescence images (t10.95 = 3.560; P = 0.0045, n = 8, 8 mice, points represent group means of 7 to 12 astrocytes in the CA1 subregion from 3 coronal sections per mouse; a two-tailed unpaired t test with Welch’s correction was used to compare the p-eIF2α levels between Naive vs. 15 min after FC). Mean ± SEM. (Scale bar, 20 μm.) The stratum radiatum (SR) layer of the hippocampal CA1 region was used for the immunofluorescence imaging and quantification of B and C.
Fig. 2.
Fig. 2.
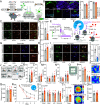
Reduction of p-eIF2α in astrocytes in the CA1 region of the hippocampus facilitates protein synthesis and memory. (A) Genetics of Eif2αA/A;fTg+ mice injected with AAV-GfaABC1D-Cre (GfaABC1D-Cre). (B) IHC image shows that eGFP is expressed in GFAP-positive astrocytes in the dorsal hippocampal CA1 region, representative of three independent experiments. The astrocyte-specific promoter (GfaABC1D) is ~80% efficient and >90% specific in targeting astrocytes. (C) Representative IHC labeling of eIF2α and p-eIF2α in CA1 astrocytes. eIF2α and p-eIF2α levels were measured in GFP-positive astrocytes. (D) Quantitative analyses of IHC images show p-eIF2α/eIF2α in control (GfaABC1D-GFP) and GfaABC1D-Cre mice; p-eIF2α levels are significantly reduced in astrocytes in the hippocampal CA1 region of the GfaABC1D-Cre mice as compared to control (t6.906 = 3.943; P = 0.0057, n = 5, 6 mice, points represent group means of 6 to 8 astrocytes in the SR layer of the hippocampal CA1 subregion from 3 coronal sections per mouse; a two-tailed unpaired t test with Welch’s correction was used to compare the p-eIF2α levels between the groups). (E) Timeline for AHA injection and fluorescent labeling to identify newly synthesized proteins in astrocytes in the hippocampus. (F) AHA’s azide group (highlighted in pink) forms a covalent bond with the fluorescent alkyne group (shown in red), allowing visualization of AHA-labeled nascent proteins via Cu(S)-mediated FUNCAT. (G and H) Representative FUNCAT signals in GfaABC1D-GFP and GfaABC1D-Cre astrocytes in the CA1 region of the hippocampus, showing increased AHA incorporation in the GfaABC1D-Cre CA1-astrocytes compared to GfaABC1D-GFP (t5.69 = 3.32; P = 0.017, n = 5, 5 mice, points represent group means of 11 to 14 astrocytes in the CA1 subregion from 3 coronal sections per mouse; a two-tailed unpaired t test with Welch’s correction was used to compare the AHA incorporation levels between the groups). Arrow indicates astrocyte-specific fluorescence signals. (I) The protein synthesis inhibitor anisomycin inhibits the incorporation of AHA into newly synthesized polypeptides in GfaABC1D-Cre mice (t12.37 = 10.57; P = 1 × 10⁻⁷, n = 8, 8 mice, points represent group means of 4 to 6 astrocytes in the CA1 subregion from 3 coronal sections per mouse; a two-tailed unpaired t test with Welch’s correction was used to compare the AHA incorporation levels between the groups). AHA is incorporated into newly synthesized proteins, top image (saline). In the bottom image, AHA incorporation is inhibited by anisomycin pretreatment. Arrow indicates astrocyte-specific fluorescence signals. (J) Schematic of FC protocol. (K) Long-term contextual fear memory is enhanced in GfaABC1D-Cre mice (F1,18 = 8.079; P = 0.0025, n = 10, 13). (LN) In GfaABC1D-Cre mice, short-term contextual fear memory, short-term auditory fear memory, and long-term auditory fear memory remain unaffected. (O) Illustration of open field apparatus divided into outer and inner zones. (P) Both groups exhibited similar durations in the outer and inner zones during the test. Representative heat maps display the paths taken within the open-field test apparatus. (Q) The average distance traveled by both groups in the open field was similar. (RT) Ablation of p-eIF2α in astrocytes enhances memory acquisition (Day 3, F1, 21 = 11.46; P = 0.0305, n = 12, 12), time in the target quadrant (F3, 44 = 4.054; P = 0.0337, n = 12, 12), and platform crossing (t21.96 = 2.738; P = 0.012, n = 12, 12) in MWM test. Representative trajectory heat maps for searching platform on the probe day. (U) The mean total distance swam during the probe test was similar in both groups. Data are presented as mean ± SEM. The P-value was measured using an unpaired two-tailed t test with Welch’s correction (in D, H, I, and T) and two-way ANOVA (or mixed model) in K, R, and S, followed by Sidak’s multiple comparisons post hoc test. [Scale bars: 200 μm (B, Upper row) and 20 μm (B, Lower row, C, and G).]
Fig. 3.
Fig. 3.
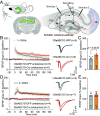
Ablation of p-eIF2α in astrocytes in the CA1 region of the hippocampus facilitates LTP. (A) The scheme shows Schaffer collateral fibers in an acute hippocampal slice, where two distinct pathways are stimulated, and fEPSPs are recorded in the CA1 SR. (B and C) A single train of 1 s HFS elicited sustained L-LTP in slices from GfaABC1D-Cre-injected into the CA1 region of the hippocampus of mice (C, L-LTP, 180 min post-1×HFS, t7.287 = 2.424; P = 0.0445, n = 5, 6). Stimulation of the SR on opposing sides of the recording electrode did not change fEPSPs (nontetanized pathway). (D and E) L-LTP induced by four tetanic trains (4 × HFS) at 100 Hz is similar in slices from GfaABC1D-GFP and GfaABC1D-Cre-injected mice (E, L-LTP, 180 min post-4×HFS). Data are presented as mean ± SEM in BE. Two-way ANOVA (repeated measures) (BE) with Sidak’s multiple comparisons post hoc test. Data points represent individual mice unless stated otherwise.
Fig. 4.
Fig. 4.
Reduction of p-eIF2α in the hippocampus astrocytes facilitates excitatory synaptic transmission and reduces inhibitory synaptic transmission. (A) Illustration of the target area for p-eIF2α reduction in astrocytes in the dorsal CA1 region of the hippocampus. (B) Schematics of experimental arrangement for recording miniature excitatory and inhibitory synaptic currents in CA1 mCherry-positive excitatory neurons (mice injected with AAV9-CaMK2α-mCherry). (C) Representative traces of mEPSCs from CaMK2α-mCherry neurons from GfaABC1D-GFP (black) or GfaABC1D-Cre-injected CA1 region of the hippocampus (orange). (D) The distribution of mEPSC interevent intervals was observed in CA1 excitatory neurons in mice injected with GfaABC1D-GFP or GfaABC1D-Cre (P = 1.7 × 10⁻³, nneurons = 12, 16). (E) Increased mean frequency of mEPSCs in mice injected with GfaABC1D-Cre (t25.49 = 2.065; P = 0.0493, nneurons = 12, 16). (F) Cumulative distribution plots showing mEPSC amplitude. (G) mEPSC amplitude is similar in GfaABC1D-GFP and GfaABC1D-Cre-injected mice. (H) Representative traces of mIPSC. (I) Cumulative distribution of intervals between mIPSC events in CA1 excitatory neurons in mice injected with GfaABC1D-GFP or GfaABC1D-Cre (P = 0.01, nneurons = 11, 19). (J) The frequency of mIPSC was decreased in mice administered with GfaABC1D-Cre (t23.14 = 2.184; P = 0.0394, nneurons = 11, 19). (K) Cumulative distribution of mIPSC amplitudes. (L) Average mIPSC amplitude. Data are presented as mean ± SEM and binned cumulative distribution for all cells (DG and IL). Kolmogorov–Smirnov test (D, F, I, and K); two-tailed unpaired t test with Welch’s correction (E, G, J, and L).

References

    1. Costa-Mattioli M., Sossin W. S., Klann E., Sonenberg N., Translational control of long-lasting synaptic plasticity and memory. Neuron 61, 10–26 (2009). - PMC - PubMed
    1. Klann E., Sweatt J. D., Altered protein synthesis is a trigger for long-term memory formation. Neurobiol. Learn. Mem. 89, 247–259 (2008). - PMC - PubMed
    1. Costa-Mattioli M., et al. , eIF2alpha phosphorylation bidirectionally regulates the switch from short- to long-term synaptic plasticity and memory. Cell 129, 195–206 (2007). - PMC - PubMed
    1. Sossin W. S., Costa-Mattioli M., Translational control in the brain in health and disease. Cold Spring Harb. Perspect. Biol. 11, a032912 (2019). - PMC - PubMed
    1. Sharma V., et al. , eIF2alpha controls memory consolidation via excitatory and somatostatin neurons. Nature 586, 412–416 (2020). - PMC - PubMed

LinkOut - more resources