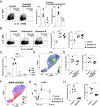
. 2023 Dec 5;120(49):e2302903120.
doi: 10.1073/pnas.2302903120. Epub 2023 Nov 28.

The USP7-STAT3-granzyme-Par-1 axis regulates allergic inflammation by promoting differentiation of IL-5-producing Th2 cells

Affiliations

The USP7-STAT3-granzyme-Par-1 axis regulates allergic inflammation by promoting differentiation of IL-5-producing Th2 cells

Jin Kumagai et al. Proc Natl Acad Sci U S A. .

Abstract

Uncontrolled type 2 immunity by type 2 helper T (Th2) cells causes intractable allergic diseases; however, whether the interaction of CD4+ T cells shapes the pathophysiology of allergic diseases remains unclear. We identified a subset of Th2 cells that produced the serine proteases granzyme A and B early in differentiation. Granzymes cleave protease-activated receptor (Par)-1 and induce phosphorylation of p38 mitogen-activated protein kinase (MAPK), resulting in the enhanced production of IL-5 and IL-13 in both mouse and human Th2 cells. Ubiquitin-specific protease 7 (USP7) regulates IL-4-induced phosphorylation of STAT3, resulting in granzyme production during Th2 cell differentiation. Genetic deletion of Usp7 or Gzma and pharmacological blockade of granzyme B ameliorated allergic airway inflammation. Furthermore, PAR-1+ and granzyme+ Th2 cells were colocalized in nasal polyps from patients with eosinophilic chronic rhinosinusitis. Thus, the USP7-STAT3-granzymes-Par-1 pathway is a potential therapeutic target for intractable allergic diseases.

Keywords: asthma, intractable allergic disease; granzyme; pathogenic Th2 cell; signal transducers and activators of transcription (STAT)3; ubiquitin specific protease 7 (USP7).


Conflict of interest statement

Competing interests statement:The authors declare no competing interest.

Figures
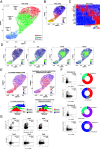
Fig. 1.
Fig. 1.
A single-cell analysis revealed that granzyme A- and B-producing Th2 cells are distinct from IL-5- and IL-13-producing Th2 cells. (A–E) Analyses of single-cell RNA-seq (scRNA-seq) data of Th2 cells from wild-type mice. Splenic naive CD4+ T cells purified from wild-type (WT) mice were cultured under Th2 conditions in vitro for 5 d for scRNA-seq analyses. Th2 cells were CD4+ CD8α cells isolated by fluorescence-activated cell sorting (FACS) and analyzed by scRNA-seq. (A) Three gene expression clusters (1 to 3) projected on a UMAP of the scRNA-seq libraries from Th2 cells and colored according to the cellular subset, as indicated in SI Appendix, Fig. S1D, from two independent experiments. (B) A UMAP projection of Th2 cells with a pseudo-time trajectory analysis is shown. The plotting symbol for each cell is colored based on the pseudo-time. Cells that have infinite pseudo-time are shown in gray. (C) The relative expression of genes (rows) across cells (columns) is shown. (D) The expression of Il5, Il13, Gzma, and Gzmb projected on UMAPs. (E) ssGSVA scores of CYTOKINE PRODUCTION (Left column) and THROMBIN ACTIVATED RECEPTOR SIGNALING PATHWAY (Right column) are projected on UMAPs (Upper) and ridgeline plots (Lower). (F) Representative plots of intracellular staining of granzyme A and B together with IL-5 and IL-13 in Th2 cells (Left column) and pie charts of the proportion of subpopulation of Th2 cells; i.e. granzyme A single-producers (red), granzyme B single-producers (pink), IL-5 single-producers (light blue), IL-13 single-producers (blue), and granzymes and Th2 cytokines double produces (gray). Three mice from three independent experiments were evaluated. (G) Representative intracellular staining profiles of granzyme A and granzyme B (Upper) and IL-5 and IL-13 (Lower) in Th2 cells at the indicated time points. Three independent experiments were performed with similar results.
Fig. 2.
Fig. 2.
The granzyme-Par-1 axis induced enhanced production of IL-5 and IL-13 in Th2 cells via activation of the p38 MAPK signaling pathway. (A) Representative plots of intracellular staining of IL-5 and IL-13 in Th2 cells (Left). Naive CD4+ T cells were cultured under Th2 conditions with control or Serpinb12 or Srpinb9 (granzyme A and B inhibitors, respectively). Pooled data from three independent experiments are provided (Right). (B) Representative plots of intracellular staining of IL-5 and IL-13 in Th2 cells are shown (Left). Naive CD4+ T cells were cultured under Th2 conditions with recombinant granzyme A or B. Pooled data from three independent experiments are provided (Right panels; n = 4 per group). (C) Quantitative RT-PCR was conducted to detect F2r in Th1, Th2, Th17, or iTreg cells (n = 3 per group). Three independent experiments were performed with similar results. (D) The expression of F2r projected on a UMAP of the scRNA-seq libraries from Th2 cells (Fig. 1A). (E) Pooled data showing the proportion of IL-5 or IL-13-producing Th2 cells in vitro. Naive CD4+ T cells were cultured under Th2 conditions with Par-1-neutralizing antibody (n = 6 per group). (F) ssGSVA scores of MAPK CASCADE are projected on a UMAP. (G) With the indicated stimulation and time points, the median fluorescence intensity (MFI) of phosphorylated p38 (phospho-p38) is shown (n = 3 per group). Pooled data from three independent experiments are provided. (H) Pooled data showing the proportion of IL-5 or IL-13-producing Th2 cells in vitro. Naive CD4+ T cells were cultured under Th2 conditions with p38 inhibitor (SB202190) (n = 6 per group). Data represent the mean ± SD. *P < 0.05, **P < 0.01, ***P < 0.001; P-values were calculated by an unpaired t test (A, E, and H), a one-way ANOVA (B and C) or two-way ANOVA (G).
Fig. 3.
Fig. 3.
Usp7 deficiency in Th2 cells resulted in decreased production of granzymes A and B accompanied by decreased production of IL-5 and IL-13 in vitro. (A) Splenic naive CD4+ T cells purified from Cre-ERT2 Usp7+/+ or Cre-ERT2 Usp7fl/fl mice were cultured under Th2 conditions in vitro for 5 d for the RNA-seq analysis. RNA-seq data were reconstructed as an MA plot depicting the differential gene expression in Th2 cells from a Cre-ERT2 Usp7+/+ mouse versus a Cre-ERT2 Usp7fl/fl mouse from three independent experiments, with similar results obtained. (B) Quantitative RT-PCR of Gzma and Gzmb in Th2 cells from Cre-ERT2 Usp7+/+ and Cre-ERT2 Usp7fl/fl mice (n = 4 to 6 mice per group). (C) Representative plots of intracellular staining of granzymes A or B in Cre-ERT2 Usp7+/+ and Cre-ERT2 Usp7fl/fl Th2 cells (D) and pooled data showing the proportion of the indicated cytokine-producing Th2 cells in vitro (n = 4 mice per group from three independent experiments). (E) Representative plots of intracellular staining of IFN-γ, IL-4, IL-5, and IL-13 in Cre-ERT2 Usp7+/+ and Cre-ERT2 Usp7fl/fl Th2 cells (F) and pooled data showing the proportion of indicated cytokine-producing Th2 cells in vitro (n = 6 to 7 per group from six to seven independent experiments). (G) The expression of Gzma, Gzmb, Il5, Il13, and F2r in Cre-ERT2 Usp7+/+ and Cre-ERT2 Usp7fl/fl Th2 cells projected on a violin plot. (H) ssGSVA scores of THROMBIN ACTIVATED RECEPTOR SIGNALING PATHWAY (Upper) and CYTOKINE PRODUCTION (Lower) are projected on ridgeline plots in Cre-ERT2 Usp7+/+ and Cre-ERT2 Usp7fl/fl Th2 cells. (I) The proportion of each cluster of Cre-ERT2 Usp7+/+ and Cre-ERT2 Usp7fl/fl Th2 cells is shown. (J) Representative plots of intracellular staining of IL-5 and IL-13 in Cre-ERT2 Usp7+/+ Th2 cells and Cre-ERT2 Usp7fl/fl Th2 cells are shown (Upper). Naive CD4+ T cells from Cre-ERT2 Usp7+/+ and Cre-ERT2 Usp7fl/fl mice were cultured under Th2 conditions with recombinant granzyme A or B. Pooled data from three independent experiments are provided (Lower panels; n = 4 per group). Data represent the mean ± SD. **P < 0.01, ***P < 0.001; n.s., not significant; P-values were calculated by an unpaired t test (B, D, F, and J).
Fig. 4.
Fig. 4.
USP7 regulates granzyme A and B production via phosphorylation of STAT3 in Th2 cells. (A) With IL-4 stimulation and indicated time points, median fluorescence intensity (MFI) of phosphorylated STAT3 (pSTAT3) and phosphorylated STAT6 (pSTAT6) is shown. Six mice from three independent experiments were evaluated. (B) Cumulative normalized tag counts of STAT3 peaks in Th2 cells are plotted against ranked STAT3 binding. The normalized tag count presented is the average of two independent biological replicates. (C) Fold changes in STAT3 occupancy between Cre-ERT2 Usp7+/+ and Cre-ERT2 Usp7fl/fl Th2 cells at 1,542 individual peaks are plotted in order of increasing fold change (Cre-ERT2 Usp7fl/fl versus Cre-ERT2 Usp7+/+). Fold changes presented are the average of two independent biological replicates. (D) The comparison of ChIP-seq signals for STAT3 in the Gzma (Upper) or Gzmb (Lower) gene locus between Cre-ERT2 Usp7+/+ and Cre-ERT2 Usp7fl/fl Th2 cells (n = 2 per group). (E) The proportions of granzyme A- and B-producing Th2 cells from Stat3fl/fl (white) or CD4-Cre Stat3fl/fl (black) mice are shown (n = 3 to 4 per group). (F) The proportions of granzyme A- and B-producing Th2 cells in Cre-ERT2 Usp7+/+ Th2 cells transducing with retroviral vector encoding mock and Cre-ERT2 Usp7fl/fl Th2 cells transducing with retroviral vector encoding mock or constitutively active Stat3 (Stat3-C) are shown (n = 3 to 4 mice per group). Three independent experiments were performed with similar results. Data represent the mean ± SD. *P < 0.05, ***P < 0.001; n.s., not significant; P-values were calculated by an unpaired t test (E and F) or multiple t tests (A).
Fig. 5.
Fig. 5.
Usp7 or granzyme A and B deficiency resulted in the ameliorated pathology of antigen exposure-induced airway inflammation. (A–I) Wild-type (WT), Gzmafl/fl, and Cre-ERT2 Usp7fl/fl mice were immunized with house dust mite (HDM), followed by repeated exposure to HDM via intranasal administration for 2 wk, as indicated in SI Appendix, Fig. S4 A, D, and G. (A–C) Analyses of single-cell RNA-seq (scRNA-seq) data of Gata3-expressing Th2 cells from lungs of WT mice immunized and exposed to HDM. (A) Three gene expression clusters (1 to 3) projected onto UMAP of scRNA-seq libraries from Th2 cells were color-coded by unsupervised learning from two independent experiments. (B) A UMAP projection of Th2 cells with a pseudo-time trajectory analysis is shown. The plotting symbol for each cell is colored based on the pseudo-time. Cells that have infinite pseudo-time are shown in gray. (C) The relative expression of genes (rows) across cells (columns) is shown. (D) The absolute cell numbers of eosinophils (Eosi.), neutrophils (Neut.), lymphocytes (Lymp.), macrophages (Mac.), and total cells (Total) in bronchoalveolar lavage (BAL) fluid in Gzmafl/fl mice treated with saline (Gzmafl/fl 1×PBS) or Gzmafl/fl mice treated with HDM (Gzmafl/fl HDM) and Gzmafl/fl CD4-Cre mice treated with HDM and granzyme B inhibitor (CD4-Cre Gzmafl/fl/granzyme B inhibitor HDM). n = 7 mice (Gzmafl/fl 1×PBS), n = 9 mice (Gzmafl/fl HDM), and n = 9 mice (CD4-Cre Gzmafl/fl/granzyme B inhibitor HDM) from two independent experiments. (E and F) Representative lung histology stained with H&E (E) or PAS (F) is depicted. Scale bars indicate 100 μm. (G) Analyses of scRNA-seq data of Gata3-expressing Th2 cells from lung of Gzmafl/fl HDM and CD4-Cre Gzmafl/fl/granzyme B inhibitor HDM were performed. scRNA-seq data were reconstructed as a violin plot that shows the expression of Il5 or Il13 between Gzmafl/fl HDM and CD4-Cre Gzmafl/fl/granzyme B inhibitor HDM is indicated. (H) The absolute cell numbers of leukocytes in BAL fluid in Cre-ERT2 Usp7+/+ mice treated with saline (Cre-ERT2 Usp7+/+ PBS) or Cre-ERT2 Usp7fl/fl mice treated with saline (Cre-ERT2 Usp7fl/fl PBS) or Cre-ERT2 Usp7+/+ mice treated with HDM (Cre-ERT2 Usp7+/+ HDM) and Cre-ERT2 Usp7fl/fl mice treated with HDM (Cre-ERT2 Usp7fl/fl HDM). n = 4 mice (Cre-ERT2 Usp7+/+ PBS), n = 5 mice (Cre-ERT2 Usp7fl/fl PBS), n = 5 mice (Cre-ERT2 Usp7+/+ HDM), and n = 5 mice (Cre-ERT2 Usp7fl/fl HDM) from two independent experiments. (I) Lung resistance (RL) was assessed in response to increasing doses of methacholine. Four mice per group from two independent experiments were evaluated. (J and K) OVA-specific memory Th2 cells from Cre-ERT2 Usp7fl/fl OT-II Tg mice were transferred intravenously into C57BL/6 mice that were subsequently treated with saline or OVA exposure, as indicated in SI Appendix, Fig. S4K. (J) The absolute cell numbers of leukocytes in BAL fluid in Cre-ERT2 Usp7+/+ OT-II Tg mice treated with saline (Cre-ERT2 Usp7+/+ OT-II Tg PBS) or Cre-ERT2 Usp7fl/fl OT-II Tg mice treated with saline (Cre-ERT2 Usp7fl/fl OT-II Tg PBS) or Cre-ERT2 Usp7+/+ OT-II Tg mice treated with OVA (Cre-ERT2 Usp7+/+ OT-II Tg OVA) and Cre-ERT2 Usp7fl/fl OT-II Tg mice treated with OVA (Cre-ERT2 Usp7fl/fl OT-II Tg OVA). n = 5 mice (Cre-ERT2 Usp7+/+ OT-II Tg PBS), n = 5 mice (Cre-ERT2 Usp7fl/fl OT-II Tg PBS), n = 5 mice (Cre-ERT2 Usp7+/+ OT-II Tg OVA), and n = 5 mice (Cre-ERT2 Usp7fl/fl OT-II Tg OVA) from two independent experiments. (K) RL was assessed in response to increasing doses of methacholine. Five mice per group from more than two independent experiments were evaluated. Data represent the mean ± SD. *P < 0.05, **P < 0.01, ***P < 0.001; n.s., not significant; P-values were calculated by a two-way ANOVA (D, and H–K).
Fig. 6.
Fig. 6.
The granzyme-PAR-1 axis was crucial for the regulation of human pathogenic Th2 cell differentiation. (A) Four gene expression clusters projected on a UMAP of the single-cell RNA-seq (scRNA-seq) libraries from CD45RO+ memory CD4+ T cells from peripheral blood (PBMC) and the nasal polyps (Polyp) from four patients with eosinophilic chronic rhinosinusitis (ECRS) and colored according to the cellular subset, as indicated in SI Appendix, Fig. S5A, are shown. (B) Representative confocal micrograph of a nasal polyp from a patient with ECRS stained with anti-CD4 (red), anti-CD45RO (green), anti-PAR-1 (yellow), and DAPI (blue). Scale bars indicate 40 μm. (C) Three gene expression clusters (1 to 3) projected on a UMAP of human Th2 cells in CD45RO+ memory CD4+ T cells from ECRS patients and colored according to the cellular subset, as indicated in SI Appendix, Fig. S5E, are shown. (D) A UMAP projection of the Th2 cluster in CD45RO+ memory CD4+ T cells with the pseudo-time trajectory analysis is shown. The plotting symbol for each cell is colored based on the pseudo-time. (E) The expression of GZMA, GZMB, IL5, and IL13 projected on a UMAP (Left) together with a violin plot that shows the expression of the indicated gene between PBMC and Polyp (Right) is indicated. (F) Representative plots of intracellular staining of IL-5 and IL-13 in human Th2 cells, as indicated in SI Appendix, Fig. S5F, are shown. Naive CD4+ T cells were cultured under Th2 conditions with PBS (Control), granzyme A, or granzyme B (Left), and the proportion of IL-5- or IL-13-producing human Th2 cells (n = 3 per group) is shown (Right). Three independent experiments were performed with similar results. Data represent the mean ± SD. *P < 0.05; P-values were calculated by a one-way ANOVA (F).

References

    1. Nakayama T., et al. , Th2 cells in health and disease. Annu. Rev. Immunol. 35, 53–84 (2017). - PubMed
    1. Ruterbusch M., Pruner K. B., Shehata L., Pepper M., In vivo CD4(+) T cell differentiation and function: Revisiting the Th1/Th2 paradigm. Annu. Rev. Immunol. 38, 705–725 (2020). - PubMed
    1. Cabeza-Cabrerizo M., Cardoso A., Minutti C. M., Pereira da Costa M., Reis e Sousa C., Dendritic cells revisited. Annu. Rev. Immunol. 39, 131–166 (2021). - PubMed
    1. Xue Q., et al. , Analysis of single-cell cytokine secretion reveals a role for paracrine signaling in coordinating macrophage responses to TLR4 stimulation. Sci. Signal 8, ra59 (2015). - PMC - PubMed
    1. Tibbitt C. A., et al. , Single-cell RNA sequencing of the T helper cell response to house dust mites defines a distinct gene expression signature in airway Th2 cells. Immunity 51, 169–184.e165 (2019). - PubMed