Comment
. 2023 Dec 7;186(25):5569-5586.e21.
doi: 10.1016/j.cell.2023.10.024. Epub 2023 Nov 27.

TScan-II: A genome-scale platform for the de novo identification of CD4+ T cell epitopes

Affiliations
Comment

TScan-II: A genome-scale platform for the de novo identification of CD4+ T cell epitopes

Mohammad H Dezfulian et al. Cell. .

Abstract

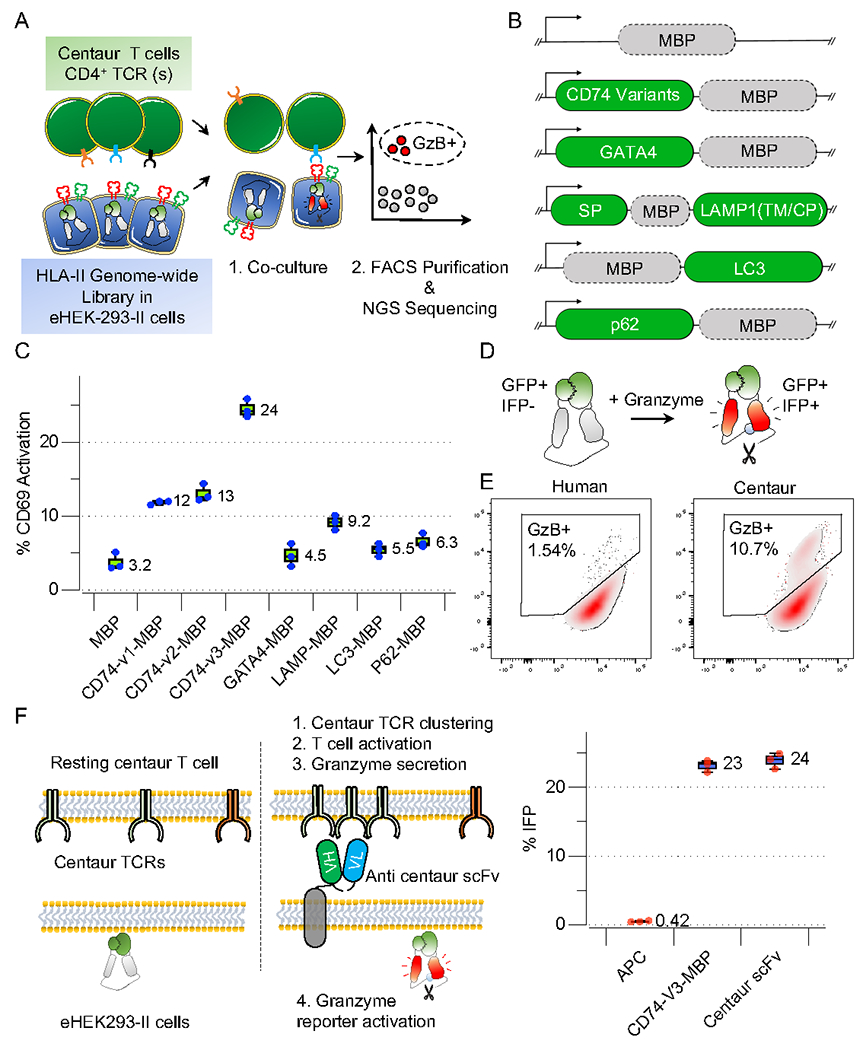
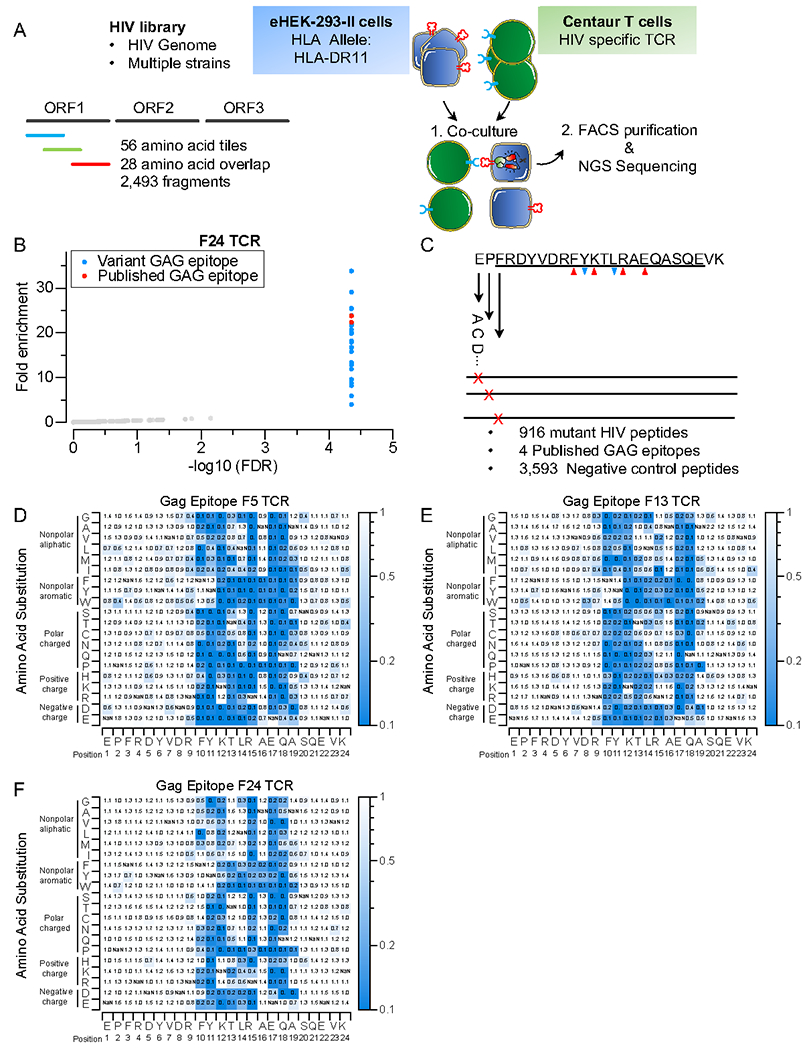
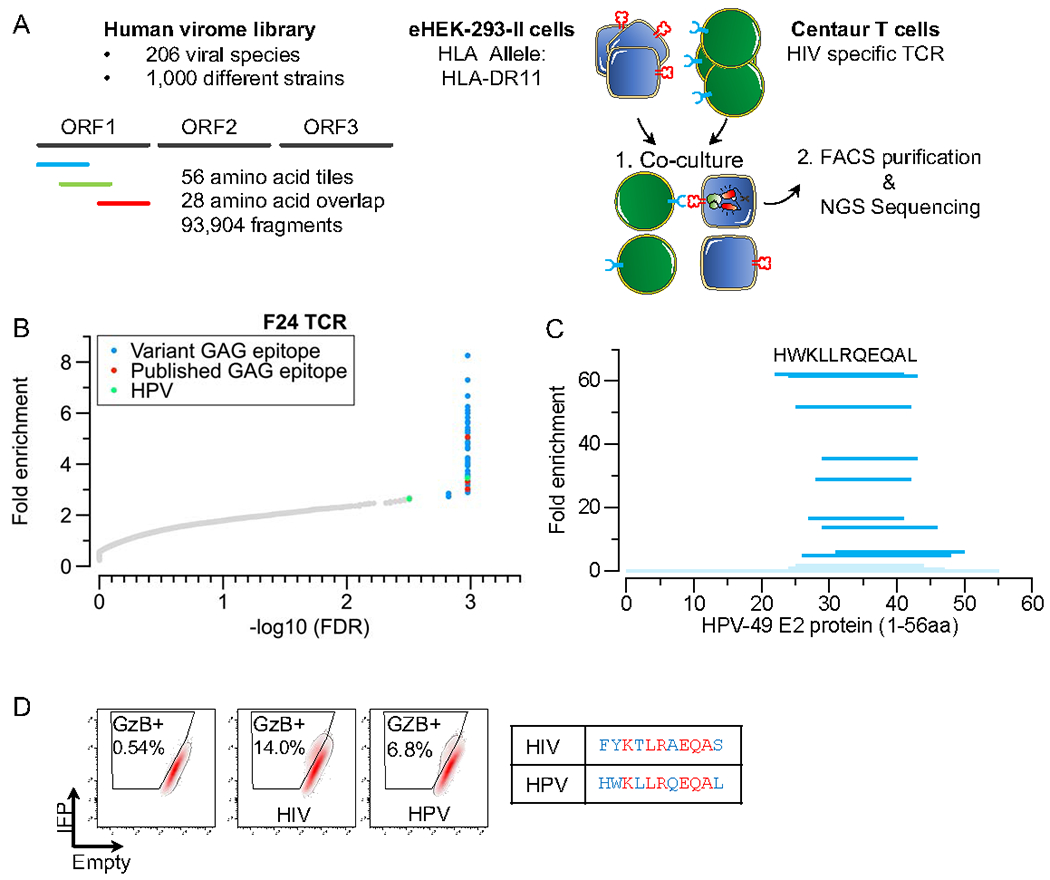
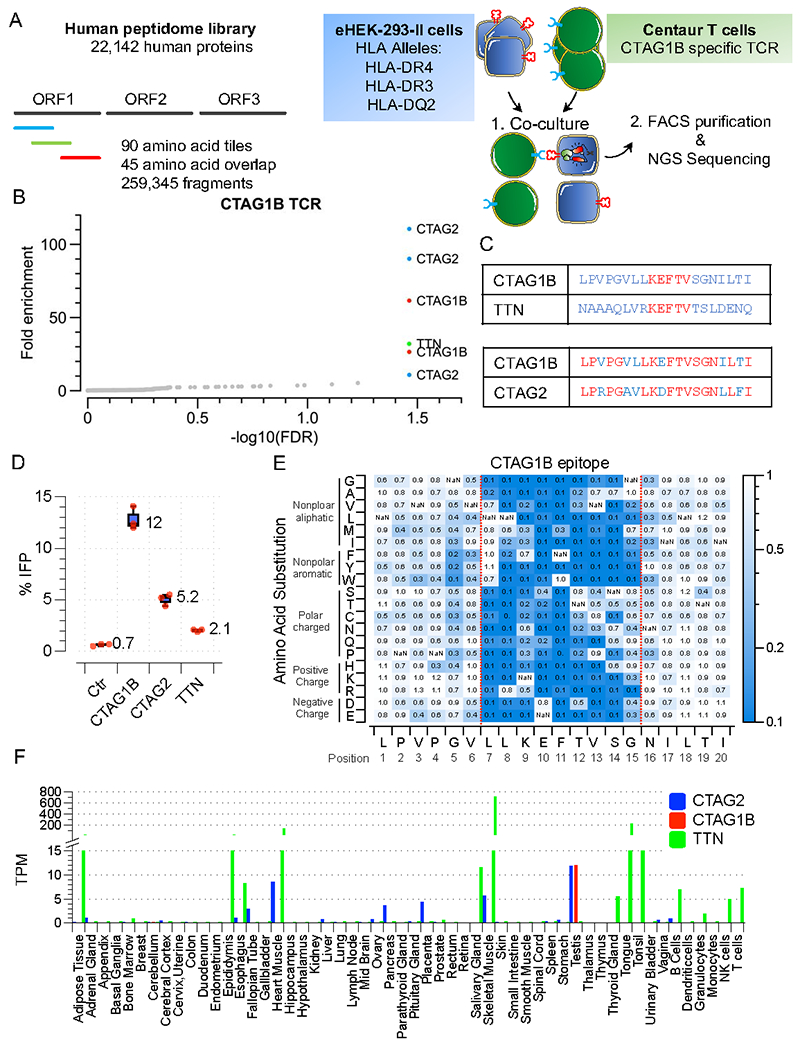
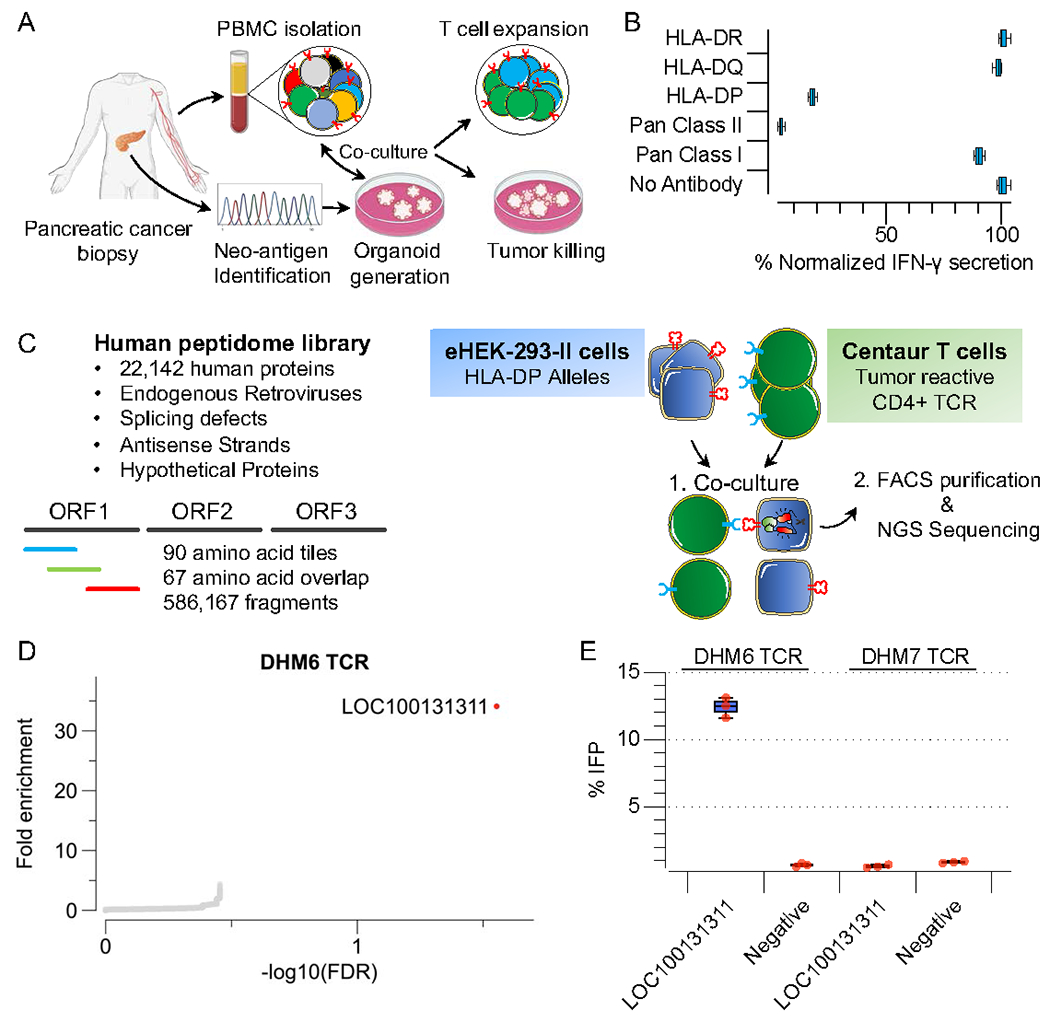
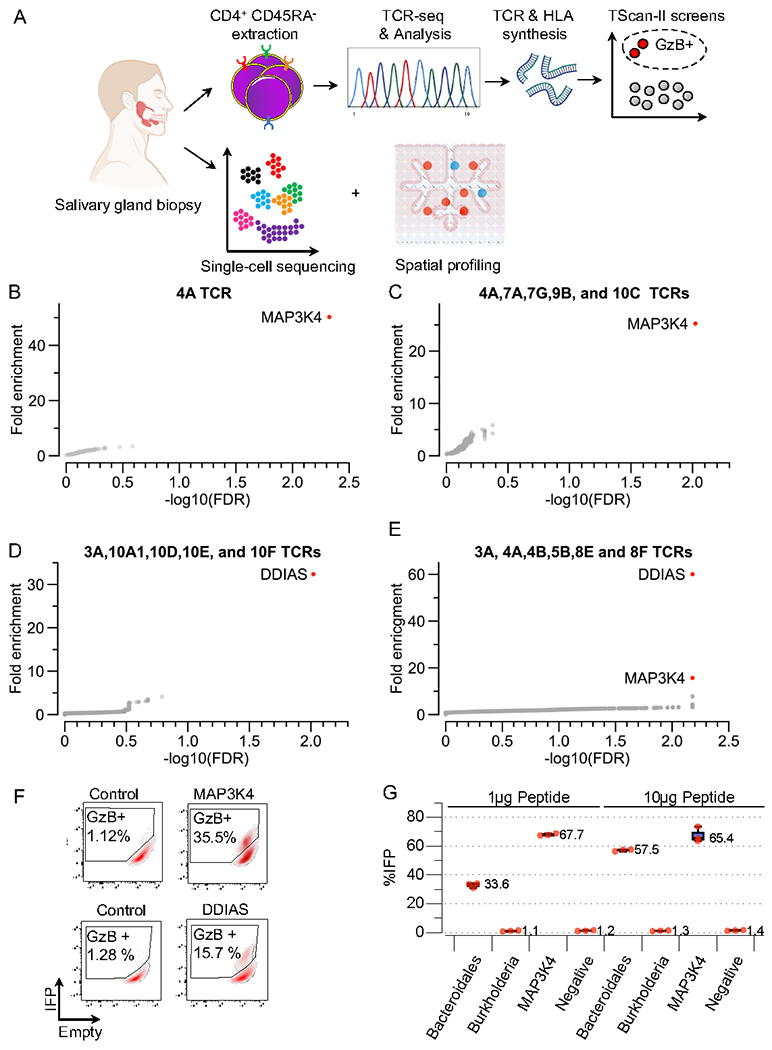
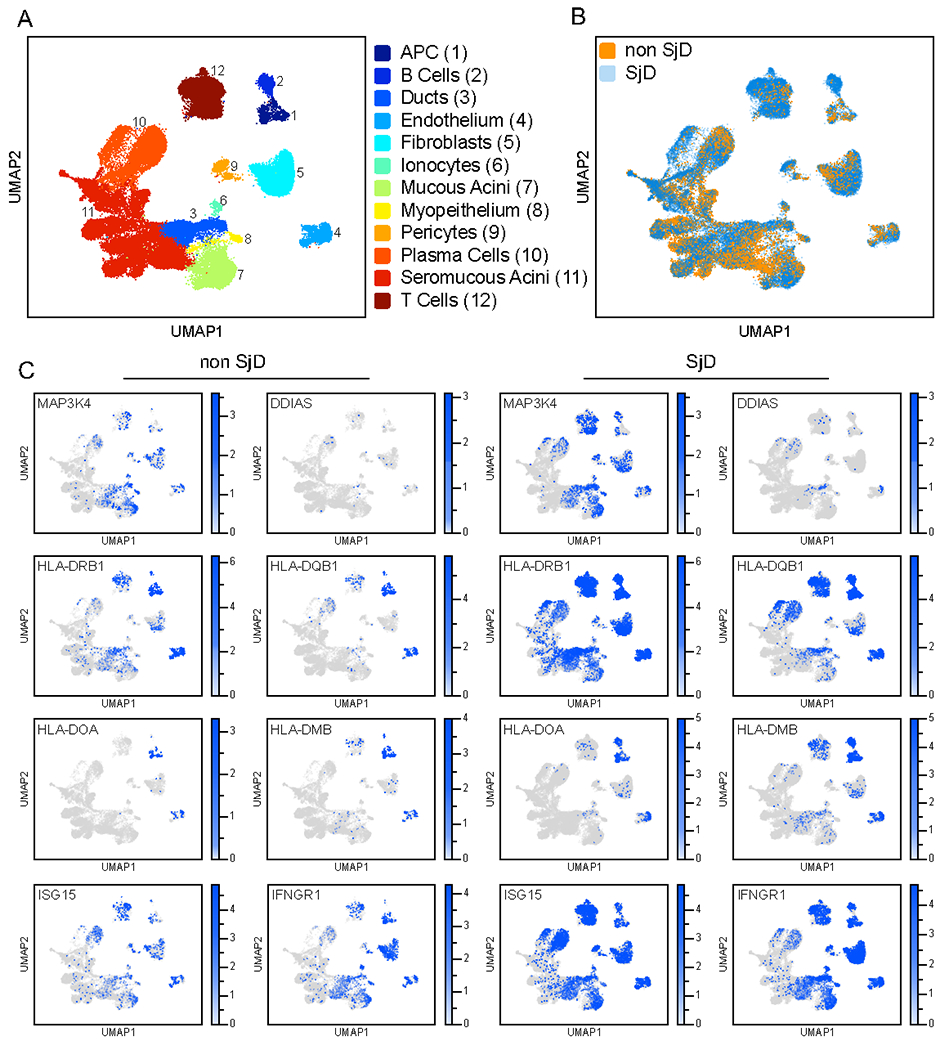
CD4+ T cells play fundamental roles in orchestrating immune responses and tissue homeostasis. However, our inability to associate peptide human leukocyte antigen class-II (HLA-II) complexes with their cognate T cell receptors (TCRs) in an unbiased manner has hampered our understanding of CD4+ T cell function and role in pathologies. Here, we introduce TScan-II, a highly sensitive genome-scale CD4+ antigen discovery platform. This platform seamlessly integrates the endogenous HLA-II antigen-processing machinery in synthetic antigen-presenting cells and TCR signaling in T cells, enabling the simultaneous screening of multiple HLAs and TCRs. Leveraging genome-scale human, virome, and epitope mutagenesis libraries, TScan-II facilitates de novo antigen discovery and deep exploration of TCR specificity. We demonstrate TScan-II's potential for basic and translational research by identifying a non-canonical antigen for a cancer-reactive CD4+ T cell clone. Additionally, we identified two antigens for clonally expanded CD4+ T cells in Sjögren's disease, which bind distinct HLAs and are expressed in HLA-II-positive ductal cells within affected salivary glands.

Keywords: CD4+ T cell; HIV; Pancreatic cancer; Sjögren’s disease; T cell epitope; T cell screening; antigen discovery; antigen library; epitope discovery; epitope mutagenesis.


Conflict of interest statement

Declaration of interests M.H.D., T.K., and S.J.E. are patent holders of the TScan-I and TScan-II technologies. T.K. is a co-founder of TScan Therapeutics and ImmuneID and serves on the Scientific Advisory Board of TScan Therapeutics. S.J.E. is a founder of TScan Therapeutics, ImmuneID, MAZE Therapeutics, and Mirimus. S.J.E. serves on the Scientific Advisory Board of TScan Therapeutics and Maze Therapeutics. In accordance with Partners HealthCare's conflict of interest policies, the Partners Office for Interactions with Industry has reviewed S.J.E.’s financial interest in TScan and determined that it creates no significant risk to the welfare of the participants in this study or to the integrity of the research.

Figures

Figure 1.
Figure 1.. Development of the TScan-II platform
A) Conceptual layout of the CD4+ antigen discovery platform. B) Schematic representation of fusion proteins developed to assess the presentation of full-length MBP fusions to CD74, GATA4, LAMP1 (SP: signal peptide, TM: transmembrane, CP: cytoplasmic), LC3, p62 on HLA-DRB1*1501. C) Boxplots depicting activation levels (CD69) of Ob1.A12 TCR transduced SKW-3 cells following 6 h co-culture with eHEK-293-II cells with endogenously expressed full-length MBP fusions. The box is drawn around the inner quartile range, and the whiskers show minimum to maximum values for all plots shown here and below. D) The GzB reporter is visually represented in a schematic, illustrating how GzB mediates the cleavage of the substrate sequence (VGPD→ŜGR) within IFPGZB-Hi. Cleavage leads to IFP fluorescence (red). E) FACS histograms depicting GzB reporter activation in eHEK-293-II following co-culture with centaur T-cells. Target eHEK-293-II cells co-express the HLA-DRB1*1501 allele and full-length MBP fused to CD74-v3. Primary T-cells express the unmodified (left panel) or centaur Ob1.A12 TCR and CD4 co-receptor (right panel). F) Frequency of eHEK-293-II cells that activate the GzB reporter in the presence of membrane-bound anti-centaur scFv or an endogenously processed full-length MBP fused to CD74-v3 following co-culture with Ob1.A12 centaur T-cells.
Figure 2.
Figure 2.. HIV genome-wide and Mutagenesis TScan-II screens
A) Schematic of TScan-II HIV genome-wide screen. The HIV library comprises 2,492 peptide fragments tiling across the genomes of multiple HIV strains in 56aa steps with 28aa overlap. B) TScan-II screen using an HIV elite controller TCR against the HIV library. Each dot represents one peptide. The y-axis shows the geometric mean of the fold-change across seven replicates for screens with HLA-DRB1*1101 and the GAG-specific TCR (F24). Red dots represent peptides, with an epitope identical to the published Gag epitope for this TCR, blue dots represent variant Gag epitopes. C) The GAGepitope saturation mutagenesis library. The library encodes 4 WT epitopes, 956 mutant Gag epitopes, and 3,593 negative controls. The downward blue arrows indicate anchor residues, while the upward red arrows indicate TCR-facing residues. D, E, and F) Heatmap representation of comprehensive mutagenesis analysis of GAG epitope using 3 HIV elite controller TCRs, F5 (D), F13 (E), and F24(F). The heatmap value represents this mutant’s relative enrichment compared to the published (Gag) epitope.
Figure 3
Figure 3. Virome-wide TScan-II screen.
A) Schematic of the TScan-II human virome screen. The human virome library comprises 93,904 56aa fragments collectively tiled across the human virome (206 viral species, > 1,000 strains), including multiple HIV strains. B) TScan-II screen of HIV elite controller F24 TCR with the virome library. Each dot represents one peptide, with the y-axis plotting the geometric mean of the fold-change across eight replicates against the HLA- DRB1*1101 allele. Red dots represent peptides with WT GAG epitope for this TCR; blue dots represent variant GAG epitopes, green dot represents a peptide from the HPV type 49. C) TScan-II screen of a library of 12, 15, 18, and 20 aa fragments tiled at 1 AA intervals across the 56mer antigenic segments of HPV. The length of each dark blue indicates the scoring segment of HPV. Fragments in light blue did not score. The sequence depicted represents the minimal epitope. D) FACS depicting reporter activation after a 6h co-culture with F24 T-cells. eHEK-293-II cells express the HLA-DRB1*1101 allele and a control peptide (left), HIV (middle), or HPV (right). Identical residues shared between the minimal HPV epitope and core GAG epitope are colored in red, while blue residues represent permitted amino acid substitutions based on Figure 2F.
Figure 4.
Figure 4.. Human genome-wide screening using NY-ESO-specific CD4+ TCR
A) Schematic of TScan-II human genome-wide screen. The human genome-wide v2 library comprises 259,345 antigens that tile across the entire human proteome in 90 aa fragments with 45 aa overlap. B) TScan-II Screen of CTAG1B CD4+ TCR (3598-2) against the human genome-wide v2 library. The eHEK-293-II cells express the HLA- DRB1*04, HLA-DRB1*03:01, and HLA-DQB1*02_HLA-DQA1*05 alleles. C) Predicted 20 aa epitopes from the enriched 90aa peptides. D) Validation of the identified antigens in target cells following 6 h co-culture with cells expressing CTAG1B TCR and eHEK-293-II cells expressing HLA- DRB1*04. E) Heatmap representation of comprehensive mutagenesis analysis of the CTAG1B epitope in HLA- HLA- DRB1*04 eHEK-293-II cells using CTAG1B specific TCR (3598-2). The mutant epitopes are expressed in the context of a 56 aa fragment. Heatmaps are as in Figure 2. F) Transcript expression levels for CTAG2, CTAG1B, and TTN from 61 human tissues based on data from three sources: HPA, GTEx, and FANTOM5. Bar graph with the y-axis plotting consensus normalized expression value (TPM, Transcripts Per Kilobase Million) and x-axis representing the multiple human tissues and blood cell types.
Figure 5
Figure 5. Characterization of a pancreatic reactive TCRs
A) Schematic of the experimental workflow to derive and characterize pancreatic cancer tumor-reactive T-cell clones. B) Characterizing tumor reactivity and HLA-II allele restriction of tumor-reactive TCRs using patient-derived organoids. Primary centaur T-cells were co-cultured with patient-derived organoids. IFN-γ secretion was used as a readout of T-cell activity. Pan-HLA Class I antibody (W6/32), Pan-HLA Class II antibody (Tu39), HLA-DR (L243), HLA-DP (B7/21), HLA-DQ (SPVL3) were used for blocking experiments. C) Schematic of TScan-II human genome-wide screen. The human peptidome v3 genome-wide library comprises 586,167 antigens that tile across the entire human proteome, alternative translational products, endogenous retroviruses, splicing defects, antisense strands, and hypothetical proteins in 90 aa fragments with 67 aa overlap. D) TScan-II screen of CD4+ TCR(DHM6) against the human peptidome v3 library and HLA-DP expressing library eHEK-293-II cells. E) Validation of the identified antigens in target cells using the GzB reporter following 6h co-culture with DHM6 transduced T-cells and indicated 90mers antigens.
Figure 6
Figure 6. Human genome-wide TScan-II screens of clonally expanded CD4+ T-cells in SjD
A) Schematic representation of the experimental workflow to characterize clonally expanded CD4+ T-cell clones in SjD patients. B-E) TScan-II screens were performed against the human genome-wide v2 library with eHEK-293-II cells expressing HLA-DRB1*04, HLA-DRB1*03:01, and HLA-DQB1*02_HLA-DQA1*05. B) Pooled TScan-II screen of 5 TCRs 4A,7A,7G,9B, and 10C C) TScan-II screen of 4A TCR. D) Pooled TScan-II screen using 5 TCRs 3A,10A1,10D,10E, and 10F. E) Pooled TScan-II using 6 TCRs 3A,4A,9C,8A,8B and 5B. F) FACS plots depicting activation of GzB reporter following a 6 h co-culture experiment with 3A and 4A centaur T-cells towards the indicated cognate antigens. G) Relative activation of the GzB reporter in cells pulsed with the indicated peptide fragment cocultured with 4A T-cells.
Figure 7.
Figure 7.. Single-cell expression profiling of CD4+ antigens and HLA-II machinery within the salivary gland
A) UMAP visualization of scRNA-seq data from dissociated SGs of healthy and SjD. Cells from minor SG from n = 6 subjects who did not fulfill ACR 2016 classification criteria and were otherwise healthy and n = 7 SjD subjects who fulfilled American College of Rheumatology Classification Criteria were integrated into a single object containing 12 clusters. Selective clusters are highlighted by their functional annotation. B) UMPA plot depicting the abundance of SG cells in non-SjD (Healthy) and SjD subjects overlaid on the UMAP plot depicted in A. C) Expression of various HLA-II marker genes and MAP3K4 and DDIAS among non-SjD and SjD patients overlaid on the UMAP plot depicted in A.

Comment on

References

    1. Flajnik MF, and Kasahara M (2010). Origin and evolution of the adaptive immune system: genetic events and selective pressures. Nat Rev Genet 11, 47–59. 10.1038/nrg2703. - DOI - PMC - PubMed
    1. Kula T, Dezfulian MH, Wang CI, Abdelfattah NS, Hartman ZC, Wucherpfennig KW, Lyerly HK, and Elledge SJ (2019). T-Scan: A Genome-wide Method for the Systematic Discovery of T Cell Epitopes. Cell 178, 1016–1028.e13. 10.1016/j.cell.2019.07.009. - DOI - PMC - PubMed
    1. Birnbaum ME, Mendoza JL, Sethi DK, Dong S, Glanville J, Dobbins J, Ozkan E, Davis MM, Wucherpfennig KW, and Garcia KC (2014). Deconstructing the peptide-MHC specificity of T cell recognition. Cell 157, 1073–1087. 10.1016/j.cell.2014.03.047. - DOI - PMC - PubMed
    1. Joglekar AV, and Li G (2020). T cell antigen discovery. Nature Methods. 10.1038/s41592-020-0867-z. - DOI - PubMed
    1. Sharma G, Rive CM, and Holt RA (2019). Rapid selection and identification of functional CD8+ T cell epitopes from large peptide-coding libraries. Nat Commun 10, 4553. 10.1038/s41467-019-12444-7. - DOI - PMC - PubMed

Publication types

LinkOut - more resources