. 2024 Feb 7;112(3):362-383.e15.
doi: 10.1016/j.neuron.2023.10.039. Epub 2023 Nov 27.

Longitudinal single-cell transcriptional dynamics throughout neurodegeneration in SCA1

Affiliations

Longitudinal single-cell transcriptional dynamics throughout neurodegeneration in SCA1

Leon Tejwani et al. Neuron. .

Abstract

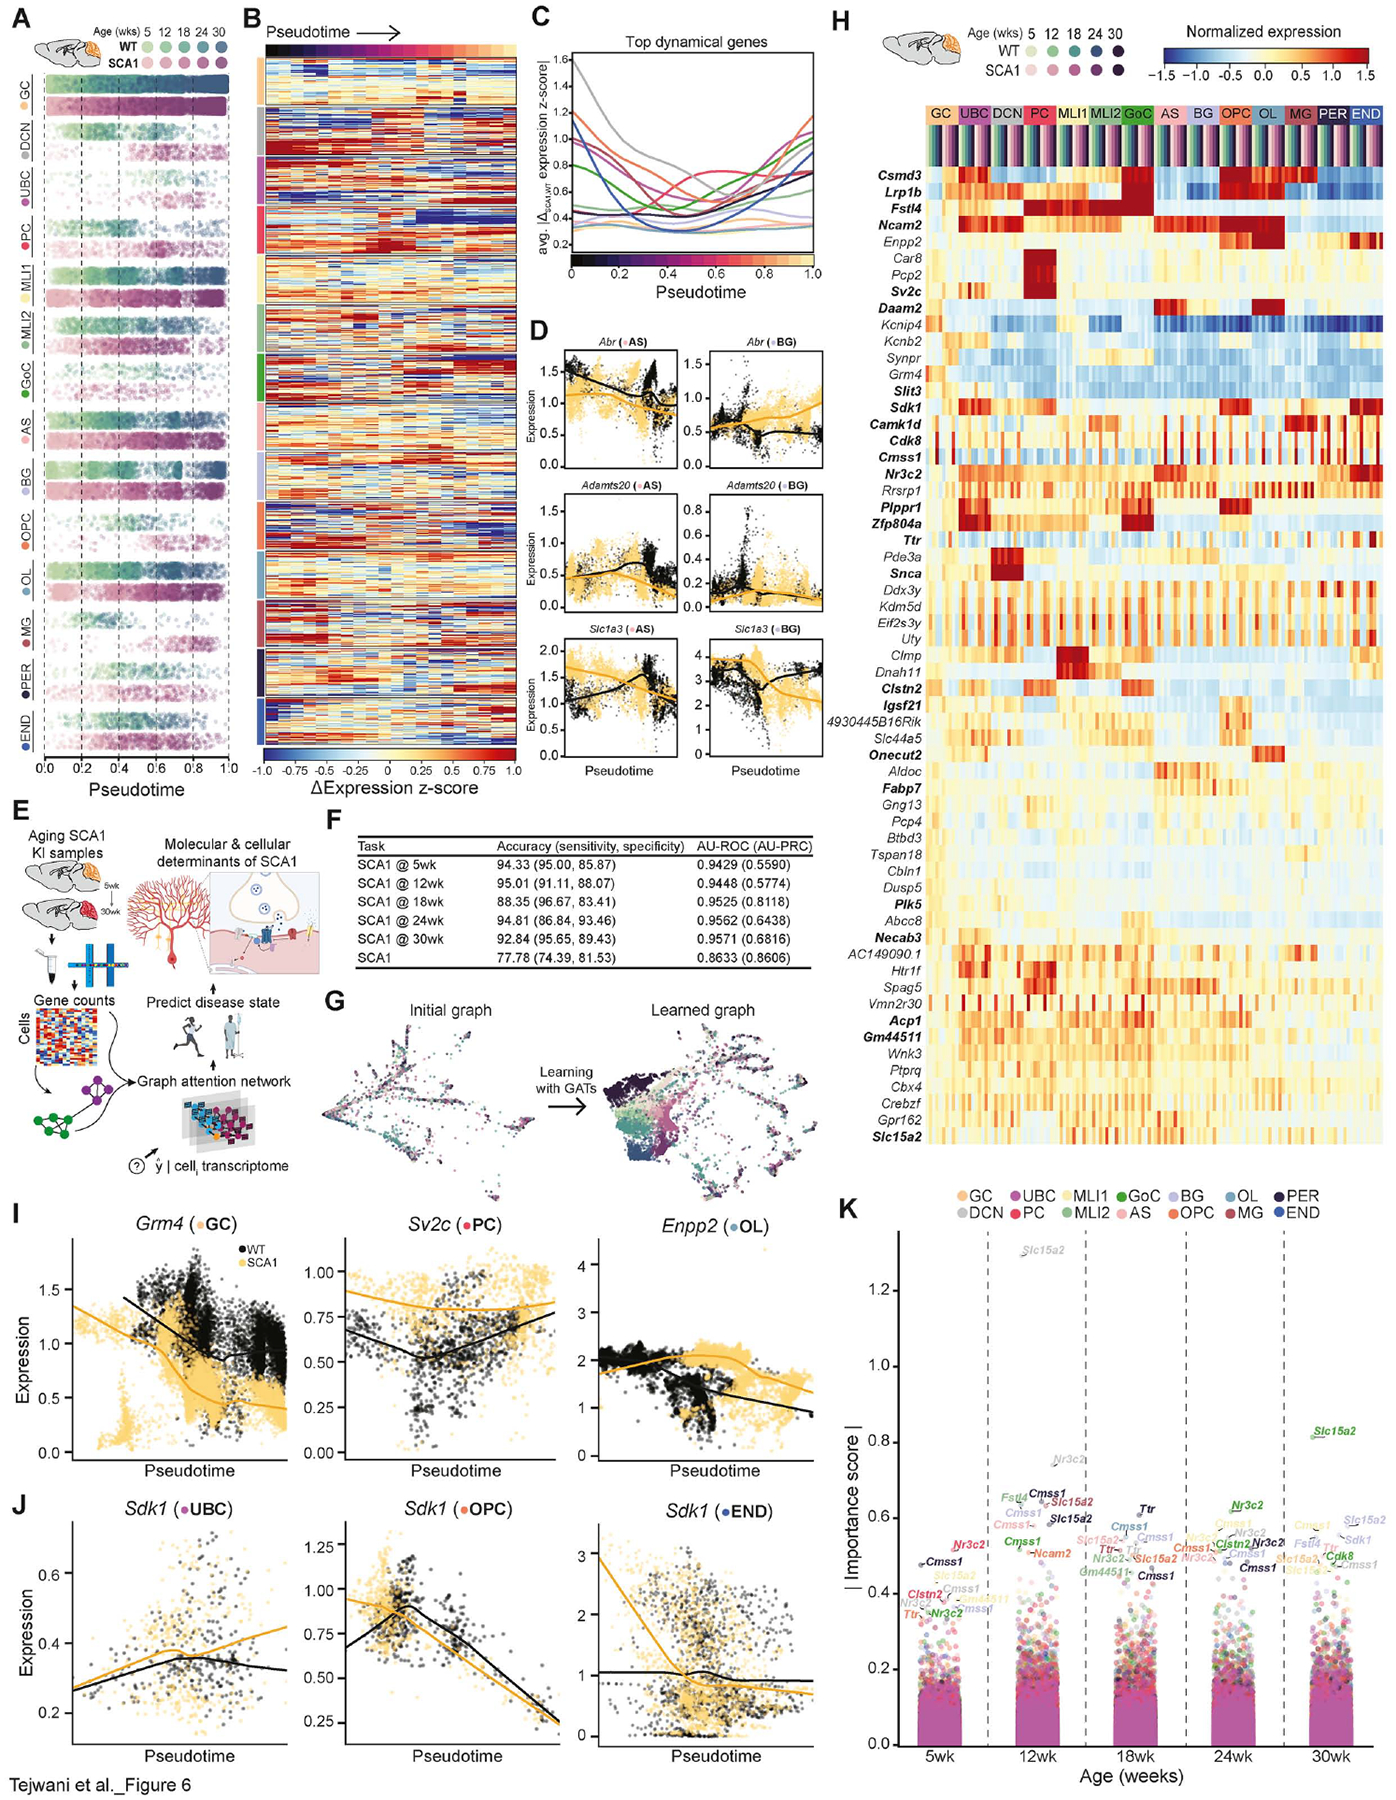
Neurodegeneration is a protracted process involving progressive changes in myriad cell types that ultimately results in the death of vulnerable neuronal populations. To dissect how individual cell types within a heterogeneous tissue contribute to the pathogenesis and progression of a neurodegenerative disorder, we performed longitudinal single-nucleus RNA sequencing of mouse and human spinocerebellar ataxia type 1 (SCA1) cerebellar tissue, establishing continuous dynamic trajectories of each cell population. Importantly, we defined the precise transcriptional changes that precede loss of Purkinje cells and, for the first time, identified robust early transcriptional dysregulation in unipolar brush cells and oligodendroglia. Finally, we applied a deep learning method to predict disease state accurately and identified specific features that enable accurate distinction of wild-type and SCA1 cells. Together, this work reveals new roles for diverse cerebellar cell types in SCA1 and provides a generalizable analysis framework for studying neurodegeneration.

Keywords: Purkinje cell; SCA1; ataxin-1; machine learning; neurodegeneration; oligodendrocyte; oligodendrocyte progenitor cell; single-nucleus RNA sequencing; spinocerebellar ataxia type 1; unipolar brush cells.


Conflict of interest statement

Declaration of interests S.W. is an inventor on a patent applied for by Harvard University related to MERFISH and a consultant and shareholder of Translura, Inc.

Figures

Figure 1.
Figure 1.. Single-cell transcriptional profiling of the SCA1 human and mouse cerebellum.
(A) Schematic pipeline of SCA1 snRNA-seq and analysis of human post-mortem (n=20 human) and mouse (n=30 mice) cerebellum. (B and C) UMAP embeddings of 237,554 human (B) and 313,447 mouse (C) single-nucleus transcriptomes. Nuclei from 20 human post-mortem (CTRL, n=10; SCA1, n=10) and 30 mouse (WT, n=3; SCA1, n=3 per timepoint; timepoints= 5, 12, 18, 24, 30 weeks) tissues were sequenced. (D and E) Normalized violin plots showing expression of cell type-specific marker genes for each human (D) and mouse (E) cluster used for cell type annotation. (F and G) Relative proportions of each cell type within each genotype for the human (F) and mouse (G) datasets. (H) Dot plot displaying mean scaled expression of previously reported effectors of SCA1 toxicity (rows) in WT mouse cerebellar cell types (columns) averaged over time. (I) Heatmap displaying mean expression profiles of 238 ataxin-1 physical interactors (rows) in WT mouse cerebellar cell types (columns) averaged over time. (J and K) Number of down-regulated, up-regulated, and total differentially expressed genes (DEGs) in the human (J) and mouse (K) snRNA-seq datasets. See also Figures S1–S7, and Tables S1–S10.
Figure 2.
Figure 2.. SCA1 Purkinje cell dynamics over time.
(A) Heatmap of relative normalized expression for DEGs in mouse PCs over time. (B and C) Smoothed histograms displaying time-dependent alterations in distribution of normalized gene expression for selected genes that are down-regulated (B) and up-regulated (C) in SCA1 mouse PCs. (D) Heatmap of significantly enriched pathways in the PC population over time. (E) Western blots validating time-dependent changes of several PC-enriched genes/proteins in the SCA1 KI mouse cerebellum (WT, n=4; SCA1, n=4 mice per timepoint). The target band for Prkg1 is denoted with a closed arrow and a non-specific band with an open arrowhead. For quantification data, target expression was normalized to a loading control (vinculin) and then to the average of WT mice at each timepoint. (F) Representative images of detected RNA foci of PC markers from MERFISH analysis of the WT and SCA1 KI cerebellum of 18 week mice. (G and H) Representative images of detected RNA foci (G) and smoothed histograms (H) displaying differential expression of selected up- and down-regulated genes in PCs of the 18 week WT and SCA1 cerebellum, as determined using MERFISH. Data presented in (E) are mean±s.e.m. Student’s t-tests were performed to compare genotypes within each timepoint. *P<0.05, **P<0.01, ***P<0.001. See also Figures S8–S12, and Tables S11–S13.
Figure 3.
Figure 3.. Analysis of Purkinje cell subpopulations in SCA1.
(A and B) UMAP embeddings displaying five major subclusters (A) and genotypes (B) of mouse PCs. (C) Relative proportions of each PC subcluster aggregated over time in the WT and SCA1 mouse cerebellum snRNA-seq dataset. (D) Heatmap of non-imputed expression z-score for the top 20 marker genes for each of the five PC subclusters. (E) Dot plots displaying non-imputed relative expression of selected marker genes for each of the five PC subclusters. (F and G) UMAP embeddings displaying non-imputed expression of Aldoc and Kctd16 (F) and zebrin II (Aldoc)-subcluster assignment of mouse PCs (G). (H) Dot plots displaying non-imputed expression of DEGs in Aldoc+ and Aldoc PC subpopulations averaged over time. (I) Representative smFISH images acquired with identical intensity parameters for detection of Aldoc RNA foci showing distinct Aldoc+ and Aldoc PC populations in the 18-week WT cerebellum. (J-M) Representative images of detected RNA foci (J,L) and smoothed histograms (K,M) showing differential expression between genotypes in 18-week Aldoc+ (J,K) or Aldoc (L,M) PCs. See also Figure S13, and Table S14.
Figure 4.
Figure 4.. Oligodendrocyte impairments and myelin deficits in SCAs.
(A) Gene ontology (biological process) analysis of total, down-regulated, and up-regulated DEGs in human OL cluster. Top five pathways with the highest fold enrichment for each gene set are displayed. (B) Volcano plot displaying DEGs of the human OL cluster. (C) Smoothed histograms displaying distribution of expression of major myelin protein-encoding transcripts in the human OL cluster, showing significant decreases in SCA1. (D and E) Validation of myelin protein reduction in the SCA1, SCA3, and SCA6 human post-mortem cerebellar cortex relative to controls (CTRL) (CTRL, n=3; SCA1, n=3; SCA3, n=5; SCA6, n=1 patient). (F and G) Immunohistochemistry (F) and quantification (G) of OL number (i.e. opalin+ cells) and myelination (MBP+ staining) in the granule cell layer (GCL) of the human post-mortem cerebellar cortex (CTRL, n=10; SCA1, n=10 patients). Opalin, scale bar=100μm. MBP, scale bar=100μm. (H) Heatmap of significantly differentially expressed OPC/OL genes from bulk RNA sequencing of the 12-week WT and SCA1 KI mouse cerebellum (WT, n=3; SCA1, n=3 mice). (I and J) Western blots confirming myelin protein reduction in the 12-week SCA1 KI mouse cerebellum (WT, n=3; SCA1, n=3 mice). (K-M) Transmission electron microscopy of PC axons from the 13-week WT and SCA1 KI mouse cerebellum (K) revealed a reduction in percentage of myelinated PC axons (L) and increased g-ratio (M) in SCA1 KI mice. Scale bar=2μm. Red asterisks indicate nonmyelinated axons. For bar plots, data are mean±s.e.m. The following statistical tests were used: Student’s t-tests to compare across genotypes for (G, J, and L); one-way ANOVA with multiple comparisons to compare across genotypes for (E). *P<0.05, **P<0.01, ***P<0.001, ****P<0.0001. See also Figures S14 and S15, and Table S15.
Figure 5.
Figure 5.. SCA1 OPCs undergo a cell autonomous differentiation block.
(A) PHATE embedding of human oligodendroglia lineage (OPC+OL clusters). (B-D) Immunohistochemistry (B) and quantification of total oligodendroglia number (C; Olig2+; WT, n=6; SCA1, n=6 mice) and relative OPC and OL proportions (D; Olig2+Plp1-EGFP and Olig2+Plp1-EGFP+, respectively; WT, n=3; SCA1, n=3 mice) in the cerebellum of the 12-week WT and SCA1 KI mice. Scale bar=100μm. (E) Representative transmission electron microscopy images of myelinated PC axons from 15-week WT and SCA1 B05 mouse cerebellum. Scale bar=2μm. (F-H) Quantification of g-ratio from 15-week WT and SCA1 B05 mice (F and G) and 13-week WT and SCA1 KI animals (H) (WT, n=351; SCA1 B05, n=441 axons from 2 animals per genotype; WT, n=660; SCA1 KI, n=716 axons from 3 animals per genotype). (I) Schematic of primary OPC isolation and in vitro differentiation into OLs. (J and K) qRT-PCR for OPC (J) and OL (K) marker genes in primary OLs differentiated in vitro for 17 days (WT, n=3; SCA1, n=3 animals). For bar plots, data presented are mean±s.e.m. The following statistical tests were used: Student’s t-tests to compare across genotypes for (C,D,G,H,J and K). *P<0.05, **P<0.01, ****P<0.0001. See also Figure S16.
Figure 6.
Figure 6.. Cell trajectories and deep learning to predict disease state and progression.
(A) Pseudotemporal ordering of mouse time-series data using MELD to generate continuous progressions for each cell type cluster. (B) Heatmap displaying ΔSCA1-WT expression z-score for top 100 WT and SCA1 dynamical genes within each cell type over pseudotime. (C) Average |Δexpression| between genotypes of the top 100 WT and SCA1 dynamical genes within each cell type over pseudotime to highlight timing of each cell type’s dysregulation. Expression was represented as z-score to standardize the displayed units. (D) Expression dynamics of select dynamical genes over pseudotime show differential patterns between AS (left) and BG (right) clusters. (E) Schematic overview of approach using geometric deep learning on snRNA-seq data to predict disease state at single-cell resolution to gain insights into pathophysiology. (F) Performance and evaluation of each model on the test set across 6 binary classification tasks. (G) PHATE embeddings of test set cells based on the original cell-similarity graph (left), which served as input to each GAT model, and the graph learned by one of the attention heads in the GAT model discriminating between genotypes (right). (H) Heatmap of z-score of mean expression of top 20 salient protein-coding genes per attention head in the five binary classification tasks predicting SCA1 at various timepoints. (I and J) Expression dynamics of select salient genes from (H) over pseudotime shows that the GAT model pays attention to genes that are highly differentially expressed between genotypes (I), as well as genes with more nuanced patterns of differential expression (J). (K) Importance scores for each gene across various cellular subsets. Importance was calculated by computing Integrated Gradients for the average expression of each cell subset across the test set, relative to a baseline of no expression. The top 10 important protein-coding genes for each timepoint are labeled. Bolded genes in (H and K) are salient/important for both the GAT and Integrated Gradient approaches. See also Figures S17–S19, and Tables S16–S18.

References

    1. Orr HT, Chung MY, Banfi S, Kwiatkowski TJ Jr., Servadio A, Beaudet AL, McCall AE, Duvick LA, Ranum LP, and Zoghbi HY (1993). Expansion of an unstable trinucleotide CAG repeat in spinocerebellar ataxia type 1. Nat Genet 4, 221–226. 10.1038/ng0793-221. - DOI - PubMed
    1. Servadio A, Koshy B, Armstrong D, Antalffy B, Orr HT, and Zoghbi HY (1995). Expression analysis of the ataxin-1 protein in tissues from normal and spinocerebellar ataxia type 1 individuals. Nat Genet 10, 94–98. 10.1038/ng0595-94. - DOI - PubMed
    1. Koeppen AH (2005). The pathogenesis of spinocerebellar ataxia. Cerebellum 4, 62–73. 10.1080/14734220510007950. - DOI - PubMed
    1. Watase K, Weeber EJ, Xu B, Antalffy B, Yuva-Paylor L, Hashimoto K, Kano M, Atkinson R, Sun Y, Armstrong DL, et al. (2002). A Long CAG Repeat in the Mouse Sca1 Locus Replicates SCA1 Features and Reveals the Impact of Protein Solubility on Selective Neurodegeneration. Neuron 34, 905–919. 10.1016/s0896-6273(02)00733-x. - DOI - PubMed
    1. Edamakanti CR, Do J, Didonna A, Martina M, and Opal P (2018). Mutant ataxin1 disrupts cerebellar development in spinocerebellar ataxia type 1. Journal of Clinical Investigation 128, 2252–2265. 10.1172/jci96765. - DOI - PMC - PubMed