. 2023 Nov 28;11(11):e007847.
doi: 10.1136/jitc-2023-007847.

High-dimensional single-cell proteomics analysis of esophageal squamous cell carcinoma reveals dynamic alterations of the tumor immune microenvironment after neoadjuvant therapy

Affiliations

High-dimensional single-cell proteomics analysis of esophageal squamous cell carcinoma reveals dynamic alterations of the tumor immune microenvironment after neoadjuvant therapy

Dingpei Han et al. J Immunother Cancer. .

Abstract

Background: Dynamic alterations of the tumor immune microenvironment in esophageal squamous cell carcinoma (ESCC) after different neoadjuvant therapies were understudied.

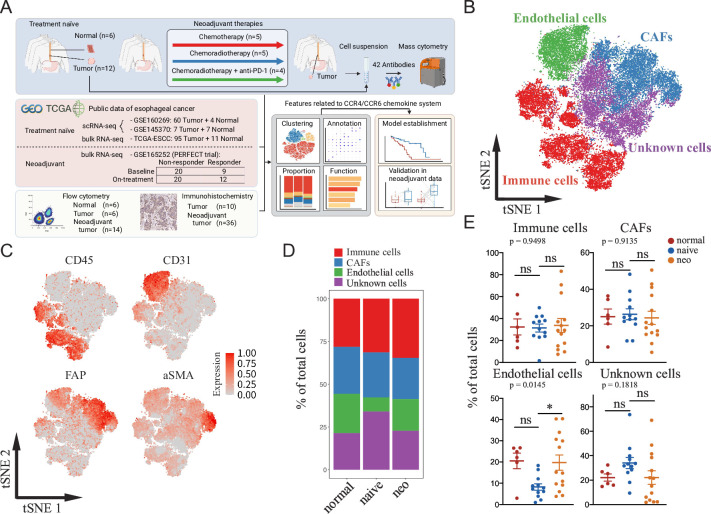
Methods: We used mass cytometry with a 42-antibody panel for 6 adjacent normal esophageal mucosa and 26 tumor samples (treatment-naïve, n=12; postneoadjuvant, n=14) from patients with ESCC. Single-cell RNA sequencing of previous studies and bulk RNA sequencing from The Cancer Genome Atlas were analyzed, flow cytometry, immunohistochemistry, and immunofluorescence analyses were performed.

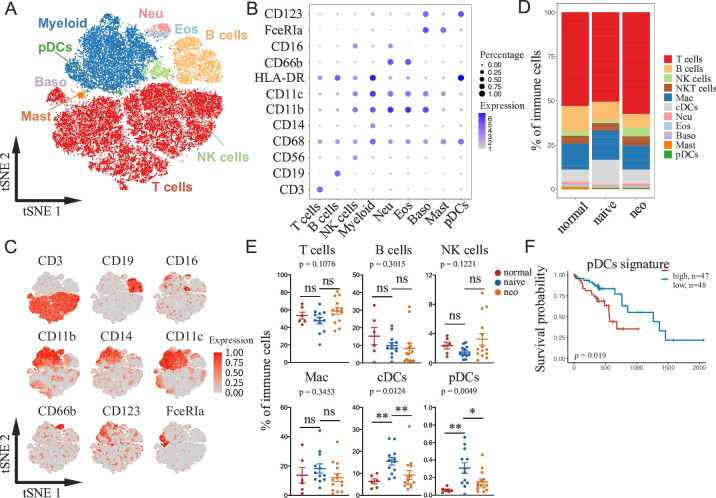
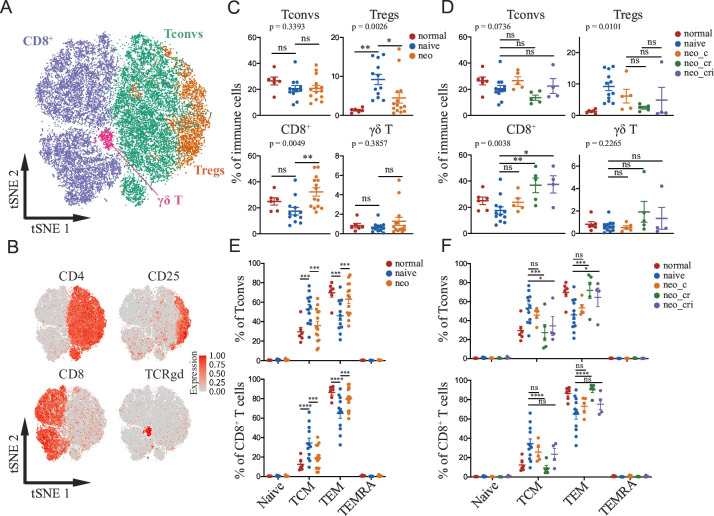
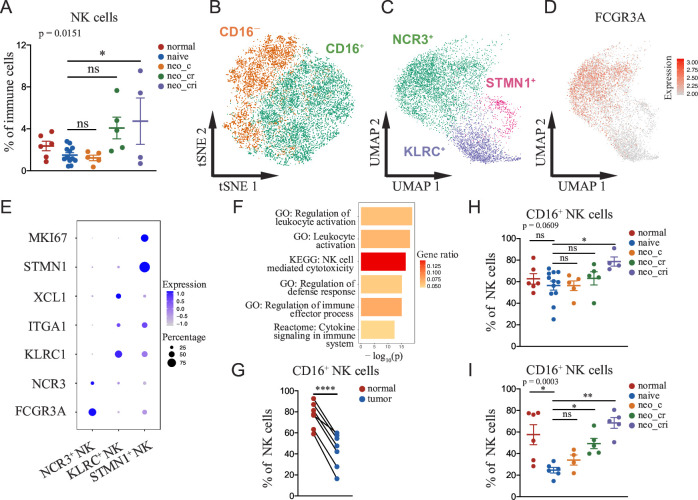
Results: Poor tumor regression was observed in the neoadjuvant chemotherapy group. Radiotherapy-based regimens enhanced CD8+ T cells but diminished regulatory T cells and promoted the ratio of effector memory to central memory T cells. Immune checkpoint blockade augmented NK cell activation and cytotoxicity by increasing the frequency of CD16+ NK cells. We discovered a novel CCR4+CCR6+ macrophage subset that correlated with the enrichment of corresponding chemokines (CCL3/CCL5/CCL17/CCL20/CCL22). We established a CCR4/CCR6 chemokine-based model that stratified ESCC patients with differential overall survival and responsiveness to neoadjuvant chemoradiotherapy combined with immunotherapy, which was validated in two independent cohorts of esophageal cancer with neoadjuvant treatment.

Conclusions: This work reveals that neoadjuvant therapy significantly regulates the cellular composition of the tumor immune microenvironment in ESCC and proposes a potential model of CCR4/CCR6 system to predict the benefits from neoadjuvant chemoradiotherapy combined with immunotherapy.

Keywords: Immune Checkpoint Inhibitors; Radiotherapy; Tumor Biomarkers; Tumor Microenvironment.


Conflict of interest statement

Competing interests: HWMvL reports research funding and/or medication supply from Bristol-Myers Squibb, Bayer Schering Pharma, Celgene, Janssen-Cilag, Lilly, Nordic Pharma, Philips Healthcare, Roche, Merck Sharp and Dohme, Servier, Incyte, and consultant/advisory board members for Lilly, Nordic Pharma, Bristol-Myers Squibb, Dragonfly, Merck Sharp and Dohme, Servier, outside the submitted work. The remaining authors have declared no conflicts of interest.

Figures

Figure 1
Figure 1
Experiment overview and single-cell annotation of esophageal squamous cell carcinoma revealed by mass cytometry. (A) Study schema (created with BioRender.com). (B) t-SNE plot of single cells colored by major cell types. (C) t-SNE plots demonstrating the expression of marker genes, CD45, CD31, FAP and αSMA. (D) Frequency of major cell types in normal, naïve and neo groups. (E) Box plots showing the proportion of immune cells, CAFs, endothelial cells and unknown cells among normal, naïve and neo groups. P values were derived from one-way ANOVA, Tukey’s test; *p<0.05. Error bars: mean±SEM. ANOVA, analysis of variance; CAFs, cancer-associated fibroblasts; scRNA-seq, single-cell RNA-sequencing.
Figure 2
Figure 2
Characterization of immune cell clusters in ESCC revealing decreased dendritic cell percentage by neoadjuvant therapies. (A) t-SNE plot of immune cells colored by major immune cell types. (B) Dotplot showing the expression of marker genes that define each immune cell type. (C) t-SNE plots demonstrating the expression of marker genes, CD3, CD19, CD16, CD11b, CD14, CD11c, CD66b, CD123 and FceRIa. (D) Frequency of immune cell types in normal, naïve and neo groups. (E) Box plots illustrating the proportion of T cells, B cells, NK cells, macrophages, cDCs and pDCs among normal, naïve and neo groups. (F) Kaplan-Meier survival curves for overall survival of the ESCC patients in TCGA database according to the gene signatures of pDCs. P values in (E) were derived from one-way ANOVA, Tukey’s test; *p<0.05, **p<0.01. Error bars: mean±SEM. P values in (F) were derived from log-rank test. Baso, basophils; cDCs, conventional dendritic cells; Eos, eosinophils; Mac, macrophages; Mast, mast cell; Myeloid, myeloid cells; Neu, neutrophils; pDCs, plasmacytoid dendritic cells
Figure 3
Figure 3
Neoadjuvant therapies strengthening the anti-tumor immune responses of T cells. (A) t-SNE plot of T cells colored by T cell lineages. (B) t-SNE plots of T cells showing the expression of marker genes, CD4, CD25, CD8, TCRgd. Box plots illustrating the proportion of Tconvs, Tregs, CD8+ T cells and γδ T cells among (C) normal, naïve and neo groups and among (D) normal, naïve, neo-c, neo-cr and neo-cri groups. Box plots showing the percentage of naïve, TCM, TEM and TEMRA relative to the total number of Tconvs or CD8+ T cells among (E) normal, naïve and neo groups and among (F) normal, naïve, neo-c, neo-cr and neo-cri groups. P values were derived from one-way ANOVA, Tukey’s test; *p<0.05, **p<0.01, ***p<0.001, ****p<0.0001. Error bars: mean±SEM. Tconvs, conventional CD4+ T cells; Tregs, regulatory T cells; TCM, central memory T cells; TEM, effector memory T cells; TEMRA, terminally differentiated effector memory T cells.
Figure 4
Figure 4
Neoadjuvant ICB combined with chemoradiotherapy enhancing the activation and cytotoxicity of NK cells. (A) Box plot showing the proportion of NK cells among normal, naïve, neo-c, neo-cr, and neo-cri groups. (B) t-SNE plot of NK cells colored by NK cell clusters. (C) UMAP plot of NK cells colored by NK cell clusters reanalyzed using the GSE145370 dataset. (D) UMAP plot showing the expression of FCGR3A in different subsets of NK cells from the GSE145370 dataset. (E) Dotplot illustrating the expression of marker genes of different NK cell clusters reanalyzed using the GSE145370 dataset. (F) Pathway enrichment analysis of upregulated genes in CD16+ NK cells using scRNA-seq data from the GSE145370 dataset. (G) Scatter plot demonstrating the proportion of CD16+ NK cell subset divided by the total NK cell number derived from the GSE145370 dataset. Box plots showing the frequency of CD16+ NK cell subset relative to the total NK cell number among normal, naïve, neo-c, neo-cr and neo-cri groups, demonstrated by (H) CyTOF and (I) flow cytometry analysis. P values in (A, H and I) were derived from one-way ANOVA, Tukey’s test; p values in (G) were derived from two-sided paired Student’s t-test; *p<0.05; **p<0.01; ****p<0.0001. Error bars: mean±SEM. ANOVA, analysis of variance; UMAP, uniform manifold approximation and projection
Figure 5
Figure 5
CCR4 and CCR6 centered signaling in ESCC reshaped by the neoadjuvant therapies. (A) t-SNE plot of macrophages demonstrating the coexpression pattern of CCR4 and CCR6. (B) Multiplex immunofluorescence showed the presence of CD68+CCR4+CCR6+ macrophages. (C) Box plots illustrating the proportion of CCR4+CCR6+ macrophages among normal, naïve and neo groups. (D) Heatmap showing the chemokine production of CCL3, CCL5, CCL17, CCL20, and CCL22 between normal esophageal mucosae and ESCC tumors detected by chemokine antibody array. (E) Box plots showing the expression levels of CCL3, CCL5, CCL17, CCL20, and CCL22 between normal esophageal mucosae and ESCC tumors from the TCGA ESCC dataset. Scatter plots comparing the H-score of CCL3, CCL5, CCL17, CCL20, CCL22, CCR4, and CCR6 between tumor regression grade (TRG) 0/1 and TRG 2/3 patients in (F) neo_cr and (G) neo_cri group. P values in (C) were derived from one-way ANOVA, Tukey’s test; p values in (E–G) were derived from two-sided unpaired Student’s t-test; *p<0.05, **p<0.01, ***p<0.001, ****p<0.0001. Error bars: mean±SEM. ANOVA, analysis of variance; ESCC, esophageal squamous cell carcinoma; TCGA, The Cancer Genome Atlas.
Figure 6
Figure 6
CCR4/CCR6 chemokine-based model predicting the response to the neoadjuvant therapies of ESCC. (A) Kaplan-Meier survival curves for overall survival of the ESCC patients in TCGA database according to CCR4/CCR6 chemokine system. (B) Ridge coefficient profiles of seven genes related to CCR4/CCR6 chemokine system. (C) The optimal penalization coefficient (λ) using fivefold cross-validation based on partial likelihood deviance. (D) Kaplan-Meier survival curve for overall survival of the ESCC patients in TCGA database according to the model signature established by Ridge-Cox regression. (E) Signature scores calculated based on the established model comparing the paired samples between responders (seven pairs) and non-responders (17 pairs) derived from the RNA-seq data of the PERFECT trial. (F) Model H-score calculated based on the established model comparing the post-treatment samples between tumor regression grade (TRG) 0/1 and TRG 2/3 patients in neo_cr and neo_cri groups from the IHC data of ESCC. P values in (E) were derived from two-sided paired Student’s t-test; p values in (F) were derived from two-sided unpaired Student’s t-test; *p<0.05, ** p<0.01. Error bars: mean±SEM. P values in (A, D) were derived from log-rank test. ESCC, esophageal squamous cell carcinoma; TCGA, The Cancer Genome Atlas.

References

    1. Sung H, Ferlay J, Siegel RL, et al. Global cancer statistics 2020: GLOBOCAN estimates of incidence and mortality worldwide for 36 cancers in 185 countries. CA Cancer J Clin 2021;71:209–49. 10.3322/caac.21660 - DOI - PubMed
    1. Jing S-W, Qin J-J, Liu Q, et al. Comparison of neoadjuvant chemoradiotherapy and neoadjuvant chemotherapy for esophageal cancer: a meta-analysis. Future Oncol 2019;15:2413–22. 10.2217/fon-2019-0024 - DOI - PubMed
    1. Sjoquist KM, Burmeister BH, Smithers BM, et al. Survival after neoadjuvant chemotherapy or chemoradiotherapy for resectable oesophageal carcinoma: an updated meta-analysis. Lancet Oncol 2011;12:681–92. 10.1016/S1470-2045(11)70142-5 - DOI - PubMed
    1. Eyck BM, van Lanschot JJB, Hulshof MCCM, et al. Ten-year outcome of neoadjuvant chemoradiotherapy plus surgery for esophageal cancer: the randomized controlled CROSS trial. J Clin Oncol 2021;39:1995–2004. 10.1200/JCO.20.03614 - DOI - PubMed
    1. Yang H, Liu H, Chen Y, et al. Long-term efficacy of neoadjuvant chemoradiotherapy plus surgery for the treatment of locally advanced esophageal squamous cell carcinoma: the NEOCRTEC5010 randomized clinical trial. JAMA Surg 2021;156:721–9. 10.1001/jamasurg.2021.2373 - DOI - PMC - PubMed

Publication types

MeSH terms