. 2023 Nov 29;14(1):7824.
doi: 10.1038/s41467-023-42595-7.

CerS6-dependent ceramide synthesis in hypothalamic neurons promotes ER/mitochondrial stress and impairs glucose homeostasis in obese mice

Affiliations

CerS6-dependent ceramide synthesis in hypothalamic neurons promotes ER/mitochondrial stress and impairs glucose homeostasis in obese mice

Philipp Hammerschmidt et al. Nat Commun. .

Abstract

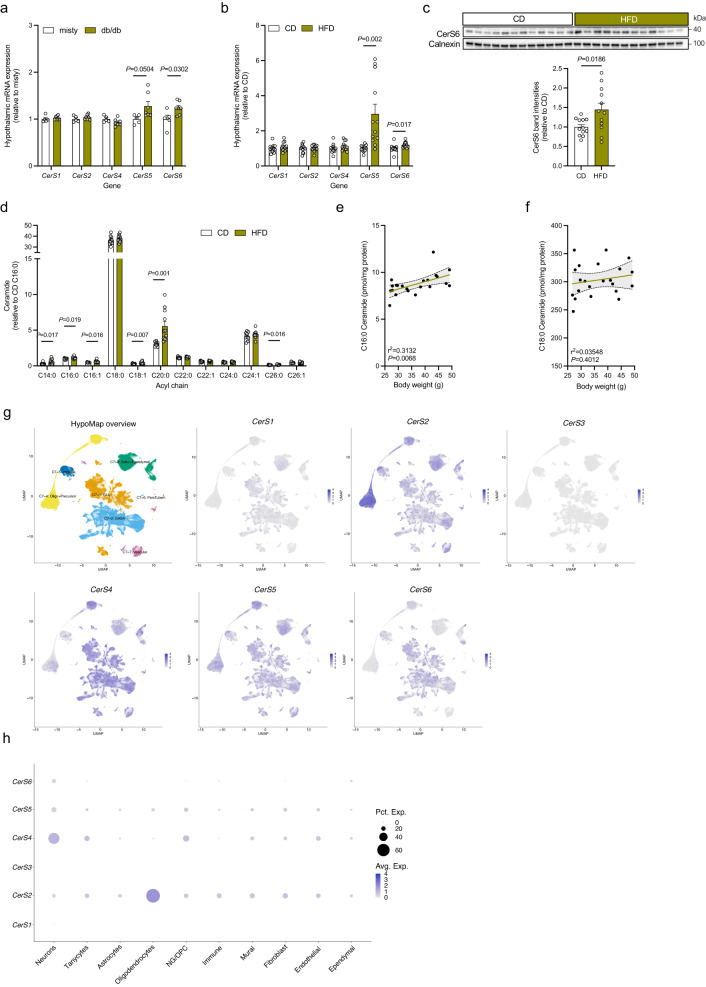
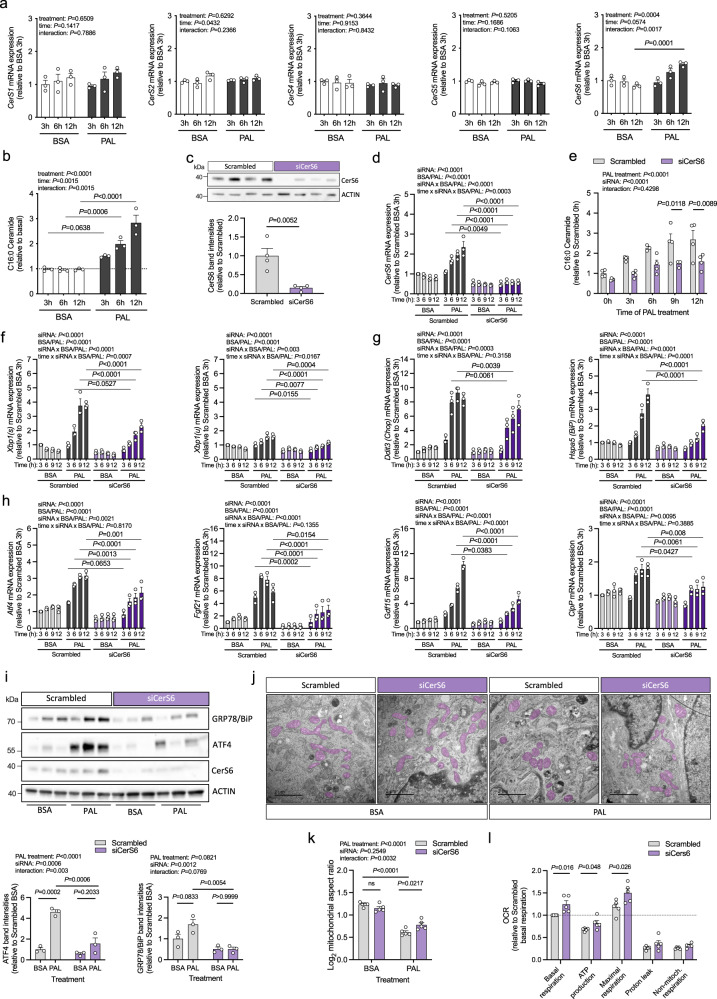
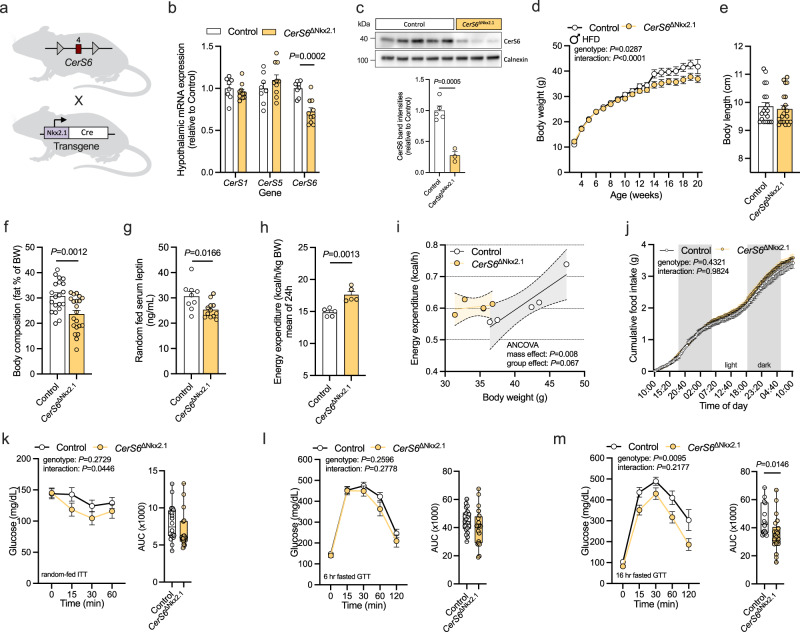
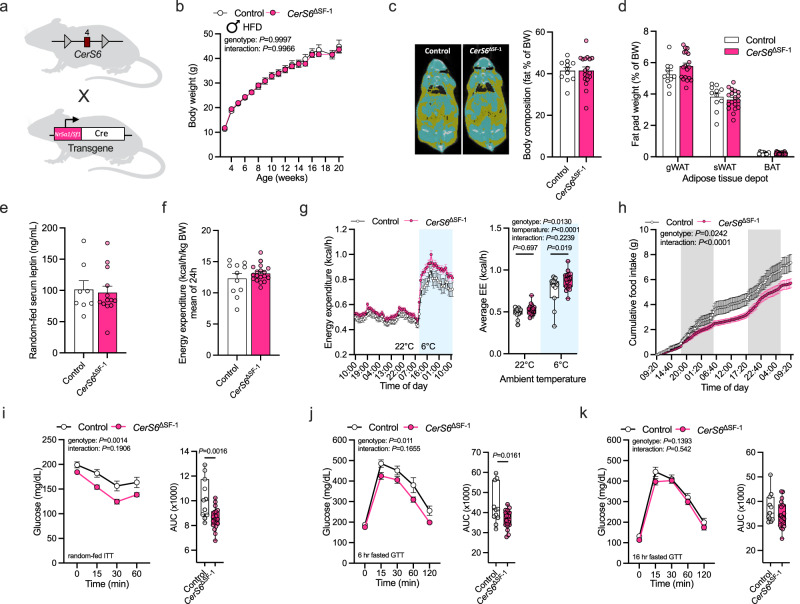
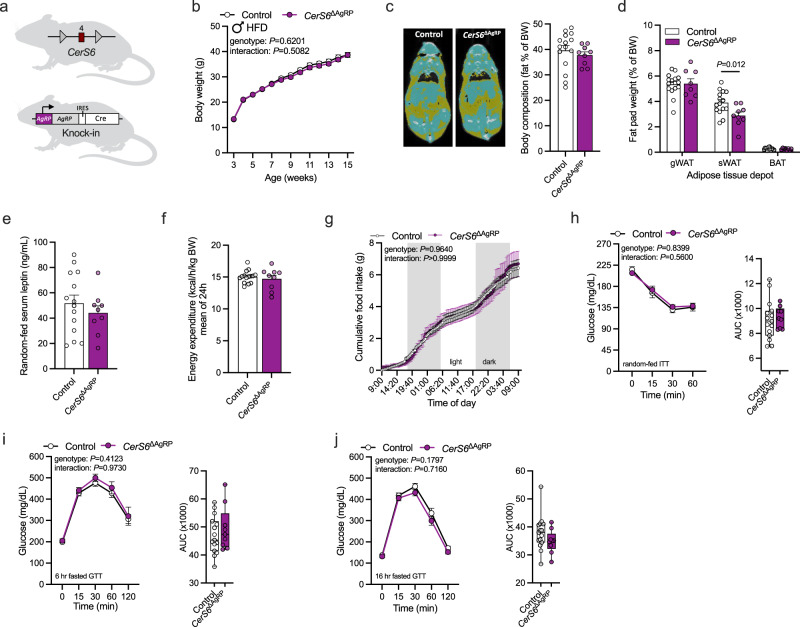
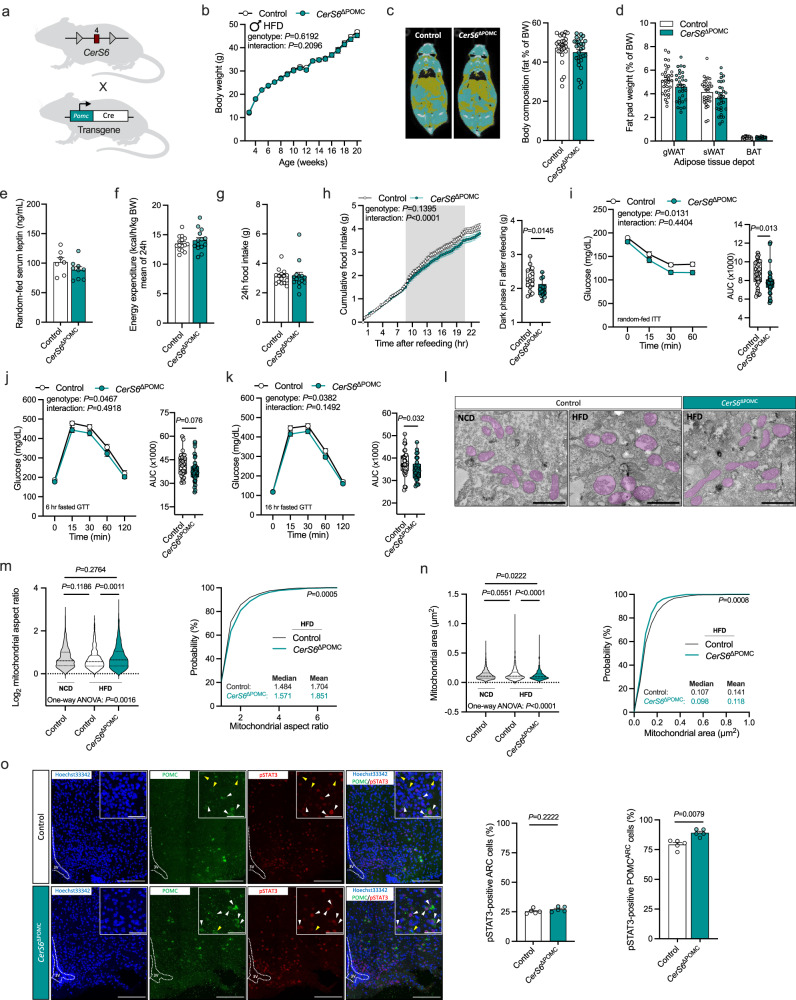
Dysregulation of hypothalamic ceramides has been associated with disrupted neuronal pathways in control of energy and glucose homeostasis. However, the specific ceramide species promoting neuronal lipotoxicity in obesity have remained obscure. Here, we find increased expression of the C16:0 ceramide-producing ceramide synthase (CerS)6 in cultured hypothalamic neurons exposed to palmitate in vitro and in the hypothalamus of obese mice. Conditional deletion of CerS6 in hypothalamic neurons attenuates high-fat diet (HFD)-dependent weight gain and improves glucose metabolism. Specifically, CerS6 deficiency in neurons expressing pro-opiomelanocortin (POMC) or steroidogenic factor 1 (SF-1) alters feeding behavior and alleviates the adverse metabolic effects of HFD feeding on insulin sensitivity and glucose tolerance. POMC-expressing cell-selective deletion of CerS6 prevents the diet-induced alterations of mitochondrial morphology and improves cellular leptin sensitivity. Our experiments reveal functions of CerS6-derived ceramides in hypothalamic lipotoxicity, altered mitochondrial dynamics, and ER/mitochondrial stress in the deregulation of food intake and glucose metabolism in obesity.


Conflict of interest statement

J.C.B. is co-founder of Cerapeutix and has received research funding through collaborations with Sanofi Aventis and Novo Nordisk Inc., which did not affect the content of this article. The remaining authors declare no competing interests.

Figures

Fig. 1
Fig. 1. Hypothalamic CerS6 expression and C16:0 ceramide levels are increased in mouse models of obesity and diabetes.
a, b Relative mRNA expression of the ceramide synthase (CerS) genes in hypothalamus samples of misty and db/db male mice (a n = 5 vs. 7 mice), and C57BL/6 N male mice fed a control diet (CD) or high-fat diet (HFD) for 16 weeks (b n = 12 vs. 12 mice). c Immunoblot and densitometric analysis of CerS6 in hypothalamus lysates of CD- and HFD-fed mice (n = 12 vs. 12 mice). CerS6 band intensities normalized to Calnexin; values expressed relative to CD. Uncropped blots in Source Data. d Ceramide levels in the hypothalamus of CD- and HFD-fed mice (n = 11 vs. 11 mice) relative to the C16:0 ceramide content in CD-fed mice. e, f Linear regression model of the hypothalamic content of C16:0 ceramide (e) and C18:0 ceramide (f) plotted against the body weight of CD- and HFD-fed mice (n = 22 mice). Dotted lines indicate the 95% confidence interval; r2 denotes the coefficient of determination. g Uniform Manifold Approximation and Projection (UMAP) plots of single-cell sequencing data according to HypoMap. HypoMap overview is colored by major cell types, with the orange-colored cluster depicting GLUtamatergic neurons and the light blue-colored cluster depicting GABAergic neurons. Corresponding UMAP plots are colored by log-normalized gene expression of CerS1-6. h Dot plots displaying relative expression of CerS1-6 in major cell types according to single-cell sequencing results harmonized in HypoMap. Data in ad are represented as mean values ± SEM, including data points of individual mice entering the analysis. P-values calculated using two-tailed unpaired Student’s t-test (ad) or simple linear regression modeling (e, f). Source data and further details of statistical analyses are provided as a Source Data file.
Fig. 2
Fig. 2. Inhibition of CerS6-dependent ceramide synthesis in hypothalamic neurons attenuates palmitate-induced ER/mitochondrial stress and mitochondrial fragmentation.
a Relative mRNA expression of CerS1-6 in N43/5 cells following palmitate (PAL, black) or BSA treatment (BSA, white) for the time indicated in hours (h) (n = 3 independent experiments). b C16:0 ceramide levels relative to the C16:0 ceramide content in untreated cells (basal, dotted line) (n = 3 independent experiments). c Immunoblot analysis of CerS6, 57 h after transfection with an siRNA targeting CerS6 (siCerS6, purple) or scrambled control (Scrambled, gray). CerS6 band intensities normalized to ACTIN; values expressed as relative to control (n = 4 independent experiments). Uncropped blots in Source Data. d Relative mRNA expression of CerS6 in siRNA-treated cells incubated with BSA or PAL for the time indicated (n = 3 independent experiments). e Relative C16:0 ceramide levels in siRNA-treated cells after incubation with PAL for the time indicated (n = 4 independent experiments; n = 3 for Scrambled 6 h). fh Relative mRNA expression of spliced Xbp1 (Xbp1(s)) and unspliced Xbp1 (Xbp1(u)) (f), the ER stress markers Ddit3 and Hspa5 (g), and the mitochondrial stress markers Atf4, Fgf21, Gdf15, and ClpP (h) in siRNA-treated cells incubated with BSA or PAL for the time indicated (n = 3 independent experiments). i Immunoblot analysis of ATF4 (left quantification), GRP78/BiP (right quantification), and CerS6 in siRNA-treated cells incubated with BSA or PAL for 9 h. Band intensities normalized to ACTIN; values expressed as relative to BSA-treated scrambled control (n = 3 independent cultures). Uncropped blots in Source Data. j TEM images of siRNA-treated cells incubated with BSA or PAL for 9 h (mitochondria are highlighted in purple, scale bars: 2 µm). k Quantification of log2-transformed mitochondrial aspect ratios from TEM images as represented in (j) (n = 5 independent experiments; aspect ratios from a minimum of 10 cells/group/experiment). l Mitochondrial oxygen consumption rates (OCR) in siRNA-treated N43/5 cells incubated with PAL for 9 h (n = 5 independent experiments with 46 technical replicates per run). Data represented as mean values of n independent experiments ±SEM. Individual data points in (dfh) represent the average of three replicate culture dishes per experiment. P-values calculated using two-tailed unpaired Student’s t-test (cl), two-way ANOVA and Bonferroni’s (a, be) or Tukey’s multiple comparison test (ik), or three-way ANOVA and Tukey’s multiple comparison test (dfh). Source data and further details of statistical analyses are provided as a Source Data file.
Fig. 3
Fig. 3. Depletion of CerS6 in hypothalamic neurons attenuates diet-induced obesity and improves insulin sensitivity and energy metabolism in HFD-fed male mice.
a CerS6fl/fl mice in which exon 4 of CerS6 (red square) is flanked by loxP sites (gray triangles) were bred to mice with transgenic expression of the Cre recombinase (white rectangle) under control of the Nkx2.1 promoter (purple rectangle). Nkx2.1-Cre-positive CerS6fl/fl mice (CerS6ΔNkx2.1, yellow) and Cre-negative CerS6fl/fl control littermates (Control, white) were used for analysis. b Relative mRNA expression of CerS1, CerS5, and CerS6 in hypothalamus samples of HFD-fed control animals and CerS6ΔNkx2.1 mice determined by qPCR analysis (n = 8 vs. 10 mice). c Immunoblot analysis of CerS6 in hypothalamus lysates of controls and CerS6ΔNkx2.1 mice fed a HFD (n = 5 vs. 3 mice). CerS6 protein band intensities normalized to Calnexin and values expressed as relative to control. Uncropped blots in Source Data. d Body weight development of mice during HFD feeding (n = 7–35 vs. 11–36 mice/week). e Body length in adult mice (n = 20 vs. 21 mice). f Body fat content relative to body weight (n = 20 vs. 21 mice). g Random-fed serum leptin levels (n = 9 vs. 12 mice). h Average energy expenditure over 24 h normalized for body weight (n = 5 vs. 5 mice). i Regression-based analysis of absolute energy expenditure against body weight (n = 5 vs. 5 mice). Dotted lines indicate the 95% confidence interval. j Cumulative food intake over 48 h (n = 5 vs. 6 mice; gray background indicates dark phase). k Insulin tolerance test and area under the curve (AUC) for each mouse (n = 20 vs. 18 mice). l Glucose tolerance test following a 6 h fasting period and AUCs (n = 21 vs. 20 mice). m Glucose tolerance test following a 16 h fasting period and AUCs (n = 14 vs. 22 mice). All data obtained from male mice. Data in (bh) and longitudinal data in (jm) are represented as mean values ± SEM. P-values calculated using two-tailed unpaired Student’s t-test (b, c, fh, and AUC in m), a mixed-effects model (d), analysis of covariance (ANCOVA) (i), or two-way RM ANOVA (j, longitudinal analysis in km). Source data and further details of statistical analyses are provided as a Source Data file. Illustration in (a) created with BioRender.com.
Fig. 4
Fig. 4. Depletion of CerS6 in SF-1 neurons affects cold-induced energy expenditure and improves glucose metabolism in HFD-fed male mice.
a CerS6fl/fl mice in which exon 4 of CerS6 (red square) is flanked by loxP sites (gray triangles) were bred to mice carrying a transgene for Cre expression (white rectangle) under control of the SF−1 promoter (pink rectangle). SF-1-Cre-positive CerS6fl/fl mice (CerS6ΔSF-1, pink) and Cre-negative CerS6fl/fl littermate controls (Control, white) were used for analysis. b Body weight development of mice during HFD feeding (n = 6–11 vs. 9–18 mice/weeks). c CT scans (yellow, fat tissue; blue, non-adipose soft tissue) and body fat content relative to body weight (n = 11 vs. 18 mice). d Fat-pad weights of gonadal white adipose tissue (gWAT), subcutaneous WAT (sWAT), and brown adipose tissue (BAT) relative to body weight (n = 11 vs. 18 mice). e Serum leptin levels of random-fed mice (n = 8 vs. 13 mice). f Average energy expenditure over 24 h normalized for body weight (n = 11 vs. 18 mice). g Absolute energy expenditure (EE) at 22 °C ambient temperature (white background) and upon exposure to 6 °C (blue background), over time (left) and in average (right; n = 11 vs. 18 mice). h Cumulative food intake over 48 h (n = 11 vs. 18 mice, gray background indicates dark phase). i Insulin tolerance test and area under the curve (AUC) for each mouse (n = 11 vs. 18 mice). j, k Glucose tolerance test following a 6 h (j) or 16 h (k) fasting period and AUCs (n = 11 vs. 18 mice). All data obtained from male mice. Data in (bf) and longitudinal data in (gk) are represented as mean values ± SEM. Boxplots indicate median ±min/max and include data points of individual mice entering the analysis. P-values calculated using two-tailed unpaired Student’s t-test (AUCs in i, j), two-way ANOVA and Bonferroni’s multiple comparison test (Average EE in g), two-way RM ANOVA (longitudinal analysis in hk), or a mixed-effects model (b). Source data and further details of statistical analyses are provided as a Source Data file. Illustration in (a) created with BioRender.com.
Fig. 5
Fig. 5. Depletion of CerS6 in AgRP neurons does not affect glucose and energy metabolism in HFD-fed male mice.
a CerS6fl/fl mice (top) in which exon 4 of CerS6 (red square) is flanked by loxP sites (gray triangles) were bred to mice expressing Cre from the endogenous AgRP locus (right). The Internal Ribosome Entry Side (IRES) is used to ensure bicistronic expression of AgRP and Cre. AgRP-Cre-positive CerS6fl/fl mice (CerS6ΔAgRP, purple) and Cre-negative CerS6fl/fl control littermates (Control, white) were used for analysis. b Body weight development of mice during HFD feeding (n = 15 vs. 9 mice/week). c CT scans (yellow, fat tissue; blue, non-adipose soft tissue) and body fat content relative to body weight (n = 15 vs. 9 mice). d Fat-pad weights of gonadal white adipose tissue (gWAT; n = 15 vs. 8 mice), subcutaneous WAT (sWAT; n = 15 vs. 9 mice), and brown adipose tissue (BAT; n = 15 vs. 8 mice) relative to body weight. e Serum leptin levels of random-fed mice (n = 14 vs. 9 mice). f Average energy expenditure over 24 h normalized for body weight (n = 15 vs. 9 mice). g Cumulative food intake over 48 h (n = 15 vs. 9 mice; gray background indicates dark phase). h Insulin tolerance test and area under the curve (AUC) for each mouse (n = 15 vs. 9 mice). i, j Glucose tolerance test following a 6 h (i) or 16 h (j) fasting period and AUCs (n = 15 vs. 9 mice). All data obtained from male mice. Data in (bg) and longitudinal data in (hj) are represented as mean values ± SEM. Boxplots indicate median ±min/max and include data points of individual mice entering the analysis. P-values calculated using two-tailed unpaired Student’s t-test (d) or two-way RM ANOVA (longitudinal analysis in bgj). Source data and further details of statistical analyses are provided as a Source Data file. Illustration in (a) created with BioRender.com.
Fig. 6
Fig. 6. Depletion of CerS6 in POMC neurons affects mitochondrial morphology, feeding behavior, and glucose metabolism in HFD-fed male mice.
a CerS6fl/fl mice in which exon 4 of CerS6 (red square) is flanked by loxP sites (gray triangles) were bred to mice with transgenic Cre expression under control of the POMC promoter (green). POMC-Cre-positive CerS6fl/fl mice (CerS6ΔPOMC, green) and Cre-negative CerS6fl/fl control littermates (Control, white) were used for analysis. b Body weight development of mice during HFD feeding (n = 17–32 vs.16–33 mice/week). c CT scans (yellow, fat tissue; blue, non-adipose soft tissue) and body fat content relative to body weight (n = 27 vs. 28 mice). d Fat-pad weights of gonadal white adipose tissue (gWAT, n = 31 vs. 32 mice), subcutaneous WAT (sWAT, n = 31 vs. 32 mice), and brown adipose tissue (BAT, n = 26 vs. 27 mice) relative to body weight. e Serum leptin levels of random-fed mice (n = 7 vs. 9 mice). f Average energy expenditure over 24 h normalized for body weight (n = 15 vs 14 mice). g Food intake over 24 h (n = 15 vs. 14 mice). h Cumulative food intake after refeeding following a 16-h fasting period (gray background indicates dark phase) and absolute dark phase food intake (FI) after refeeding (n = 15 vs.14 mice). i Insulin tolerance test and area under the curve (AUC) for each mouse (n = 32 vs. 32 mice). j, k Glucose tolerance test following a 6 h (j) or 16 h (k) fasting period and AUCs (n = 32 vs. 33 mice). l Transmission electron micrographs of mitochondria in ARC POMC neurons of control male mice fed a normal chow (NCD, left) or HFD (middle) for 8 weeks, and HFD-fed CerS6ΔPOMC mice (right; mitochondria are highlighted in purple; scale bars: 1 µm; acquired images were quantified in m, n). m Violin plots of log2-transformed mitochondrial aspect ratios (left) and cumulative distribution function (probability plot) of mitochondrial aspect ratios in HFD-fed mice (right) quantified from TEM images as represented in l (Control NCD: n = 793, Control HFD: n = 1010, CerS6ΔPOMC HFD: n = 737 mitochondria from 3-6 POMC neurons/mouse, 3 mice/group). n Violin plots (left) and probability plots (right) of mitochondrial area in HFD-fed mice quantified from TEM images as represented in l (Control NCD: n = 793, Control HFD: n = 1010, CerS6ΔPOMC HFD: n = 737 mitochondria from 3-6 POMC neurons/mouse, 3 mice/group). o Left: Confocal images of POMC (green) and pSTAT3 (red) immunoreactivity in coronal ARC brain sections of 16-h fasted HFD-fed controls (top) and CerS6ΔPOMC mice (bottom), 45 min after injection of leptin (6 mg/kg ip; white arrows indicate cells positive for POMC and pSTAT3, yellow arrows indicate cells positive for POMC and negative for pSTAT3; scale bars: 150 µm for overview images and 50 µm for zoom images; blue staining depicts nuclei stained by Hoechst33342). Right: quantification of pSTAT3-positive cells in the ARC relative to all imaged ARC cells (left) or pSTAT3/POMC-positive cells relative to all imaged POMC-positive cells in the ARC (right; n = 5 vs. 5 mice). All data obtained from male mice. Data in (bg, o) and longitudinal data in (hk) are represented as mean values ± SEM. Boxplots indicate median ±min/max and include data points of individual mice entering the analysis. Dashed lines in the violin plots indicate median and dotted lines indicate the first and third quartile, respectively. P-values calculated using two-tailed unpaired Student’s t-test (dark phase FI in h, AUC in ik), two-tailed Wilcoxon–Mann–Whitney test (o), one-way ANOVA followed by Tukey’s multiple comparison test (m, n), Kolmogorov–Smirnov test (distributions in m, n), two-way RM ANOVA (longitudinal analysis in h, ik), or a mixed-effects model (b). Source data and further details of statistical analyses are provided as a Source Data file. Illustration in (a) created with BioRender.com.

References

    1. Dietrich MO, Horvath TL. Hypothalamic control of energy balance: insights into the role of synaptic plasticity. Trends Neurosci. 2013;36:65–73. - PubMed
    1. Ruud J, Steculorum SM, Bruning JC. Neuronal control of peripheral insulin sensitivity and glucose metabolism. Nat. Commun. 2017;8:15259. - PMC - PubMed
    1. Timper K, Bruning JC. Hypothalamic circuits regulating appetite and energy homeostasis: pathways to obesity. Dis. Model Mech. 2017;10:679–689. - PMC - PubMed
    1. Lam TK, Schwartz GJ, Rossetti L. Hypothalamic sensing of fatty acids. Nat. Neurosci. 2005;8:579–584. - PubMed
    1. Jordan SD, Konner AC, Bruning JC. Sensing the fuels: glucose and lipid signaling in the CNS controlling energy homeostasis. Cell Mol. Life Sci. 2010;67:3255–3273. - PMC - PubMed

Publication types