. 2023 Nov 28;14(1):7819.
doi: 10.1038/s41467-023-43183-5.

Nuclear actin polymerization rapidly mediates replication fork remodeling upon stress by limiting PrimPol activity

Affiliations

Nuclear actin polymerization rapidly mediates replication fork remodeling upon stress by limiting PrimPol activity

Maria Dilia Palumbieri et al. Nat Commun. .

Abstract

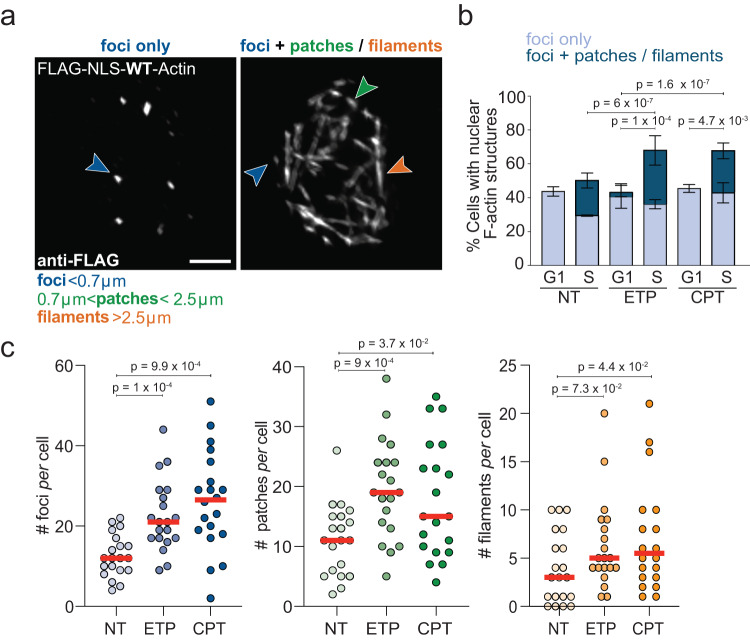
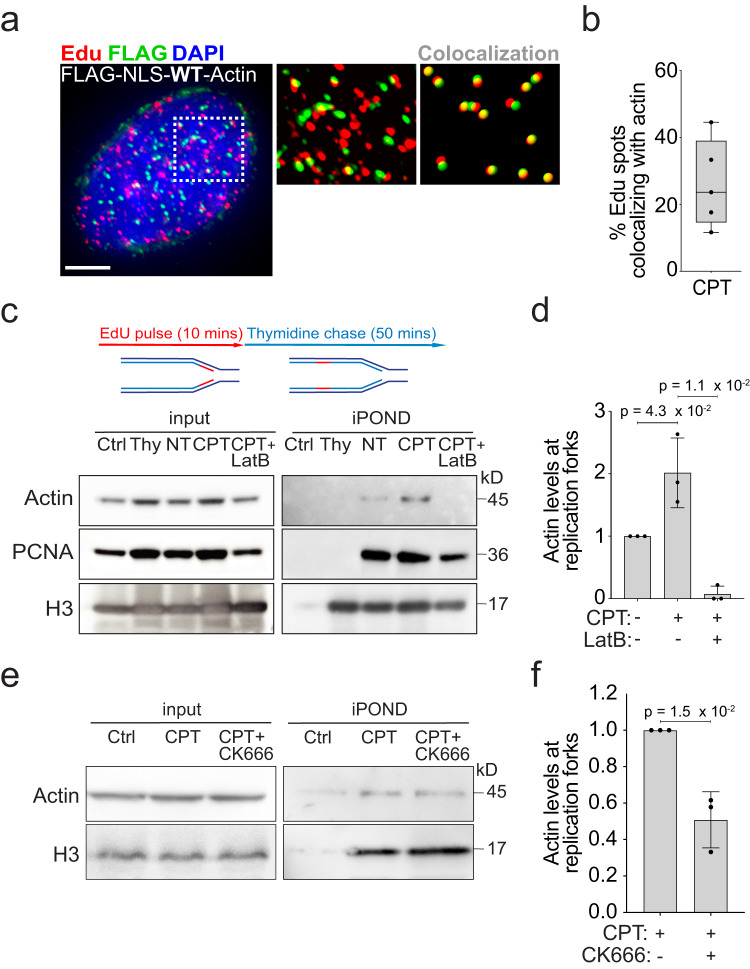
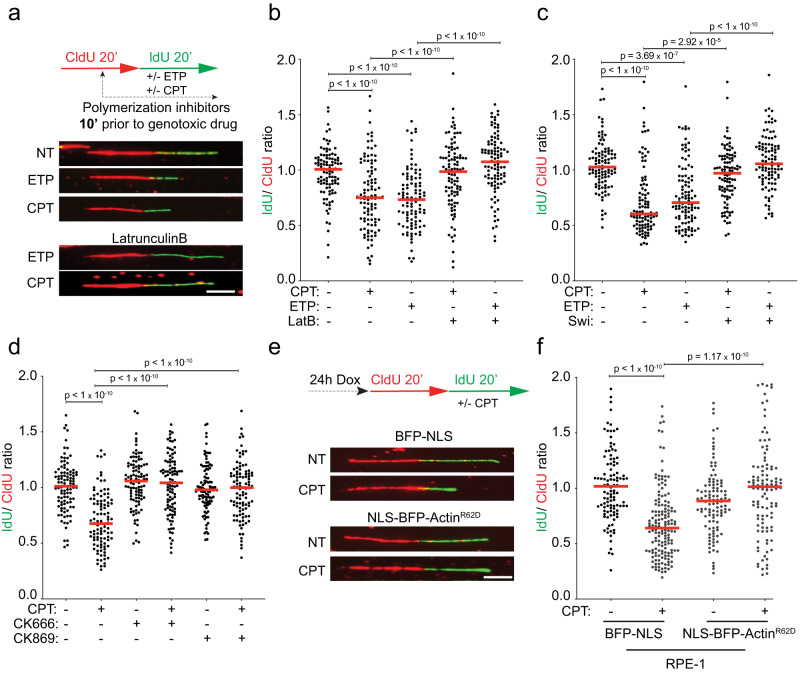
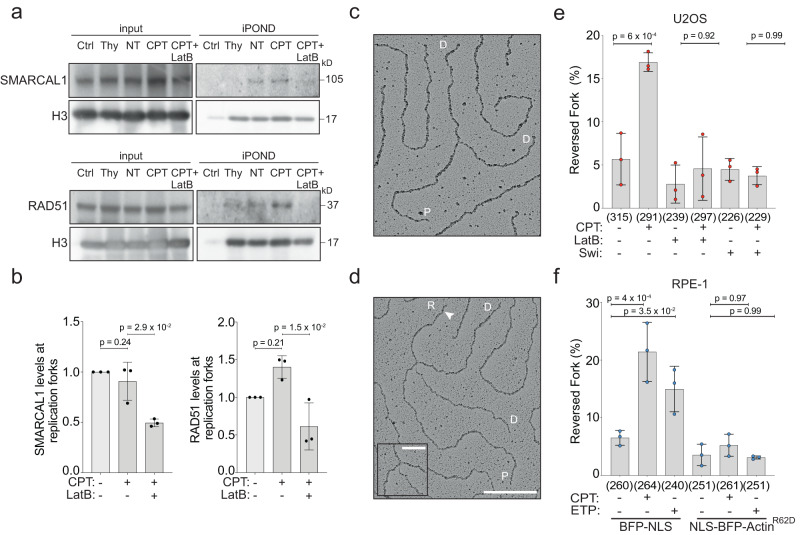
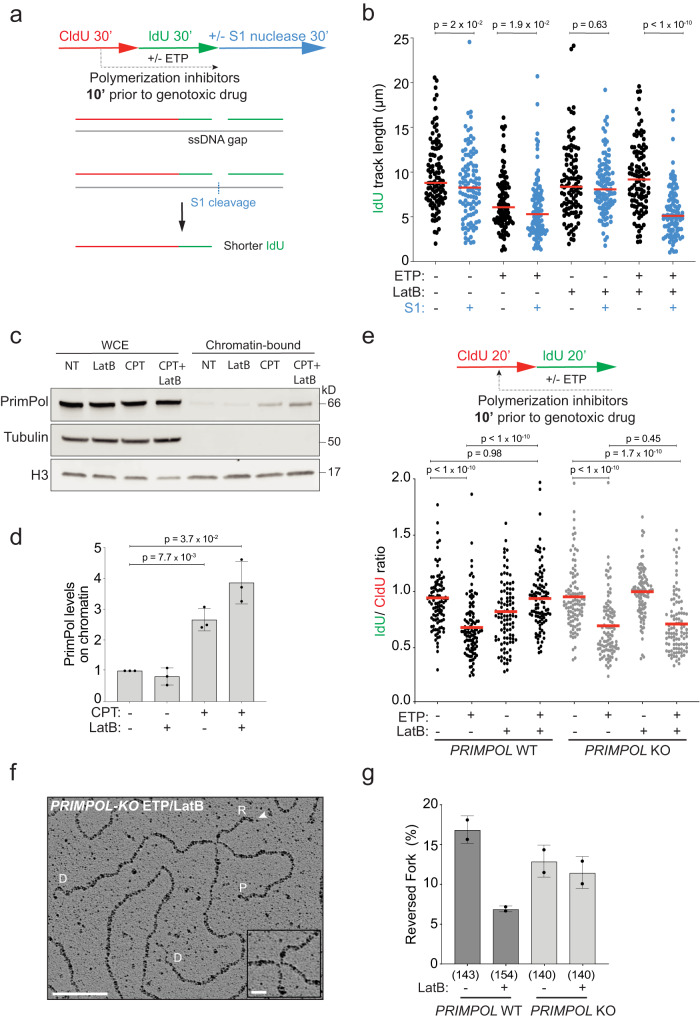
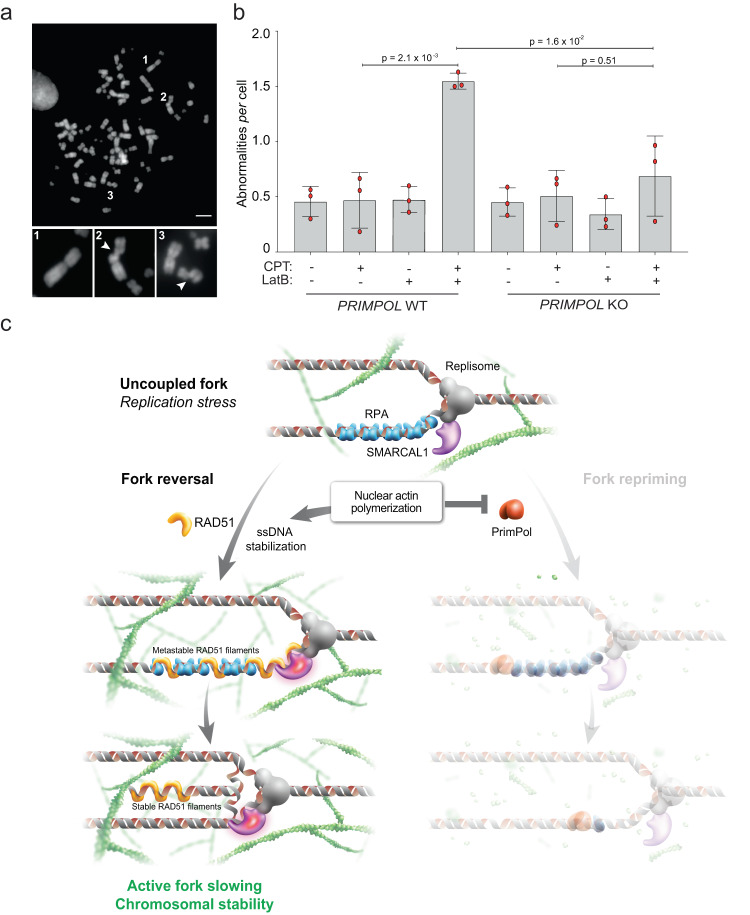
Cells rapidly respond to replication stress actively slowing fork progression and inducing fork reversal. How replication fork plasticity is achieved in the context of nuclear organization is currently unknown. Using nuclear actin probes in living and fixed cells, we visualized nuclear actin filaments in unperturbed S phase and observed their rapid extension in number and length upon genotoxic treatments, frequently taking contact with replication factories. Chemically or genetically impairing nuclear actin polymerization shortly before these treatments prevents active fork slowing and abolishes fork reversal. Defective fork remodeling is linked to deregulated chromatin loading of PrimPol, which promotes unrestrained and discontinuous DNA synthesis and limits the recruitment of RAD51 and SMARCAL1 to nascent DNA. Moreover, defective nuclear actin polymerization upon mild replication interference induces chromosomal instability in a PRIMPOL-dependent manner. Hence, by limiting PrimPol activity, nuclear F-actin orchestrates replication fork plasticity and is a key molecular determinant in the rapid cellular response to genotoxic treatments.


Conflict of interest statement

The authors declare no competing interests.

Figures

Fig. 1
Fig. 1. Nuclear F-actin structures in replicating cells upon mild genotoxic treatments.
a Representative images of nuclear F-Actin structures detected in S phase U2OS cells, stably expressing FLAG-NLS-WT-Actin. Scale bar = 5 μm. According to their length, the structures were divided into three categories: foci (<0.7 μm), patches (>0.7 μm and <2.5 μm) and filaments (>2.5 μm). b Percentage of cells with actin structures (foci only or foci + patches/ filaments) in G1 (EdU-, diameter <15 μm based on DAPI) or S phase (EdU+). As indicated, cells were either left untreated (NT) or treated for 1 h with 20 nM etoposide (+ETP) or 100 nM camptothecin (+CPT). Data are mean ± SD; N = 404 (NT, S), N = 378 (ETP, S), N = 396 (CPT, S), N = 66 (NT, G1), N = 63 (ETP, G1), N = 53 (CPT, G1) from three independent experiments. Statistical analysis: two-tailed Mann–Whitney test applied to total F-actin structures. c Number of actin structures per cell. Cells were left untreated (NT) or treated for 1 h with 20 nM ETP or 100 nM CPT. Twenty cells were analyzed in each condition in three independent experiments. Red lines indicate the median. Statistical analysis: two-tailed Mann–Whitney test. See Supplementary Fig. 1p for compiled repetitions. Source data are provided as a Source Data file.
Fig. 2
Fig. 2. Nuclear F-actin interaction with replication factories and nascent DNA.
a Representative image of a cell treated for 1 h with 100 nM CPT, stained for EdU and nuclear F-Actin (FLAG-NLS-Actin). Zoomed detail highlights EdU foci overlapping with F-Actin foci (yellow) quantified in Imaris. Scale bar = 10 μm b Quantification of Fig. 2a (see “Methods” for details) performed on 5 cells displayed as black dots. Box extends from the 25th to the 75th percentile. Line in the box represents the median. Whiskers extend down to the smallest and up to the highest value. c–f Isolation of proteins on nascent DNA (iPOND). c Top: Simplified experimental setup: 10 min EdU pulse in HEK293T cells optionally followed by a 50 min thymidine chase (Thy), discriminating chromatin-associated proteins behind replication forks. See Supplementary Fig. 2a for details. Bottom: Western blot analysis of cells optionally treated with CPT (100 nM, 1 h). Where indicated, LatB (100 nM) was added 10 min prior to CPT and retained. Proteins associated with nascent DNA were isolated by iPOND and detected with the indicated antibodies. Click reaction is performed using DMSO instead of biotin azide as a specificity control (Ctrl). d Graph-bar depicts mean ± SD of Actin protein levels at nascent DNA from three independent experiments (black dots). Values are normalized to H3 and displayed as fold change over NT. Statistical analysis: One-tailed t-test with Welch’s correction. e Western blot analysis of cells optionally treated with CPT (100 nM, 1 h). Where indicated, 100 nM CK666 was added 10 min prior to CPT and retained. Proteins associated with nascent DNA were isolated by iPOND and detected with the indicated antibodies. Ctrl sample as in (c). f Graph-bar depicts mean ± SD of Actin protein levels at nascent DNA from three independent experiments (black dots). Values are normalized to H3 and displayed as fold change over CPT. Statistical analysis: one-tailed t-test with Welch’s correction. Source data are provided as a Source Data file.
Fig. 3
Fig. 3. Nuclear actin polymerization is required for active fork slowing upon mild genotoxic stress.
ad DNA fiber analysis of U2OS cells. a Top: Schematic CldU/IdU pulse-labeling protocol used to evaluate fork progression upon 100 nM CPT or 20 nM ETP. 100 nM LatB, Swi, CK666 or CK869 were added 10 min prior to CPT or ETP and retained during the IdU labelling. Bottom: Representative DNA fiber images. Scale bar = 5 μm. bd, f IdU/CIdU ratio is plotted for a minimum of 100 forks (indicated as black dots) from a single representative experiment. Red line indicates the median. See Supplementary Fig. 3b–d, h for compiled repetitions (n = 3). Statistical analysis: two-tailed Mann–Whitney test. e, f DNA fiber analysis of RPE-1 cells stably expressing doxycycline inducible BFP-NLS or NLS-BFP-ActinR62D. e Top: schematic of the CldU/IdU pulse-labeling protocol used to evaluate fork progression upon 100 nM CPT. Doxyclicline (Dox) was added 24 h before CldU/IdU pulse-labeling. Bottom: representative DNA fibers images. Scale bar = 5 μm. Source data are provided as a Source Data file.
Fig. 4
Fig. 4. Nuclear F-actin modulates the engagement of replication fork remodellers and fork reversal.
a iPOND analysis of HEK293T cells after indicated treatments (100 nM CPT, 1 h; 100 nM LatB, 10 min prior to CPT). See Supplementary Fig. 2a for details. Proteins associated with nascent DNA were isolated by iPOND and detected with the indicated antibodies. In the control (Ctrl) experiment, the click reaction is performed using DMSO instead of biotin azide. Same representative experiment as in Fig. 2c, d. b Graph-bar depicts mean and SD of quantified RAD51 and SMARCAL1 levels at nascent DNA from three independent iPOND experiments (black dots). Values are normalized to H3 and represented as fold change over the NT sample. Statistical analysis: one-tailed t-test with Welch’s correction. c, d Electron micrographs of representative replication forks from U2OS cells: parental (P) and daughter (D) duplexes. d White arrow indicates the regressed arm (R); the four-way junction at the reversed fork is in the inset. Scale bar = 200 nm, 40 nm in the inset. e Frequency of reversed replication forks isolated from U2OS cells upon optional treatment with 100 nM CPT for 1 h. 100 nM LatB or Swi were added 10 min before CPT and retained during the genotoxic treatment. Total number of molecules analyzed per condition in brackets. f Frequency of reversed replication forks isolated from RPE-1 cells after 24 h doxycycline-induction of either BFP-NLS or NLS-BFP-ActinR62D and optional treatment with CPT (100 nM, 1 h) or ETP (20 nM, 1 h). Total number of molecules analyzed per condition in brackets. e, f Bar graphs depict mean ± SD from three independent EM experiments (red and blue dots, respectively). Statistical analysis: ordinary one-way ANOVA. Source data are provided as a Source Data file.
Fig. 5
Fig. 5. PrimPol deregulation prevents efficient fork remodeling upon defective actin polymerization.
a Timeline of CldU/IdU pulse-labeling coupled with 30 min S1 nuclease treatment to detect ssDNA gaps on nascent DNA upon optional treatment with 20 nM ETP. 100 nM LatB was added 10 min prior to ETP and retained. b IdU track length (μm) is plotted as readout of discontinuous DNA synthesis for a minimum of 100 forks (black or blue dots) per sample in a single, representative experiment. Red lines indicate the median. See Supplementary Fig. 5d for compiled repetitions (n = 3). Statistical analysis: two-tailed Mann–Whitney test. c Representative immunoblot of the indicated proteins in whole cell extracts (WCE) or the chromatin bound fraction. d Bar graph depicts mean ± SD of chromatin bound PrimPol levels from three independent experiments from c (black dots). Values are normalized to H3 and represented as fold change over NT. Statistical analysis: one-tailed t-test with Welch’s correction. e DNA fiber analysis of U2OS PRIMPOL WT and KO cells. Top: CldU/IdU pulse-labeling protocol to evaluate fork progression upon 20 nM ETP. 100 nM LatB was added 10 min prior to ETP and retained during the IdU labelling. Bottom: IdU/CldU ratio plotted for a minimum of 100 forks per sample (black dots) from a single, representative experiment. Red line indicates median. See Supplementary Fig. 5e for compiled repetitions (n = 3). Statistical analysis: two-tailed Mann–Whitney test. f Representative electron micrograph of a reversed fork isolated from PRIMPOL KO cells, priorly treated with ETP and LatB; parental (P) and daughter (D) duplexes. White arrow indicates the regressed arm (R); the four-way junction at the reversed fork is magnified in the inset. Scale bar = 100 nm, 10 nm in the inset. g Frequency of reversed replication forks isolated from U2OS cells (proficient (WT) or deficient (KO) for PRIMPOL) upon 1 h of 20 nM ETP. 100 nM LatB was added where indicated 10 min before ETP and retained. Bar graph depicts mean ± SD from two independent EM experiments (black dots). Total number of molecules analyzed per condition in brackets. Source data are provided as a Source Data file.
Fig. 6
Fig. 6. Nuclear F-actin limits chromosomal instability upon genotoxic treatments by limiting PrimPol function and promoting efficient fork remodeling.
a Representative metaphase spread image. Scale-bar = 5 μm. 1 = representative intact chromosome. 2, 3 = representative breaks. b Number of chromosomal abnormalities in U2OS cells (proficient for (WT) or lacking (KO) PRIMPOL) optionally treated with 100 nM CPT for 2 h. Where indicated, 100 nM LatB was added 10 min before CPT and retained. Bar graph depicts mean ± SD from three independent experiments (red dots). A minimum of 30 metaphases was analyzed per sample and experiment. Statistical analysis: one-way ordinary ANOVA. c Working model: nuclear F-actin polymerization limits PrimPol recruitment to uncoupled replication forks, stabilizing ssDNA stretches. This facilitates RAD51 recruitment to stalled/uncoupled forks and promotes SMARCAL1-dependent fork reversal, mediating active fork slowing and protecting the integrity of replicating chromosomes. A graphical representation of the consequences of defective nuclear actin polymerization is depicted in Supplementary Fig. 6c (see Discussion for details). Source data are provided as a Source Data file.

Update of

References

    1. Saxena S, Zou L. Hallmarks of DNA replication stress. Mol. Cell. 2022;82:2298–2314. doi: 10.1016/j.molcel.2022.05.004. - DOI - PMC - PubMed
    1. Macheret M, Halazonetis TD. DNA replication stress as a hallmark of cancer. Annu. Rev. Pathol. 2015;10:425–448. doi: 10.1146/annurev-pathol-012414-040424. - DOI - PubMed
    1. Forment JV, O’Connor MJ. Targeting the replication stress response in cancer. Pharmacol. Ther. 2018;188:155–167. doi: 10.1016/j.pharmthera.2018.03.005. - DOI - PubMed
    1. Baillie KE, Stirling PC. Beyond kinases: targeting replication stress proteins in cancer Therapy. Trends Cancer. 2021;7:430–446. doi: 10.1016/j.trecan.2020.10.010. - DOI - PubMed
    1. Berti M, Cortez D, Lopes M. The plasticity of DNA replication forks in response to clinically relevant genotoxic stress. Nat. Rev. Mol. Cell Biol. 2020;18:622–19. - PubMed

Publication types